Switching Overview - MS Health
Overview
The Meraki Dashboard today, displays and provides a variety of metrics and insights on the performance and health of the switch network but this information is spread across multiple dashboard pages. The Switching Overview feature is designed to consolidate various key performance indicators for switches and represent them in a single panel to provide a bird's eye view of how the switch network is performing. The Switching Overview feature tends to highlight issues in the form of alerts and events, along with that provide information and reporting data such as active port utilization, PoE budget utilization for users to be able to better understand and plan their network needs.
The Switching Overview panel will show up when you click on the Switch card of the Health widget on the Network-wide -> Clients page as shown below:
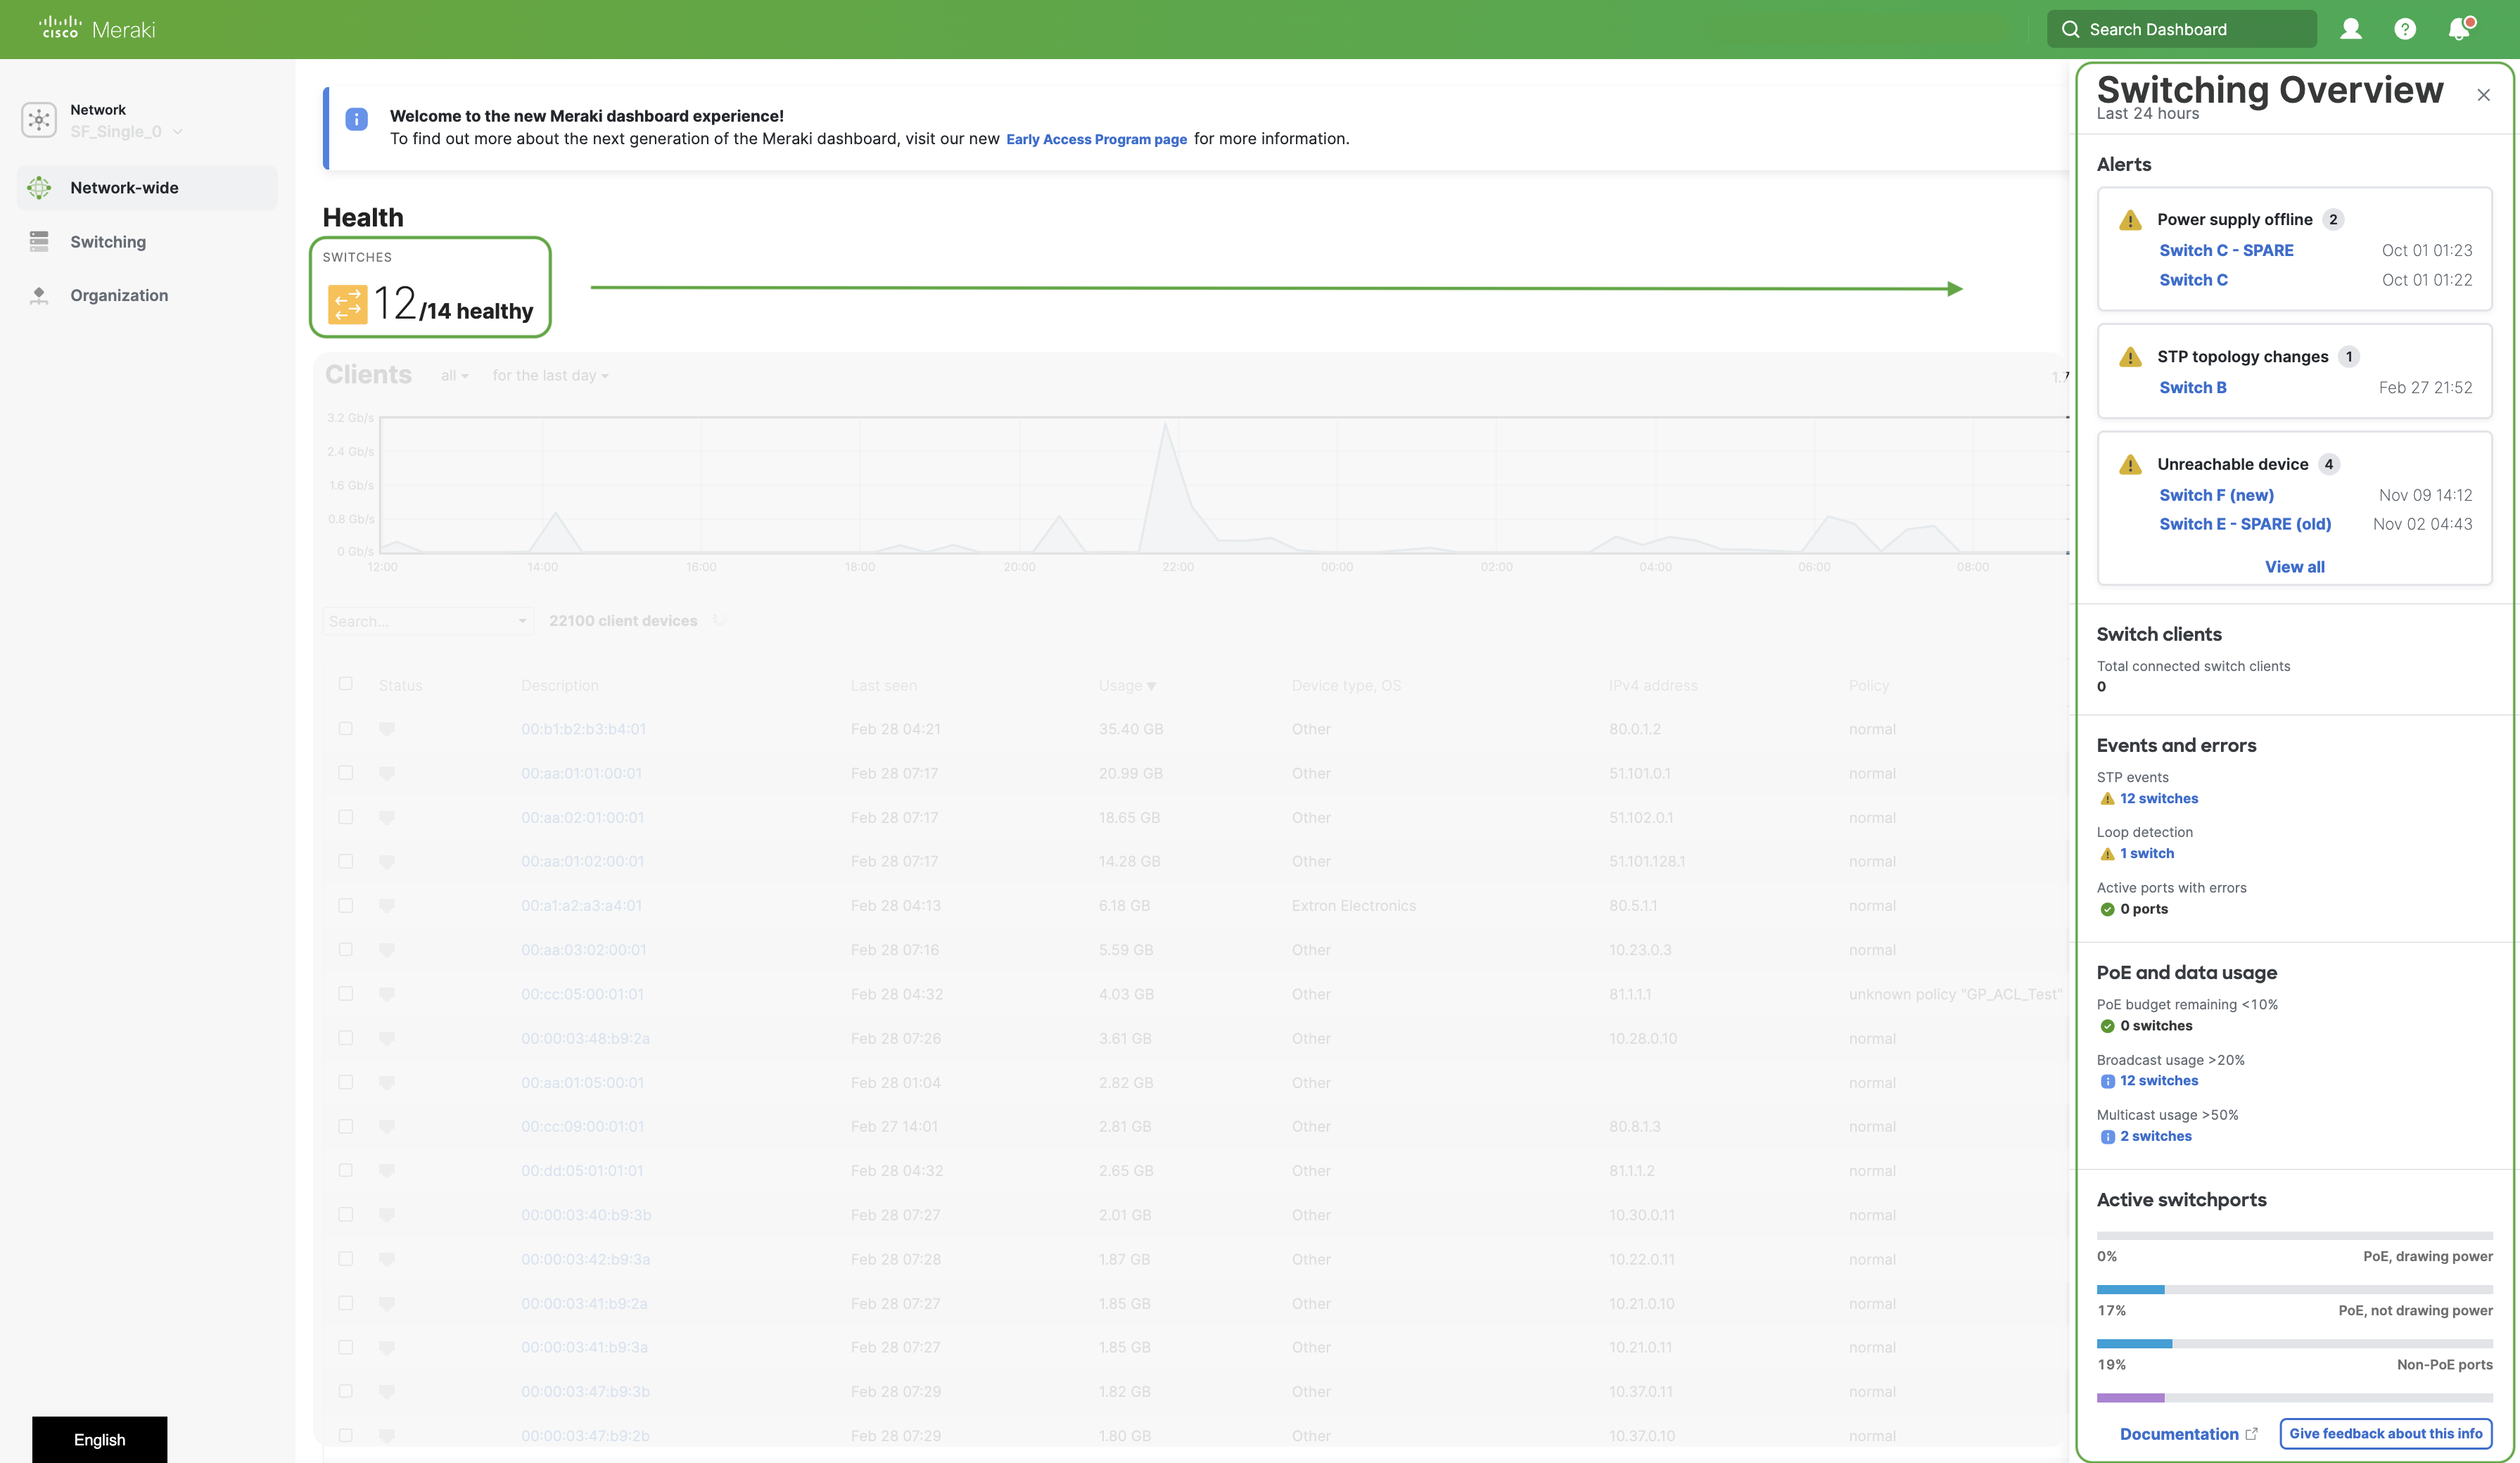
Note: Please allow a few seconds for the values for each of these metrics to populate in the switching overview panel.
Feature Availability
The feature will be available for opt-in via the Early Access program.
-
After careful evaluation of user feedback, this feature has been removed from the early access program in order to enhance the overall user experience.
-
Organizations that have already opted in will still have access to this feature and can choose to opt-out from the early access page if needed. Once opted out, the option to opt-in for this feature will no longer be available.
You can see the Switching Overview on the Network-wide -> Clients page by clicking on the Switch Health card.
Note: This feature is currently in beta and will eventually evolve over time incorporating the feedback we get from users during the public beta. Please share your feedback using the 'Give feedback about this info' option.
Switching Overview Metrics
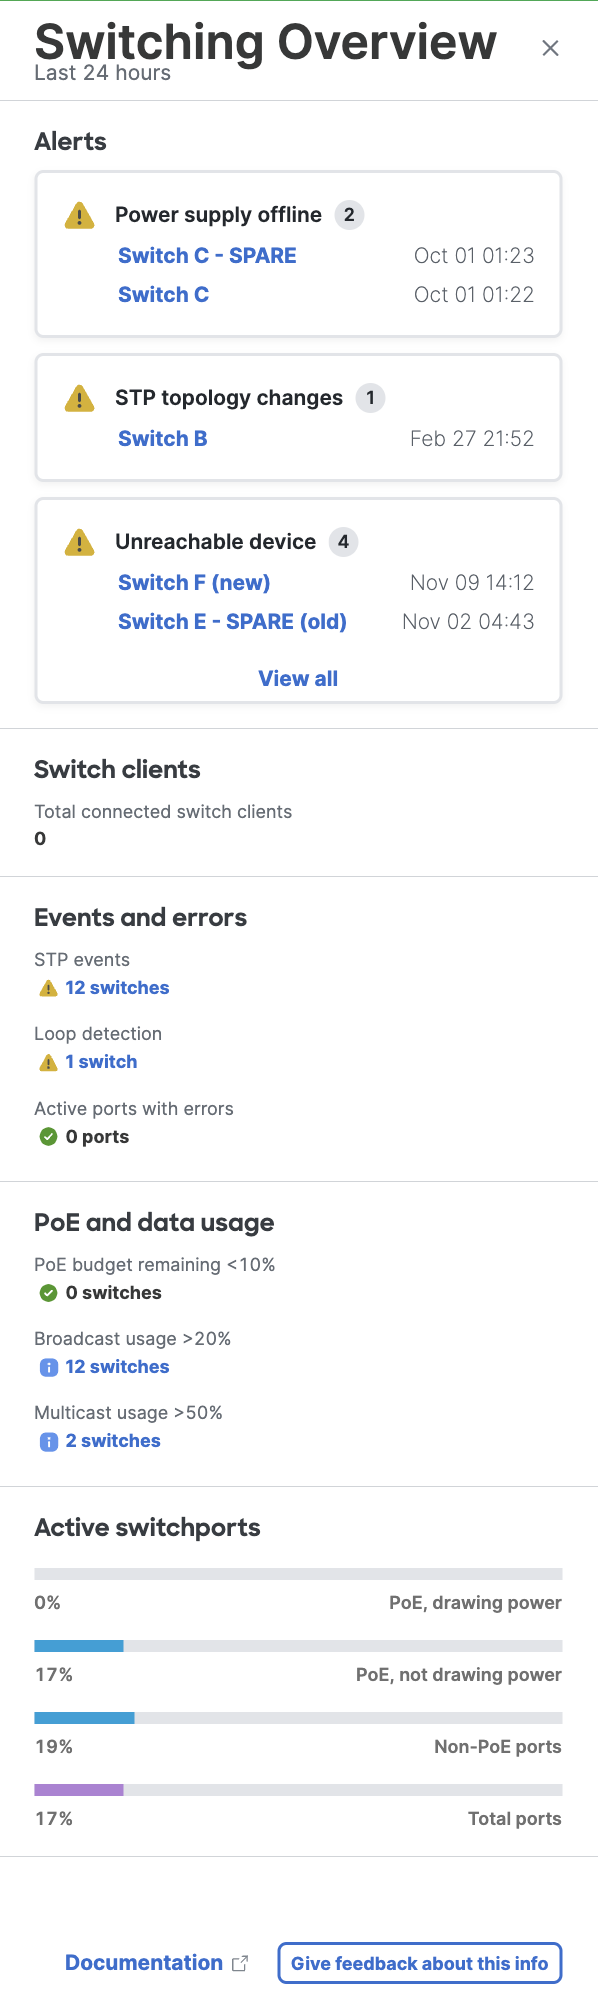
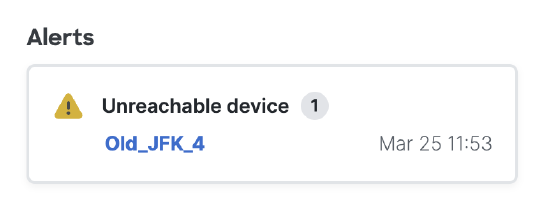
Alerts
This section will list all the switch-specific alerts at the network level which can be categorized as Device Health, Connectivity Issues, and Configuration Issues Alerts. This section has the same set of functionality as the Alert Hub at the network level, with the only difference being that this section is only listing Switch-specific alerts here.
Switch Clients
-
Total connected switch clients: This metric indicates how many clients are connected to switches directly and how many of them are online in a network.
Events and Errors
This section lists events and errors present in the switch network. To view details about events, users can click on the metric hyperlinks to be redirected to the respective events logs page filtering the respective switch and corresponding events. For port errors, users will be redirected to the switchports page filtering all the ports with an error.
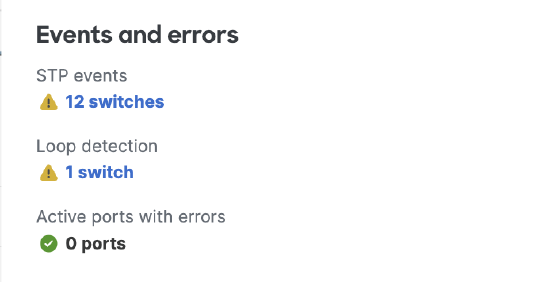
- STP Events: This metric indicates the total number of switches reporting one or more of the following event logs - STP BPDU delay monitor, STP root bridge elected, STP root status released, STP BPDU guard Activated, STP root guard activated, STP loop guard activated, STP BPDU sender conflict. To learn more about what these events mean refer to this documentation.
- Loop detection: Loop detection indicates the total number of switches with a loop detection event log. To learn more about what this event means refer to this documentation.
- Active ports with errors: The total number of ports in the switch network, that have one or more port errors such as CRC Error, VLAN Mismatch error, PoE denied etc.
Usage
This section lists metrics specific to PoE consumption and traffic usage across switches in the network. Users can click on the hyperlink for the metrics to be redirected to the Switch list page filtering respective switches and populating respective metric columns.
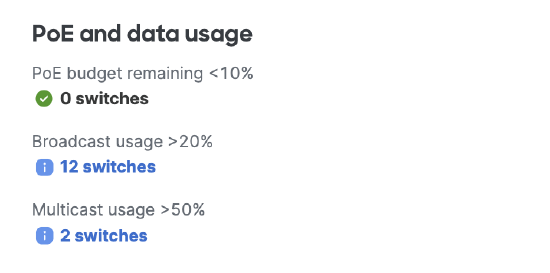
- PoE Budget Remaining < 10%: This provides a list of switches that are close to exhausting their PoE budget availability. Any switches in the network that have less than 10% of the PoE budget remaining will show up in this section. This metric could help users understand the needs and requirements of their switch network, perform better distribution of PoE devices across the network and also plan for future network expansion if need arises.
- Broadcast Usage > 20%: This metric is the total broadcast usage per switch and will list out all switches with a broadcast usage higher than 20%. This does not necessarily imply an issue in the network but provides insight into which switches in the network have greater than 20% broadcast traffic and if that is expected or not.
- Multicast Usage > 50%: This metric is the total multicast usage per switch and will list out all switches with a multicast usage higher than 50%. This does not necessarily imply an issue in the network but provides insight into which switches in the network have greater than 50% multicast traffic and if that is expected or not.
Note: As of today, the above thresholds are not customizable.
Active Switchports
This section of the Switching Overview provides a breakdown of active v/s inactive switchports percentage for the entire switch network based on the port type. The colored fill represents the active ports percentage whereas the greyed-out fill for the bar represents inactive ports percentage.
Users can hover over each of the bars to see the exact count of each of the active v/s inactive ports. Users can also click on each of the bars to be redirected to the Switch -> Switchports page which will provide a filtered view of the respective switchports.
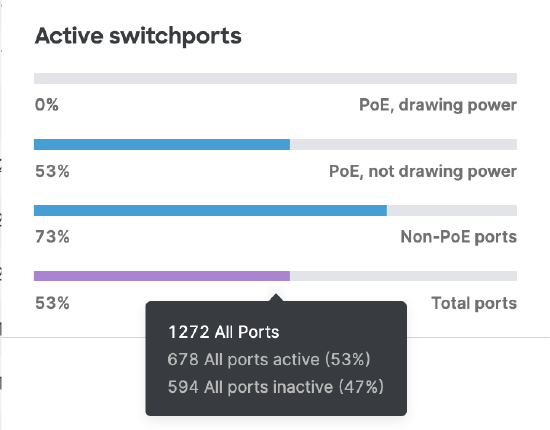
- PoE Ports (Drawing Power): Percentage of PoE ports that have clients connected to them and are drawing PoE from the switchport. This will include all types of PoE ports such as PoE, PoE+, UPoE etc.
- PoE Ports (Not Drawing Power): Percentage of PoE ports that have clients connected to them but are not drawing PoE from the switchport. This will include all types of PoE ports such as PoE, PoE+, UPoE etc.
- Non-PoE ports: Percentage of active v/s inactive switchports that are not PoE capable
- Total ports: Percentage of the total active v/s inactive switchports
Note: Please note that the Active switchports section accounts for all physical ports currently available in the switch network. It is an accurate representation of your existing network capacity and utilization.
In certain scenarios, the total switchport count reported in this section might vary from the total switchport count displayed on the switchports page. There could be two reasons for this:
- The network contains switches that are capable of multiple modular uplink port options (for instance the MS390s). The switchports page lists all port module options available, and hence it is also accounting for the modular ports that are not yet installed when calculating the total count.
- Certain ports are configured to be part of a link aggregation group. These ports on the switchport page show up as one entry.
Feedback Button
Users can share their feedback on the information provided in the Switching Overview panel by clicking on the "Give feedback about this info" button at the bottom of the panel.