Summary Report Overview
Summary Reports provide a variety of statistics relating to usage on wireless, switch, and security appliance networks. The Summary Report page can be found by navigating to Organization > Monitor > Summary Report. This article will provide an overview of what information is available and how to email or schedule recurring reports.
- Common report sections
- Product-specific report sections
- Emailing and scheduling reports
Learn more with these free online training courses on the Meraki Learning Hub:
Common Report Sections
Most Summary Report sections will be available for each network type (wireless, security appliance, and switch). The sections below will provide a brief explanation of the report from the perspective of a wireless-only network.
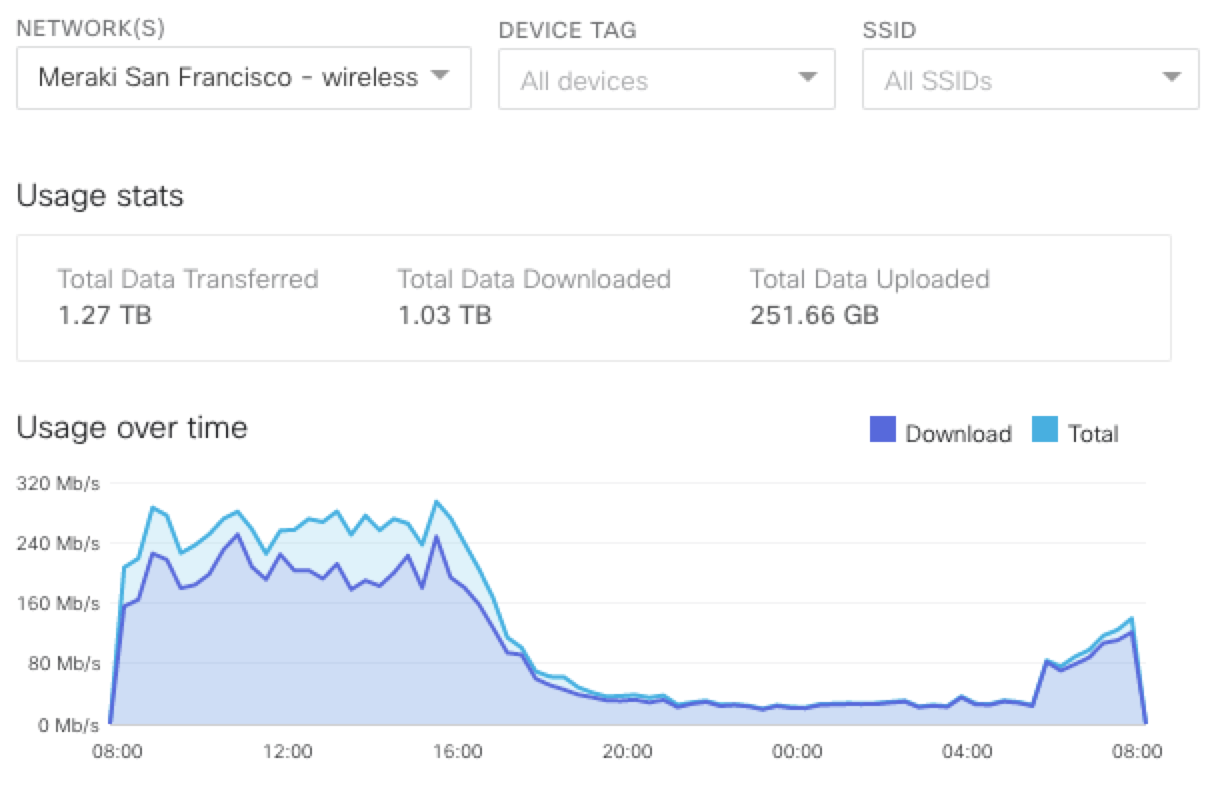
Usage
The Summary Report provides a high-level overview of total traffic across all devices on this network over the time period selected ("last week" in the example below). The quantities next to the section header indicate the total amount of data traffic in each direction (upload/download) over the course of the time period. The graph will show the average total network usage over time.
Note: As the graph represents average utilization, bursts of traffic at high speed will appear much lower if surrounded by low utilization. This graph is best used for analyzing overall trends, not determining peak volumes.
Note: The Summary Report page can only display the top 50 results.
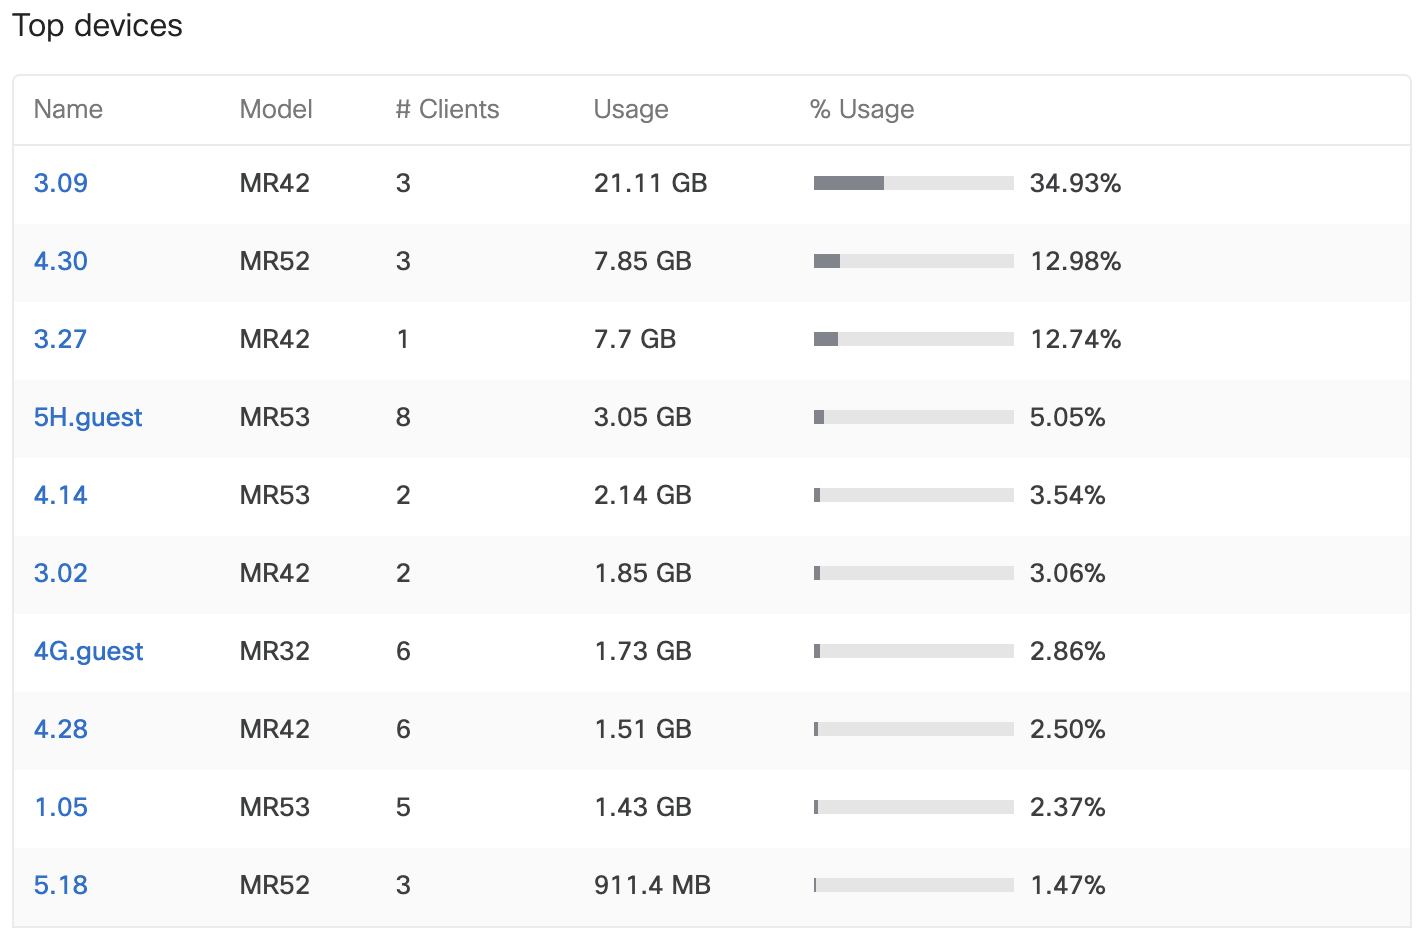
Top Devices by Usage
This section lists the top 10 Cisco Meraki devices in the network, ranked by total network usage, along with the total number of unique clients that used the device.
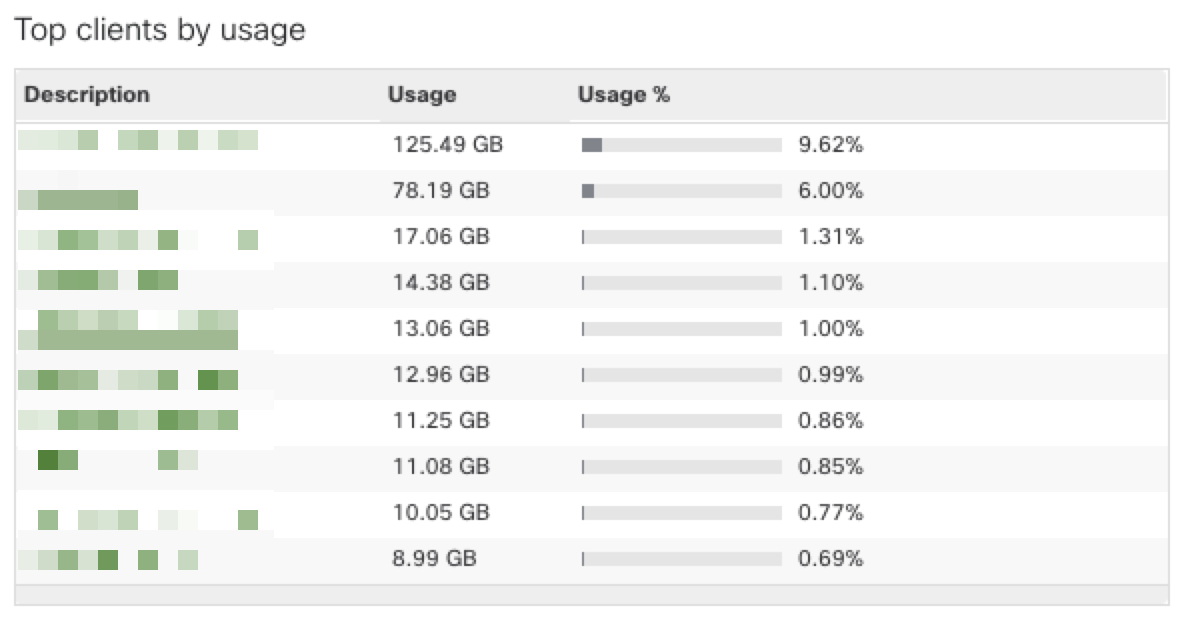
Top Clients by Usage
This section lists the top 10 clients on the network based on total usage (upload and download) during the time period. % Usage is the % of total usage on the network that was tied to the client. If individual clients are generating higher than desirable amounts of traffic, consider applying group policies to those clients in order to limit their usage. Alternatively, consider using global traffic shaping rules, on wireless or security appliance networks.
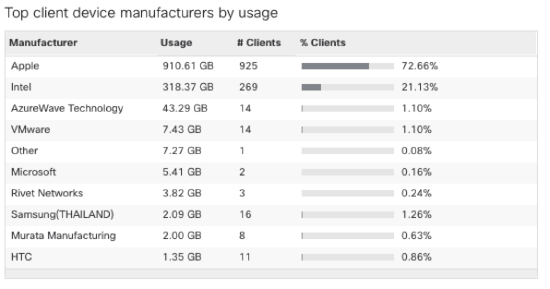
Top Client Device Manufacturers by Usage
This section lists the top 10 device manufacturers by total usage. In addition to aggregate information from the section above, it also provides a total number of clients with the indicated manufacturer.
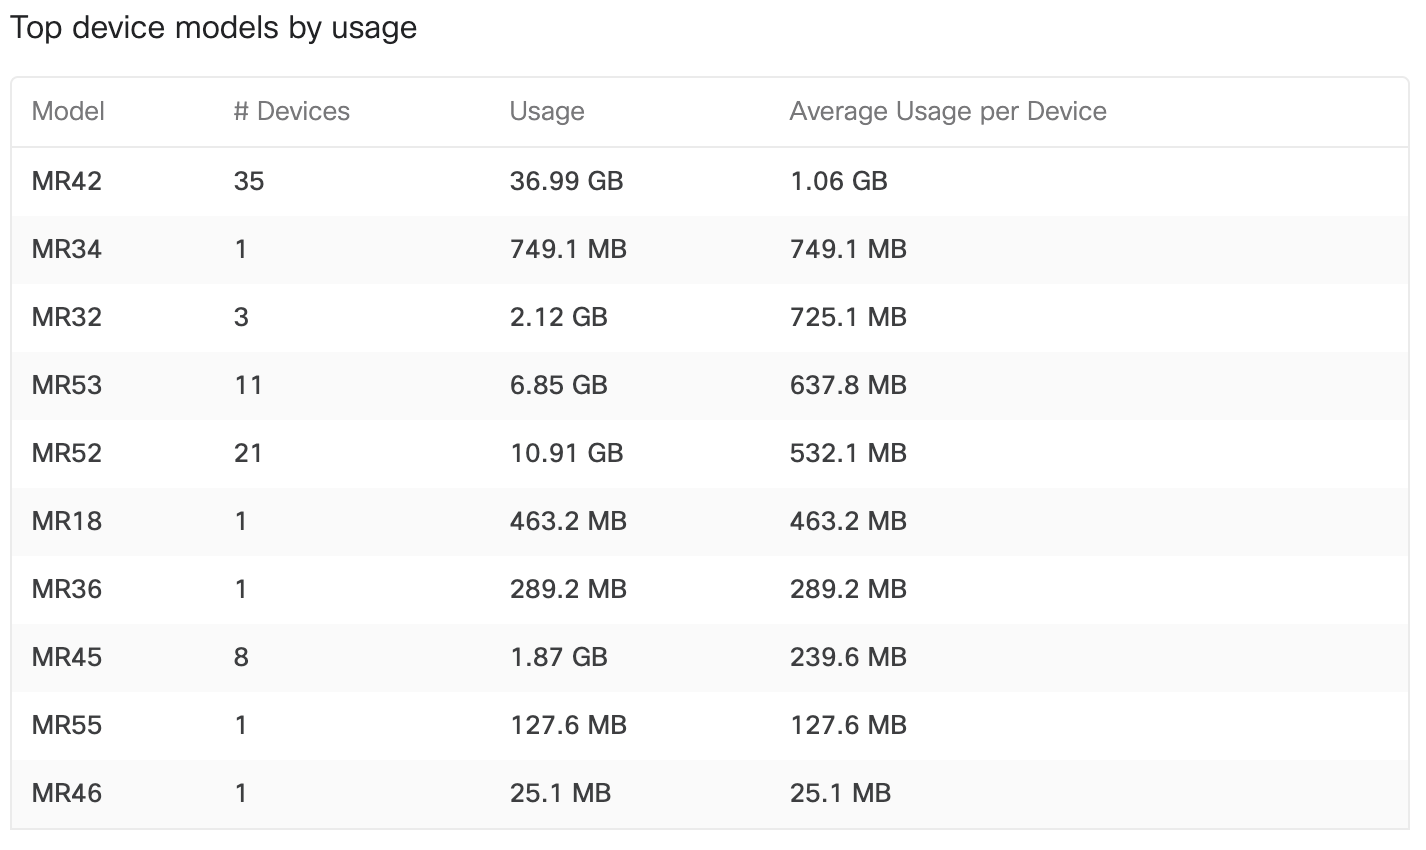
Top Device Models by Per-Device Usage
This section lists the top 10 Cisco Meraki device models in this network based on average usage (upload and download) per device.
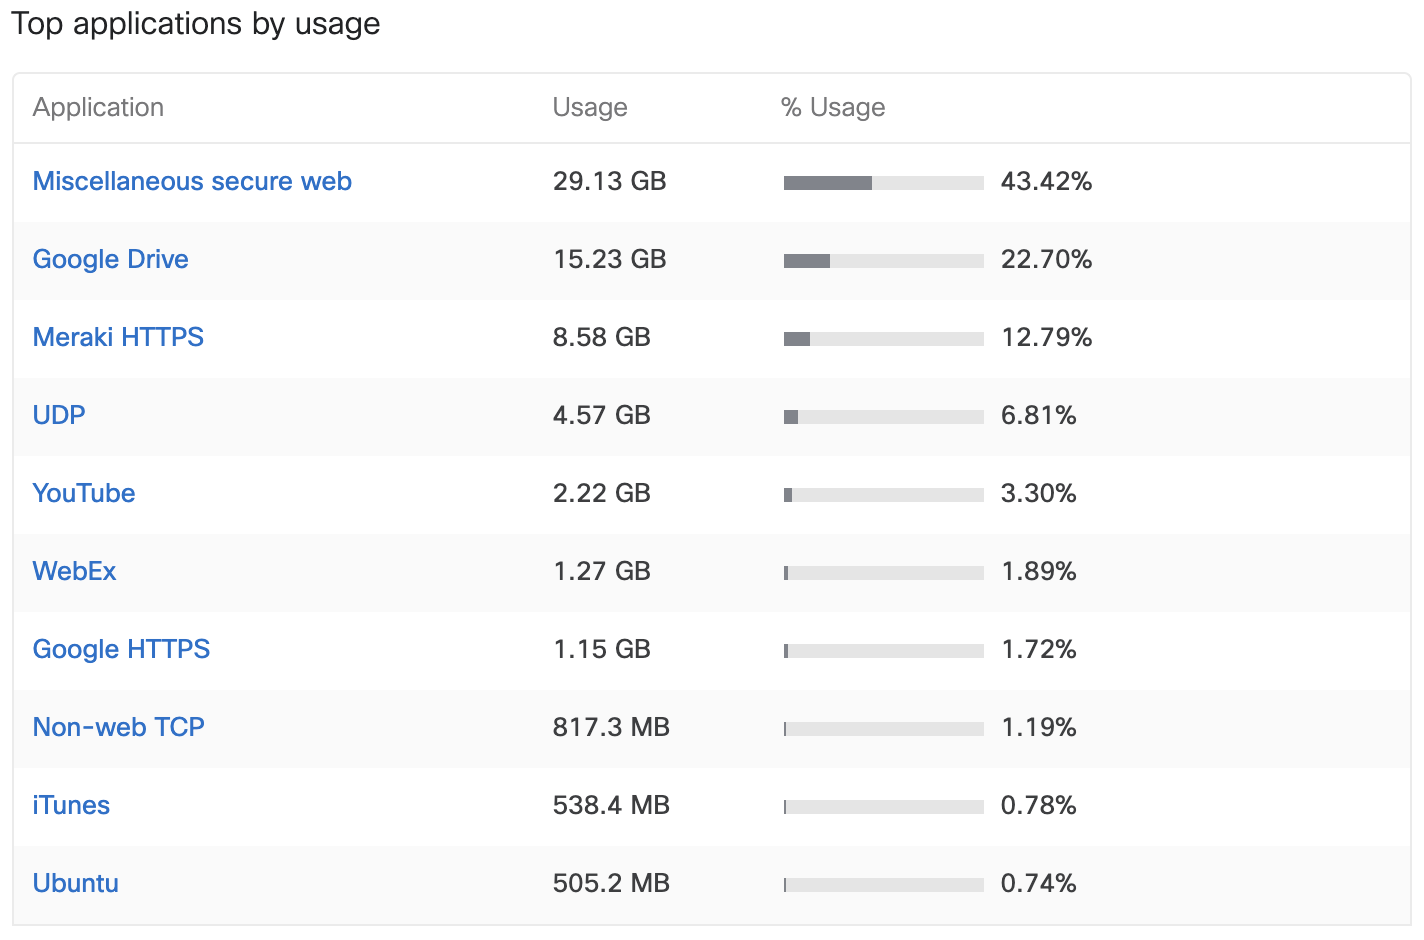
Top Applications by Usage
This section lists the top 10 applications on this network based on overall usage (upload and download). These applications should align with those used for traffic analytics. If undesirable applications are generating large amounts of traffic, utilize layer 7 firewall rules to block or restrict traffic.
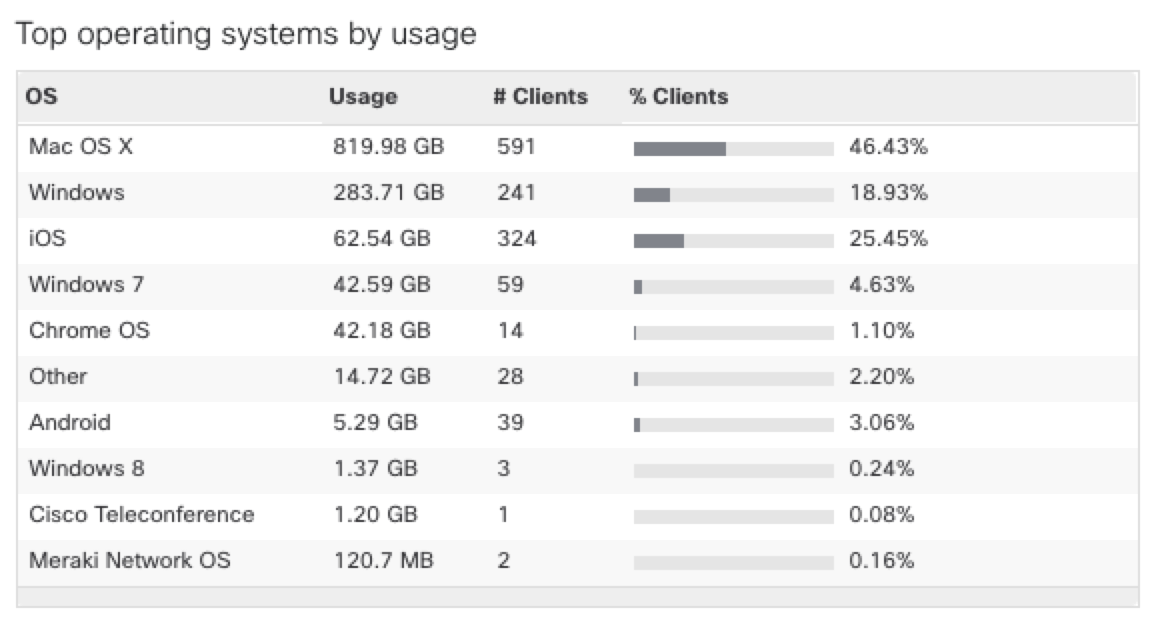
Top Operating Systems by Usage
This section lists the top 10 operating systems (OS) on the network based on overall usage (upload and download), along with the number of clients on the network using that OS.
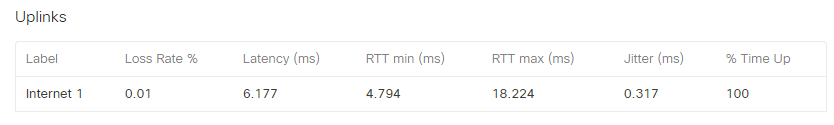
Uplinks
This section provides uplink statistics for the selected network. For networks configured with Warm spare MX, both primary and spare contribute to these statistics.
Note: The MX will use the configured default uplink statistic to gather this information. For more help on configuring the uplink statistic, refer to the SD-WAN and Traffic shaping document.
The columns listed are:
- Loss Rate %: Describes traffic that is expected, but is dropped somewhere between the source and destination.
- Latency: The processing and transit delay for network traffic.
- RTT min (ms): The minimum duration in milliseconds (ms) it takes for a network request to go from a starting point to a destination and back to the starting point.
- RTT max (ms): The maximum duration in milliseconds (ms) it takes for a network request to go from a starting point to a destination and back to the starting point.
- Jitter: The varied delay between received packets. For more help on jitter, refer to the What is Jitter? document.
- % Time Up: The uptime of the uplink while the MX is online.
Number of sessions over time
This section lists the number of wireless device sessions per day. A session is defined as a series of wireless probes from one device with no more than a five-minute gap between adjacent probes. Sessions from unassociated devices will be included, as well as sessions from devices associated to any SSID. Analytics must be enabled under Network-wide > General's Location and scanning section in order for a network to include this in the Summary Report.
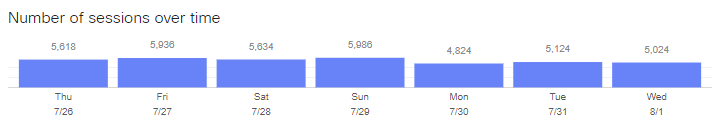
Note that Number of sessions over time only appears when looking at a report that spans multiple days, and only when the filter selection for SSID is All SSIDs. You may need to adjust your date range or SSID filter to view this information.
Product-Specific Report Sections
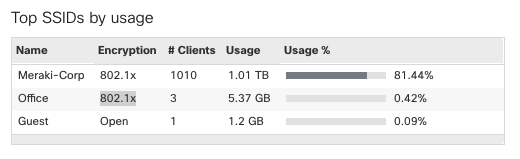
Wireless-Specific Sections
Wireless networks will also provide a section titled Top SSIDs by usage. This section will list the top 10 SSIDs configured on the network based on their overall usage (upload and download), and will provide the total number of unique clients that were seen on the SSID.
Switch Specific Sections
Port utilization
Switch networks will also provide a section titled Port utilization. This section will provide a summary of switch ports on the network and their maximum active speed during the time period. This can be used to see how the switch network is reaching port capacity and get an idea of typical device speeds.
Note: Active speed is the link speed between the client and switch, not the actual data usage on the port. Thus, a device may be connected at 1 Gbps but only have a few MB of usage.
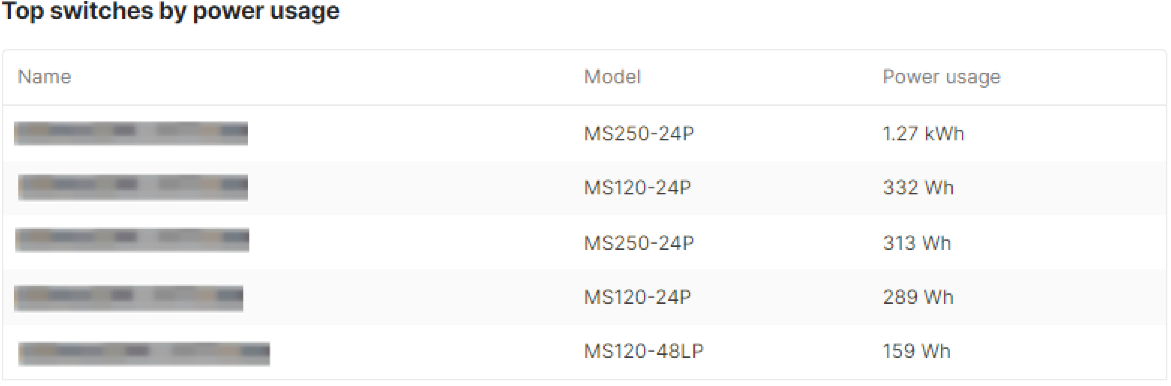
Ethernet Power Details
The ethernet power details section will provide a summary of the PoE usage for all devices connected to PoE Switches on the network during the specified time period. This can be used to see what the aggregate PoE usage in a network.
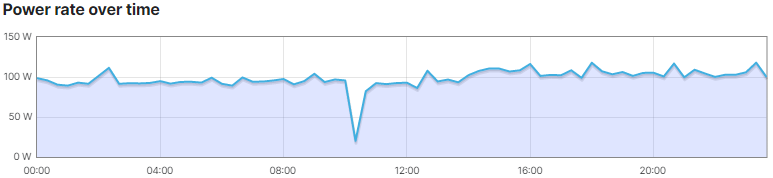
The top switches by power usage will display a list of all the PoE switches in a particular network and what their average power usage is per hour (calculated as either Watt hour (Wh) or Kilo Watt hour (kWh)).
Emailing and Scheduling Reports
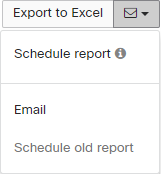
Besides viewing the summary report in dashboard, it is also possible to have the report emailed once or on a recurring basis. Look along the top-right of the Summary Report page for these options.
Emailing Reports
To email a one-time report:
- Select the Mail icon and choose Email.
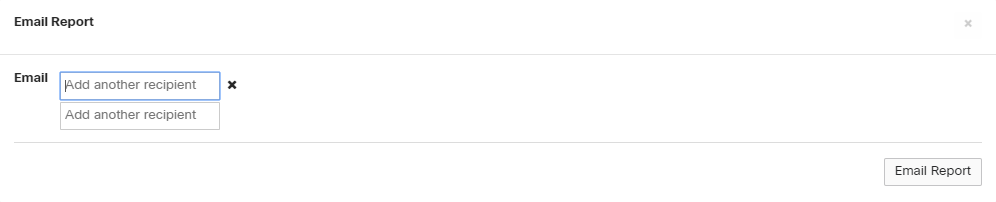
- Enter an email address.
- Select Email Report.
An email should be sent momentarily to the addresses provided, and will come from 'reports-mailer@meraki.com'
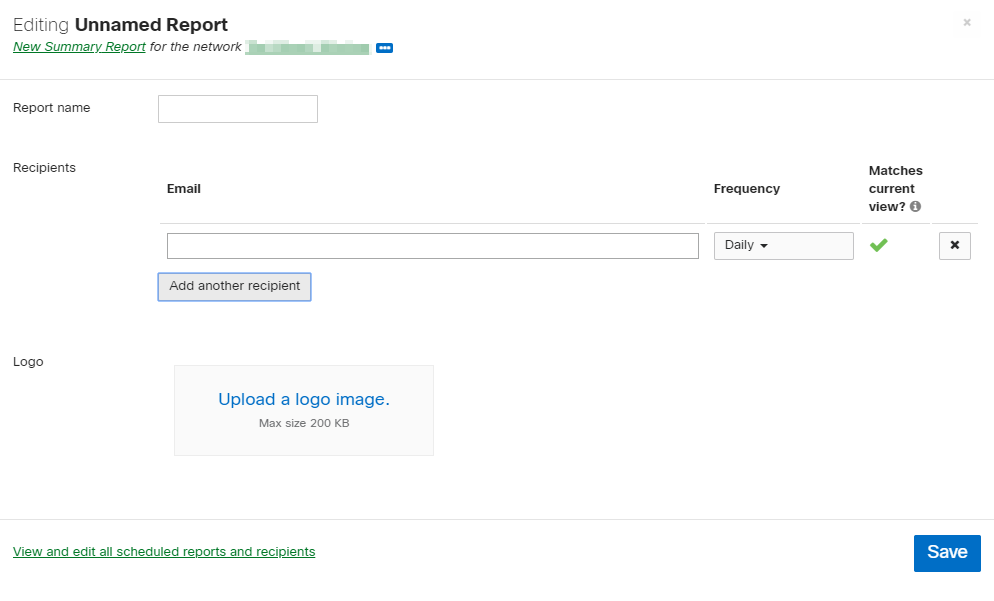
Scheduling Reports
Reports can also be scheduled to occur daily, weekly, or monthly. To schedule a report:
- Choose Schedule report.
- If a logo is desired, this can be added in the Logo section. This logo will be applied to all new and existing scheduled reports.
- Name the report in the Report name field.
- Add an email address in the Recipients section by interacting with Add another recipient.
- Choose the desired Frequency.
- Select Save.
To remove an existing scheduled report, select the X at the end of the row. Existing reports can be modified by changing the selections in the row. In both cases, choose Save to save the changes. To modify multiple scheduled email reports at once, select the View all scheduled reports and recipients link.
Note: Regardless of the day the report schedule is created, those with a Weekly frequency will be sent every Monday and those with a Monthly frequency will be sent on the first day of each month.