
Organization Overview
Using Meraki, it is possible to manage hundreds or even thousands of networks effectively. Under the Organization > Overview, you can see a list of all networks within an Organization along with their historical data from the last week. The Meraki Dashboard Organizational Structure article describes the hierarchy within every Dashboard Account.
Networks
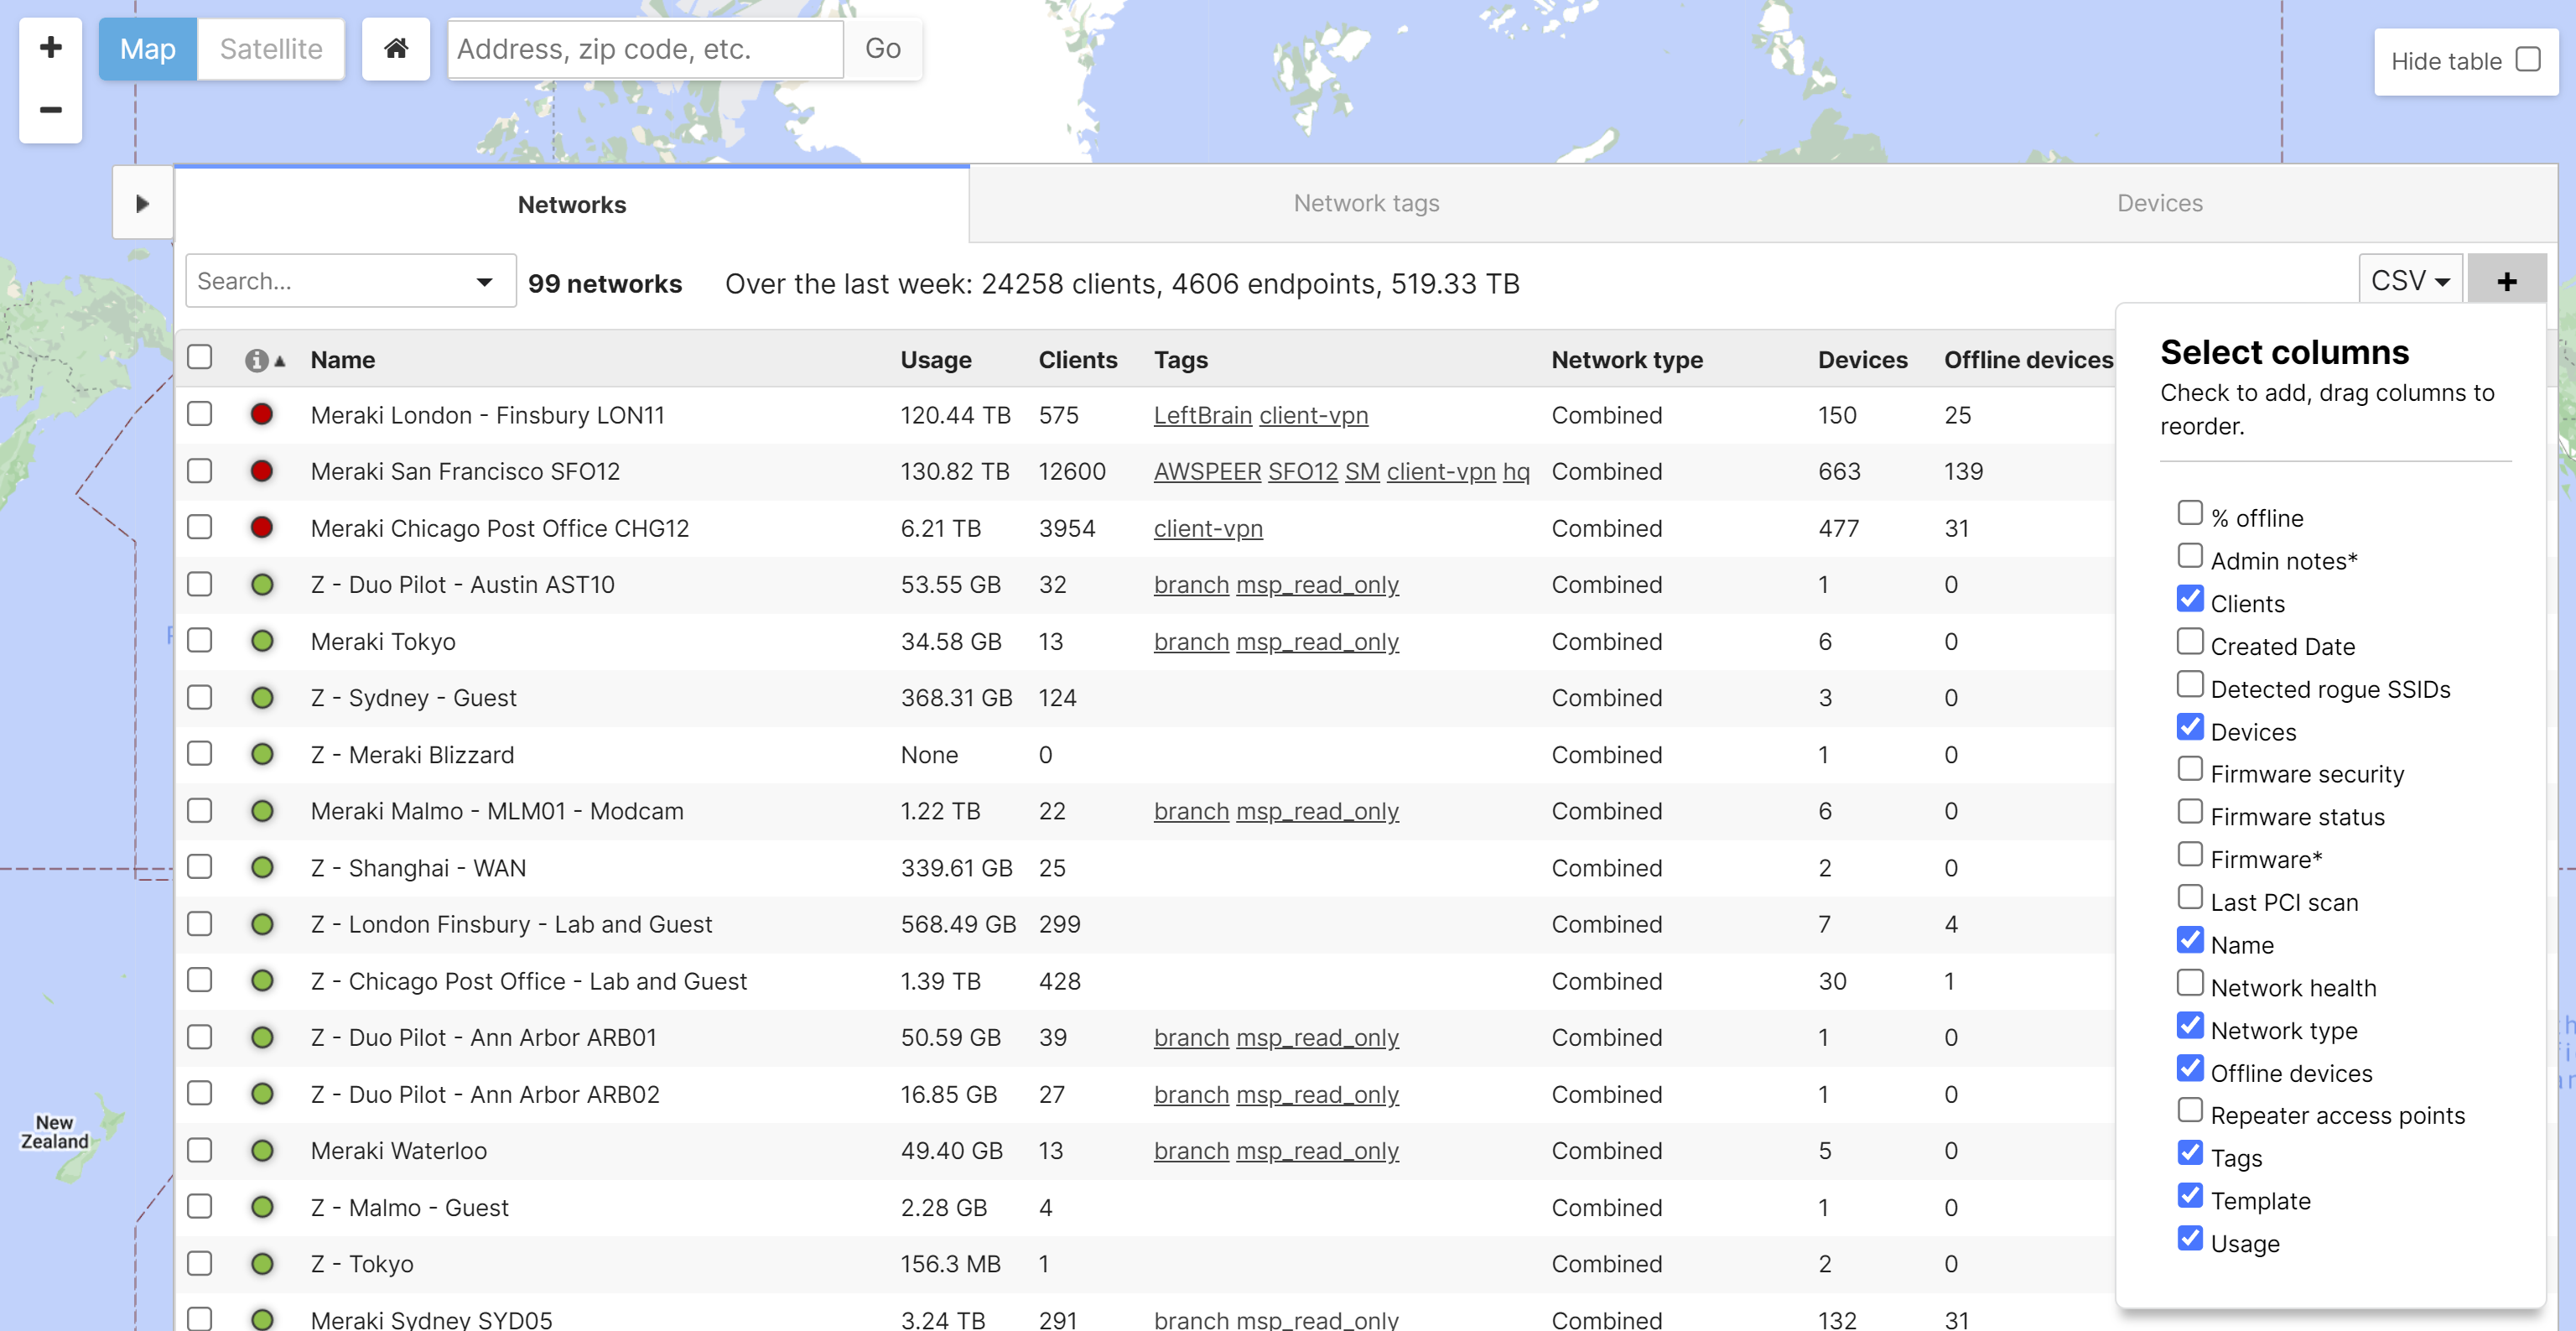
At a glance, the health of each Network can be assessed from the Organization Overview page. This view can be customized to display additional information about your list of networks by clicking the "+" button and selecting the data columns you wish to be visible. Each column is movable to best fit the administrator's workflow. The Meraki cloud provides a number of additional tools for monitoring a specific Network (Monitoring a Wireless Network).
The Created Date timestamp will be omitted for Combined networks as they potentially represent multiple network types (Security & SD-WAN, Switching, Wireless, etc).
Network Tags
Tags can be assigned to different networks on the network list, allowing for a hierarchical classification of networks. For example, if there are two networks, one can be tagged with 'Region A' and the other with 'Region B', with them both being tagged 'District A'. This then creates a tree structure that can be used to filter easily by different tags based on the hierarchy.
Tagging of networks is accomplished by selecting networks via the checkboxes on the left side of the Organization > Overview view and clicking the 'Tag' button in the same view. Tags can be added or removed from any network in this manner.
See the following example:
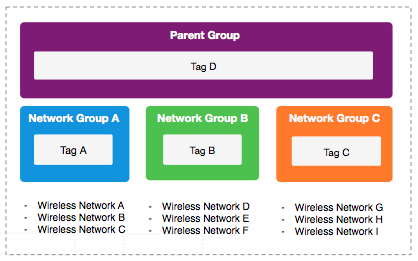
In the above example, 9 networks have been assigned with 4 tags; Tag D is present across all networks, whereas tags A, B and C are only present on 3 networks each. In this fashion, batches of networks can be created and searched for based on region, district, network authority, brand, or any other preferred tree structure.
Devices
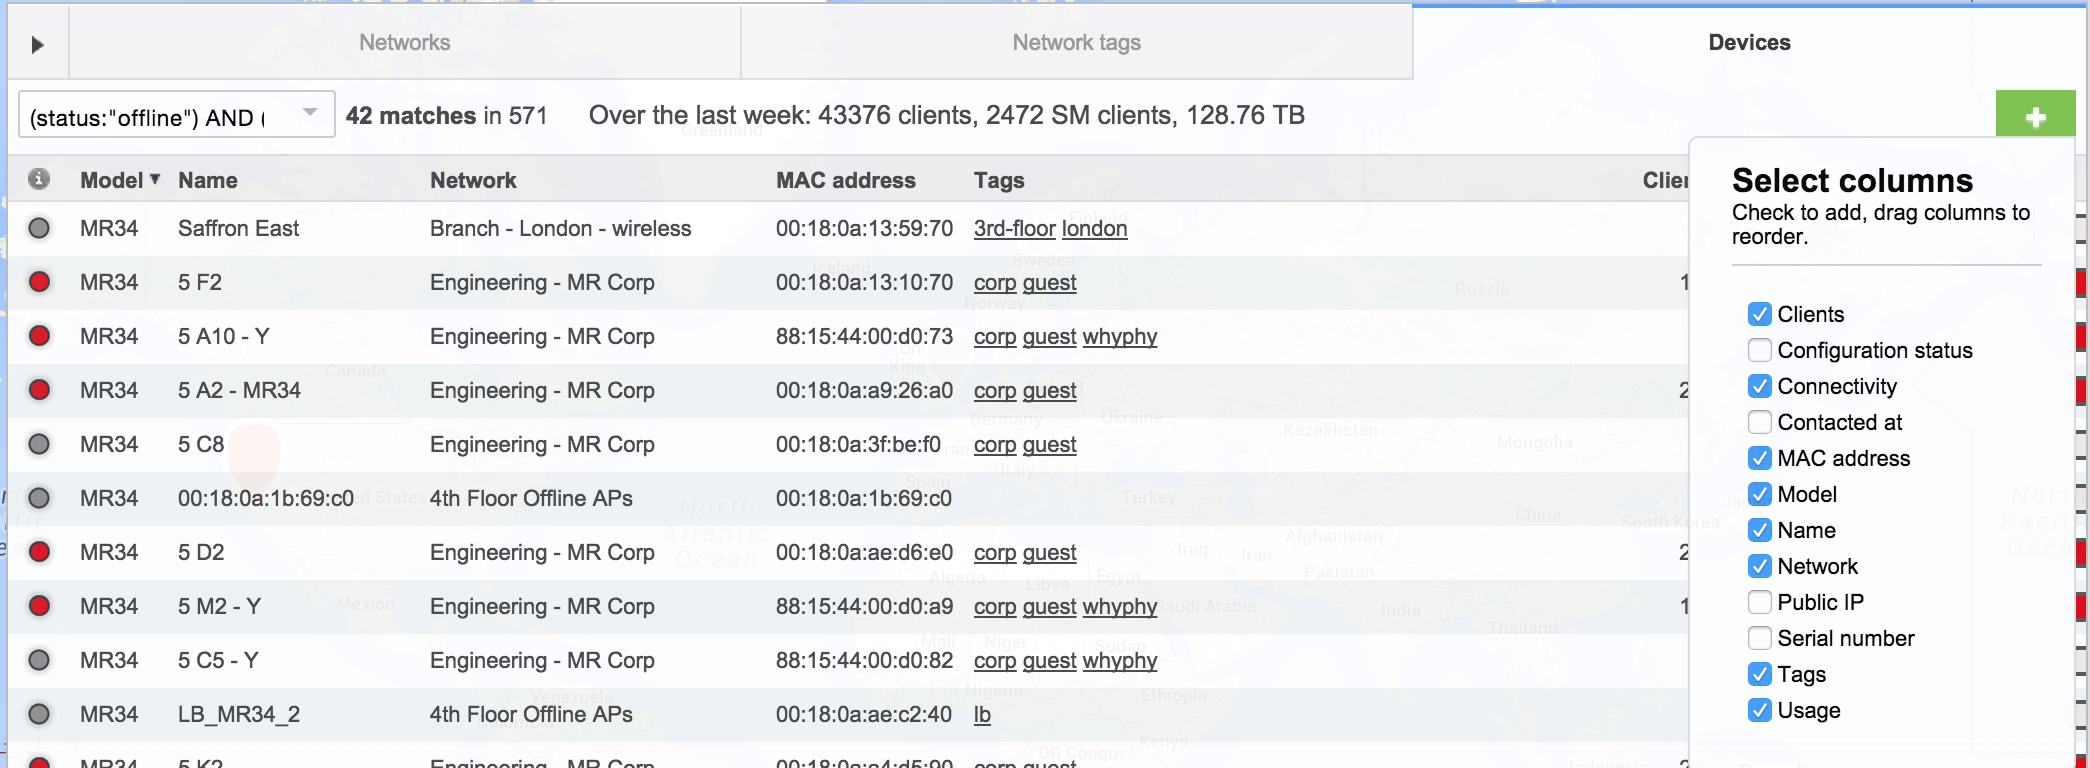
The status and health of every Meraki device is reported via the devices tab on the Organization Overview page. Using the search capabilities, an administrator is able to filter on a specific model, status, and description. In this view there are multiple columns which are also available to provide rich information about usage and status. Below is an example search that shows all of the offline MR34s and MR32s within the Meraki Corporate Organization.
SNMP Polling the Meraki Cloud
The Meraki Cloud may be polled to monitor all devices within a Dashboard Organization. SNMP Polling can be enabled on the Organization > Settings page. Detailed configuration instructions and a full list of the parameters are available the SNMP Overview and Configuration article. Finally, the MIB file with a list of available parameters is available for download on the Organization Settings page.
Monitoring Multiple Organizations
Large customers may have multiple organizations within their enterprise. The Meraki Cloud offers a high level view similar to the Organization Overview discussed above. Refer to the Managing and Monitoring Multiple Organizations article for more information.