Throughput test to the Cisco Meraki Dashboard
This article provides background on the live tool used for testing Dashboard throughput connectivity. This tool can be run from any Meraki device that is currently connected to the Cisco Meraki cloud. This live tool is designed to test the speed of communication between the device and Dashboard. It is not meant to accurately test the speed an Internet/WAN link is capable of.
Running a Throughput Test to Dashboard
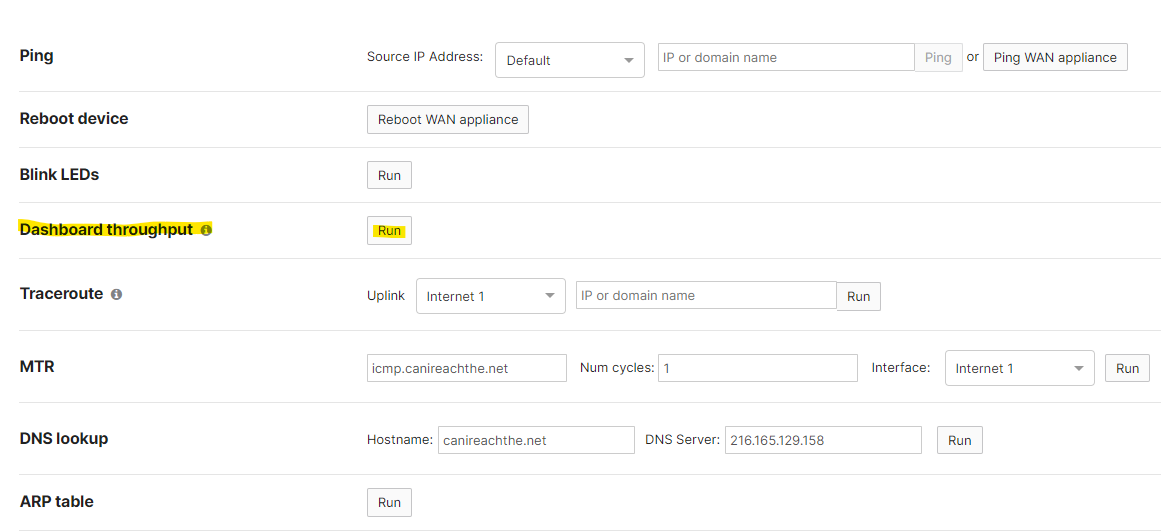
The Dashboard throughput test is one of the Live tools located on the details page for a particular device. The example below is an MX Security Appliance.

In order to leverage the full performance of a device, multiple sessions must be leveraged. This is best done by an endpoint or client, as the dashboard throughput tool creates a single session.
For MX/Z1 Appliances
Navigate to Security & SD-WAN > Monitor > Appliance status. Then navigate to Dashboard Throughput in the Live tools section of the page and click the Start button.
Results will be displayed after ten seconds and indicate the average speed to Dashboard during that time.
Dashboard throughput test will respect routing on MX/Z1 Appliances, therefore unidirectional or asymmetrical routing configuration can affect test results.

Dashboard throughput may be improved by ticking / unticking Site-to-Site VPN IPv4 default route. See Behavior of Management Traffic for more information.
For MS Switches
Navigate to Switching > Monitor > Switches and click the Name of a switch to test. Then navigate to Dashboard Throughput in the Live tools section of the page and click the Start button.
Dashboard throughput test may show slower speeds on the MS product range, compared to other Meraki products in the same network, due to how the MS performs the dashboard throughput test.
For MR Access Points
Navigate to Wireless > Monitor > Access Points and click the Name of an access point to test. Then navigate to Dashboard Throughput in the Live tools section of the page and click the Start button.
Factors Affecting the Dashboard Throughput Test
A number of factors can affect the result of the throughput test including:
- Bandwidth allotment from the ISP (limitations of the WAN connection)
- Upstream devices on the LAN
- Latency due to high traffic or network congestion
- Latency due to physical distance to reach Dashboard
- Traffic by other users traversing the WAN connection (VPN operations as well as general traffic)
- Operations affecting the processor speed of the device itself (content filtering, malware detection, and IDS)
- Load on Dashboard at the time
- Overhead resulting from packet encapsulation and framing
- Unidirectional or asymmetrical routing configuration
A throughput test result of 0 Mbps likely indicates that the node is unable to reach dashboard.meraki.com on port 7752. You can confirm this by taking a packet capture on the uplink interface of the Meraki device. An MX appliance will adhere to client routing and route priority for the throughput live tools. When taking packet captures on an MX, use the appropriate uplink interface:
- Internet if the traffic is being routed via the physical uplink
- Site-to-Site VPN if the default route is via Auto VPN)
Comparing to Similar Throughput Tests
The throughput test live tool available on Cisco Meraki devices in Dashboard is just designed to test data throughput to Dashboard. It is not meant to accurately test the speed an Internet/WAN link is capable of. The image below provides an example of two tests performed on a 300Mbps connection using an MX Security Appliance.

If it is necessary to test the actual throughput capacity of an Internet/WAN link, testing can be performed from a client on the LAN to other speed test services, such as SpeedOf.me or Speedtest.net. When doing these tests, the client should be as close to the Internet link as possible (such as directly connected to an MX LAN port) and other traffic on the link should be minimized (such as other client or VPN traffic). Testing from a wireless client when 50 other clients are also active on the LAN will not yield accurate results.

