- Open up Wireless Diagnostics using Searchlight (default shortcut CMD+Space)
|
 |
- With the application open, press option-cmd-3 to open the logs window
|

|
- Ensure both "Wi-Fi" and "System" are selected, then hit "Collect Logs." This step is critical. If collect logs is not pressed, you will not get the required log data.
- On macOS 10.13 (High Sierra) and higher, "System" has been replaced with an option for "EAPOL"
|
- Make a note of the current time, then reproduce the issue you are attempting to troubleshoot
|
- After reproducing the issue, open up a terminal and run the following command:
sudo sysdiagnose -f ~/Desktop/ -A filename. This will save the sysdiagnose output to the current user's desktop with the specified filename.
|
- Wait - the operation can take several minutes to complete, and you'll see "Completed All Phases. Wrapping up." in the terminal window when it's finishing. After a few moments, a new Finder window should open, containing the newly created Sysdiagnose archive.
|
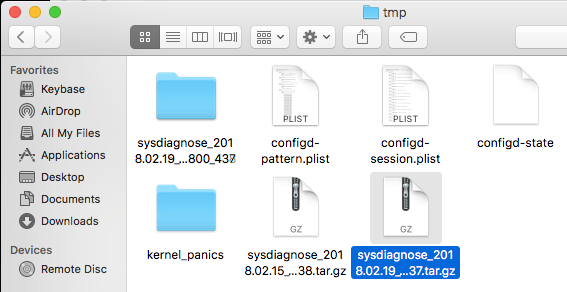 |
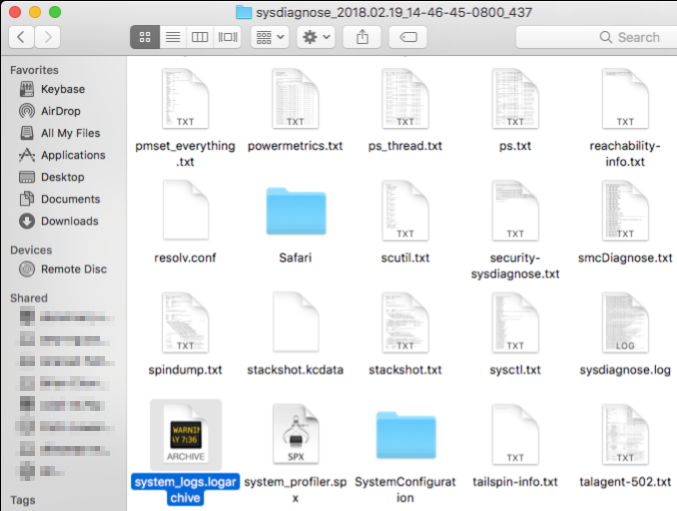
- Double click on the appropriate archive file to unzip it, then open the resultant directory, then locate, and copy out the file system_logs.logarchive - it is not necessary to grab any other output from this directory.
- Please also make an explicit note of which version of macOS the .logarchive file was captured on, as older versions of the OS cannot view files that are generated on newer ones!
- (NOTE: these files are large, so a service like Dropbox, Google Drive, etc. is recommended)
|
 |
- To view the relevant RADIUS details out of the .logarchive file, in the Console window that opens upon opening the file, go to the search field in the top right, and filter for "eapolclient"
|
 |
- The file may take several minutes to fully load, but eventually should start displaying the appropriate debug information. Note this with the previously given timestamps, and look for the appropriate EAPOL start messages to begin troubleshooting.
- The example in this screenshot tells us our test device is connecting to Meraki-Corp, using username/password-based auth. There is a lot more detail to it than just what this screenshot reveals, but the ending of a successful connection should usually result in a log noting "4-way handshake complete"
|
 |
- More filtering can be done on the PID level to limit output to only a specific exchange if you believe there are other events getting intermixed in the logging by right clicking on a message in the thread, and selecting 'Show PID XXXX'
- macOS 10.13 (High Sierra) also introduces the ability to filter by time ranges as well, which can help further reduce the amount of potential noise to wade through.
|
 |
