
Device Utilization
Overview
In order to perform crucial networking and security tasks, the MX Security Appliance must allocate resources to a large number of computational tasks. This is required for a wide range of packet processing functions, such as routing packets, performing deep packet inspection for identification and blocking of malicious traffic, and performing packet analysis for traffic classification.
Device Utilization is an important tool to answer short and long term troubleshooting and planning questions. Periods of very high sustained load may result in an overall delay in the MX's ability to perform key packet processing tasks. Subsequently, load monitoring can be an important tool when troubleshooting network performance issues. For long-term network planning, understanding the device's load over time can help to project and identify when a device upgrade may be required for growing sites.
MX Device Utilization
MX Device Utilization can be viewed in the dashboard in an organization with an MX by navigating to Organization > Summary report, and checking the Device utilization section. MX Device Utilization helps provide a better understanding of the device’s load over time and can be used to assess the utilization level and whether a higher end device or a load reduction is required.
If an MX device is consistently over 50% utilization during normal operation*, upgrading to a higher throughput model or reducing the per-device load through horizontal scaling should be considered. If the MX is only experiencing occasional spikes of utilization above 50% then it is unlikely that an upgrade or site-split is needed. The MX Device Utilization tool is available through an API or as a graph shown on the Summary Report page, the CPU component of the data shows the 50th percentile CPU usage i.e. the mean average for the period of time for which the table is rendered, which is in 20 minute intervals. If additional data is needed then please contact Meraki support who have access to more granular data to diagnose an over-utilized CPU.
* With all the desired features turned on, the expected number of clients connected, and the expected traffic mix traversing the device.
MX Device Utilization Calculation
The device utilization data reported to the Meraki dashboard is based on a load average measured over a period of one minute. The load value is returned in numeric values ranging from 1 through 100. A lower value indicates a lower load, and a higher value indicates a more intense workload. Currently, the device utilization value is calculated based upon the CPU utilization of the MX as well as its traffic load.
Due to load averaging, it’s possible for transient load spikes to occur without being visible in the utilization metric. For example, a device load that is consistently shown as less than 85% may still be experiencing transient load spikes. These transient load spikes may cause packets received in excess of the device’s forwarding capacity to be dropped.
MX Recommendation
- If MX is consistently over 85% utilization in dynamic routed deployments or consistently over 50% utilization in static pass-through/VPN concentrator deployments and the network requirements exceed the particular MX model limitations specified in our MX Sizing Guide, it is strongly recommended to consider upgrading to a higher MX model. For additional inquiries regarding the right MX model for your Organization, please contact your Cisco Meraki Sales Rep.
- If MX continues to operate over 85% utilization in dynamic routed deployments or consistently over 50% utilization in static pass-through/VPN concentrator deployments after upgrading the MX model, it is recommended to separate traffic between multiple MX devices. Design considerations may be to separate client VPN, AutoVPN, and traffic from different departments/floors into dedicated MX devices.
Recommendation 1 (Separate VPN from Internet-bound Traffic):
- Dedicate one MX device to handle Client VPN and AutoVPN traffic.
- Dedicate another MX device to handle Internet-bound traffic.
- Dedicate core MS devices to local Inter-VLAN traffic.

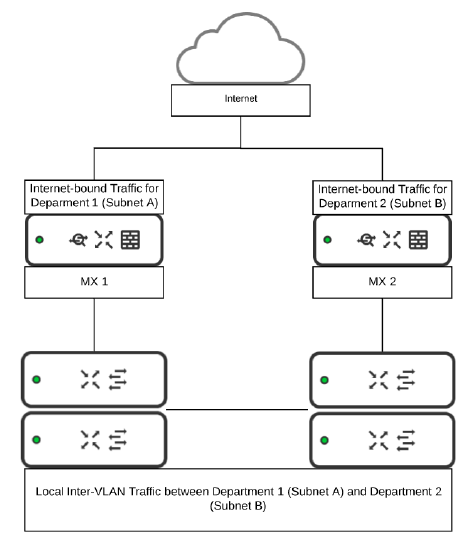
Recommendation 2 (Separate Internet-bound Traffic between Deparments/Floors):
- Dedicate individual MX devices to handle Internet-bound traffic for separate departments/floors. Each department/floor can be placed in different subnets. Example below only shows 2 separate departments/floors on 2 MX devices. However, additional MX devices can be added to further separate traffic.
- Dedicate core MS devices to handle local Inter-VLAN traffic.
Reading Device Utilization via API
Note: This feature is only available in MX 13.x firmware and newer versions.
MX device utilization can be retrieved using the API as well. The data reported to the dashboard and via the API are based on a load average taken every 60 seconds. The load value is returned in numeric value ranging from 1 through 100. A lower value indicates a lower load, where a higher value indicates a more intense workload. Currently, the load value is calculated based upon the CPU utilization of the MX and its traffic load.
Note: The Performance Score pulled through the API and the Device Utilization data on the dashboard are the same information, calculated every 60 seconds. However, when Performance Score API is used, it provides the average of the performance scores (calculated every 60 seconds) over the last one hour. For example, if the Performance API is queried at 21:00, it will provide the average of the performance scores from 20:00 onwards.
The API call for the "performance score" is as follows:
Return the performance score for a single device. Only primary MX devices supported. If no data is available, error code 204 is returned.
HTTP REQUEST
GET /devices/{serial}/appliance/performance
An example request and response is included below:
Request
curl -L -H 'X-Cisco-Meraki-API-Key: -----' -X GET -H'Content-Type: application/json'
'https://api.meraki.com/api/v1/devices/{serial}/appliance/performance'
Response
{"perfScore":19}
Example of results over time:
