
Large Campus Switching Best Practices
This guide provides information and guidance to help the network administrator deploy the Meraki Switch (MS) line in a Campus environment.
Campus networks typically adopt a tiered design, scaled according to the specific needs of the individual campus. These larger networks generally comprise WAN access, a core, an aggregation layer and an access/edge layer. This blueprint is used over and over again as it’s proven to be scalable to fit all use cases. An example outline of this template/blueprint can be found below.

Campus Design
This document will walk through the configuration of an ideal campus network design with Meraki hardware, using a theoretical, recommended environment.
The Aggregation Layer
The best networks have redundancy, so our recommended environment will leverage the stackable switches capable of running layer 3 features like the MS425 at the aggregation layer. This will allow the network to get 40 Gigabit connections to interconnect the two aggregation layer switches for physical redundancy as well as the resiliency of protocol failover in this setup. This way, the gateway remains up.
To begin, the MS425s should be online and connected to their gateway upstream. This will allow them to download any available firmware updates, in addition to grabbing any configuration changes made (before or after deployment). If the switches are online, the status LED should be solid white. If the LED is not turning white several minutes after being connected, the MS425 Series Installation Guide can be used to help troubleshoot. In the dashboard, the units should show a green status, meaning the the device is connected, has received the latest configuration, and is ready to go.
One the switches are online, the next step is to configure the dedicated QSFP+ stacking ports on the back of the switch to act as stacking ports. This can be configured across many switches in the dashboard via Switching > Monitor > Switch ports or for each individual switch, by clicking on the ports.
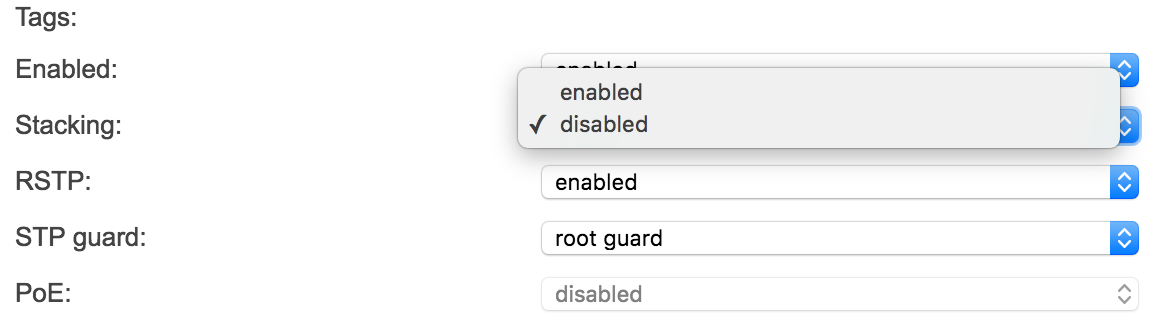
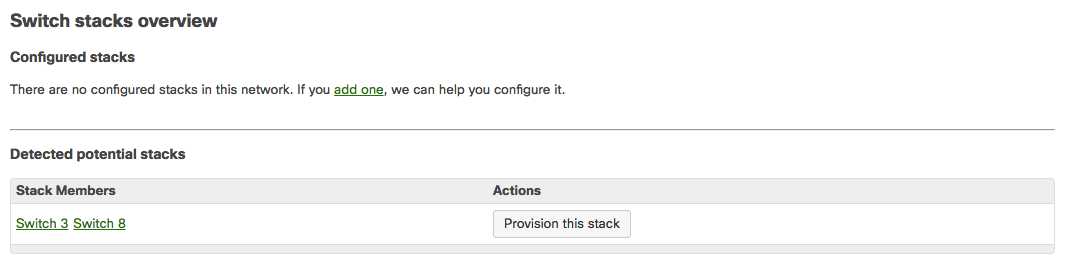
In the switch port configuration window, select stacking and save the configuration. This will push the change to the switches and the ports will be enabled for stacking. The next step is to configure the stack members in dashboard. This can be done on the Switching > Monitor > Switch stacks page in the dashboard. Switch stack members can either be selected from the Detected potential stacks section, or by selecting add one near the top of the page. Once the switches have been added to a stack in the dashboard, it will take about a minute for them to receive their configuration. Once the switches have received their stacking configuration from the dashboard, they will appear on the detected stacks list.
Name the stack and save changes to get the switches ready for adding interfaces and routes. The next step is to configure VLANs on a switch or stack basis under Switching > Configure > Routing & DHCP. From there, interfaces and static routes can be configured to keep traffic restricted. Click Add a static route or Add an interface and fill out the appropriate information, making sure to select the switch stack that was defined earlier.
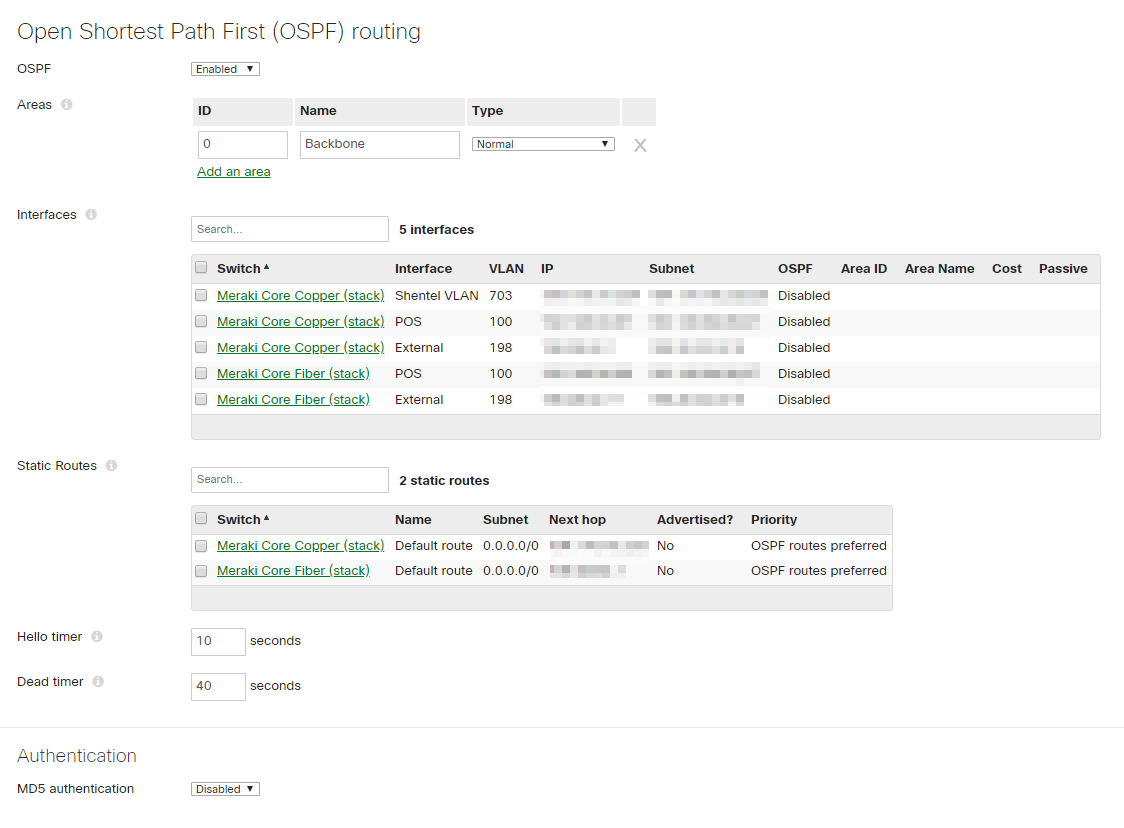
After this configuration has been completed, OSPF can also optionally be enabled. The need for this depends on the size of the campus, with larger environments generally being more likely to require a dynamic routing protocol among sites/locations. OSPF is enabled via Switching > Configure > OSPF routing, and enabling it will provide failover capabilities for redundant internet paths as well as connections between buildings. If choosing to use OSPF, enable it, advertise the appropriate interfaces and set the Hello and Dead timers to the desired values. It is generally bast practice to start with low timer values of 1 (Hello) and 3 (Dead), but your network may require higher values if there is a great deal of delay or distance between your devices.
This configuration will provide a foundation for the campus architecture at the aggregation layer. The next part to configure for the campus architecture is the Access Layer.
The Access Layer
Once the aggregation layer has been configured, a campus network architecture will require a way to connect end-users and clients to the network. It is generally recommended best practice to introduce physical stacking into the access or edge of the network. Physical stacking will provide a high-performance and redundant access layer to minimize any type of failure that might occur, while giving the network ample bandwidth for an enterprise deployment. The MS350 is an ideal example of an access layer switch that has been engineered for this purpose with fully redundant power supplies and fans, plus the ability to stack up to eight switches, providing up to 384 ports in a single stack. Stacked access layer switches like the MS350 should provide ample connectivity for a network closet to accommodate a floor or a wing of a floor, and coupled with 160 Gbps stack bandwidth, multiple uplinks can be used with cross-stack link aggregation to achieve more throughput to aggregation or core layers. High bandwidth uplinks through access-layer port stacking will allow integration with the stacked aggregation layer MS425s that were setup earlier to provide redundancy from access to core, minimizing any sort of failures that might occur.
Before configuring a switch stack, every switch should be added to the same dashboard network and individually brought online with separate, individual uplinks. This ensures that the switches are up-to-date with the latest (and same) firmware versions, and helps ensure the entire stack will come online.
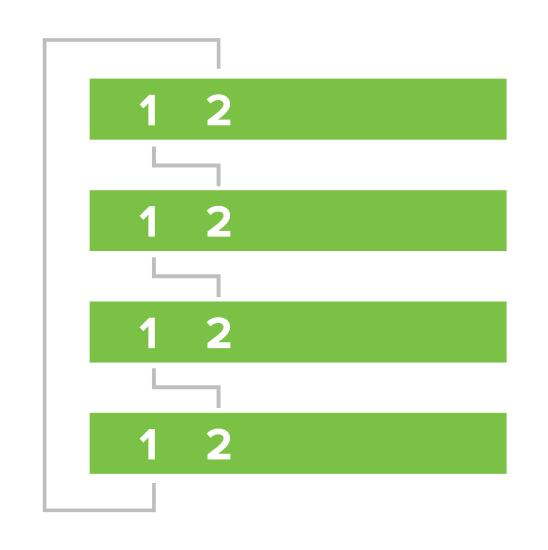
To begin setting up stacking, the first step is to connect the stack links. Make sure the switches are powered down for this. As best practice, stacking should be set up in a full ring topology by connecting stack port "one" of one switch to stack port "two" of the next switch, continuing this pattern the whole way through the stack, and finishing with the bottom switch connecting to the top switch to complete the ring.
Once the stack has been cabled correctly, the stack should be brought online with a single uplink for the entire stack. This will allow the switches to connect to the Meraki cloud and configure everything or sync with the configuration that was set up ahead of time. Once the switches comes online from their single uplink, the Meraki cloud will automatically detect the stack if it’s not already configured and will ask to provision or name the stack:
Once the stack has been named and configured, clients can be connected and link aggregation can be configured for an uplink back to the aggregation layer or core. Enterprise Meraki switches are able to use Link Aggregation Control Protocol (LACP) to bundle up to eight links. It is best practice to make sure to accommodate for additional bandwidth by using at least two links for the uplink in any stack.
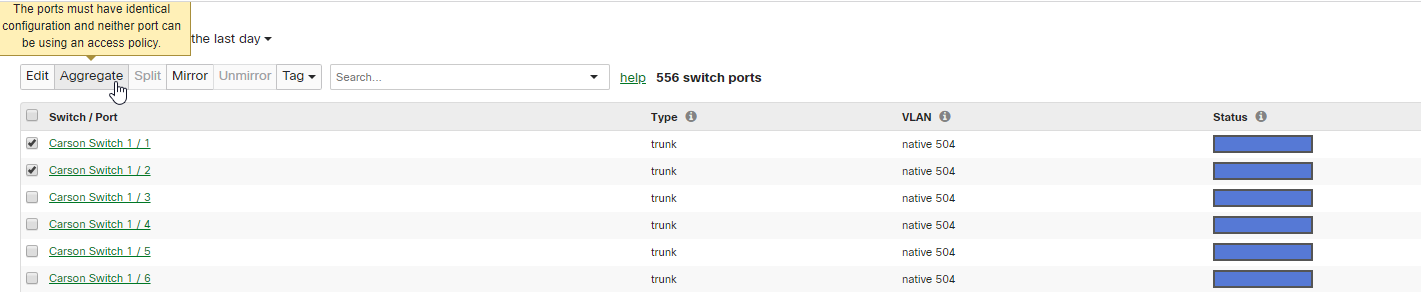
When selecting ports for an aggregated stack uplink, it is best to space the links out so there are minimal hops across the stack for traffic to get to an uplink. In a stack with four switches, this would mean that switch 1 and switch 3 have uplinks. In a stack with eight switches and two uplink cables, this would mean that switch 1 and switch 4 have uplinks. This "maximum spacing" method will provide optimal coverage, during normal operation and in failures. This should help avoid having traffic unnecessarily traverse the whole stack to get to an uplink. Link aggregation is simple to configure using the dashboard, as all ports for all switches can be viewed from a single page. Simply select the ports to be in the link aggregate and click the Aggregate button in dashboard.
For even higher-capacity needs, the Meraki MS355 switch family has a multigigabit ethernet model that pairs with the Meraki multigigabit MR access points to provide single-cable speeds greater than a gigabit. This allows a campus to have the stacking redundancy as well as greater throughput for end clients should it be needed.
Topology
We highly recommend having the total switch count in any dashboard network to be less than or equal to 400 switches. If switch count exceeds 400 switches, it is likely to slow down the loading of the network topology/ switch ports page or result in display of inconsistent output.
QoS Considerations in the Campus
In any campus deployment, traffic prioritization is key to keeping critical network applications running, even under heavy load. This is done through the use of Quality of Service (QoS) configuration. The simplest explanation of QoS is the prioritization of traffic, ensuring that important or latency-sensitive traffic will get bandwidth before less demanding traffic. To read the guide for QoS on Meraki refer to our MS QoS documentation.
The table below lists the commonly used DSCP values as described by RFC 2475. To keep things standardized it’s recommended to utilize these values, unless the deployment already uses a different set of values.
|
DSCP VALUE |
DECIMAL |
VALUE MEANING |
DROP PROBABILITY |
EQUIVALENT IP PRECEDENCE VALUE |
|
101 110 |
46 |
High Priority Expedited Forwarding (EF) |
N/A |
101 - Critical |
|
000 000 |
0 |
Best Effort |
N/A |
000 - Routine |
|
001 010 |
10 |
AF11 |
Low |
001 - Priority |
|
001 100 |
12 |
AF12 |
Medium |
001 - Priority |
|
001 110 |
14 |
AF13 |
High |
001 - Priority |
|
010 010 |
18 |
AF21 |
Low |
001 - Immediate |
|
010 100 |
20 |
AF22 |
Medium |
001 - Immediate |
|
010 110 |
22 |
AF23 |
High |
001 - Immediate |
|
011 010 |
26 |
AF31 |
Low |
011 - Flash |
|
011 100 |
28 |
AF32 |
Medium |
011 - Flash |
|
011 110 |
30 |
AF33 |
High |
011 - Flash |
|
100 010 |
34 |
AF41 |
Low |
100 - Flash Override |
|
100 100 |
36 |
AF42 |
Medium |
100 - Flash Override |
|
100 110 |
38 |
AF43 |
High |
100 - Flash Override |
|
001 000 |
8 |
CS1 |
- |
1 |
|
010 000 |
16 |
CS2 |
- |
2 |
|
011 000 |
24 |
CS3 |
- |
3 |
|
100 000 |
32 |
CS4 |
- |
4 |
|
101 000 |
40 |
CS5 |
- |
5 |
|
110 000 |
48 |
CS6 |
- |
6 |
|
111 000 |
56 |
CS7 |
- |
7 |
|
000 000 |
0 |
Default |
- |
- |
|
101 110 |
46 |
EF |
- |
- |
To help with the reasoning behind the above chart, here’s the IP precedence priority from lowest to highest as per the RFC 791.
|
DSCP VALUE |
DESCRIPTION |
|
000 (0) |
Routine or Best Effort |
|
001 (1) |
Priority |
|
010 (2) |
Immediate |
|
011 (3) |
Flash - Mainly used for Voice Signaling for for Video |
|
100 (4) |
Flash Override |
|
101 (5) |
Critical - mainly used for Voice RTP |
|
110 (6) |
Internet |
|
111 (7) |
Network |
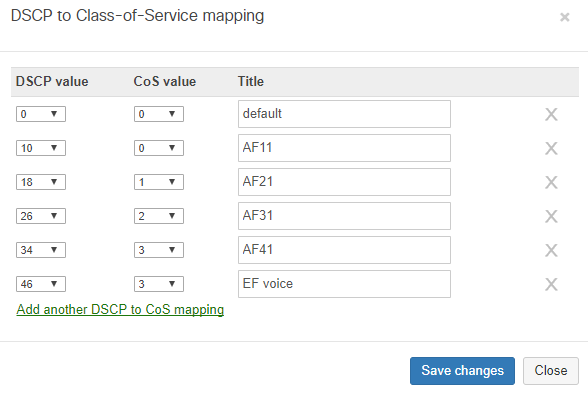
We’ll want to mirror the rest of the network deployment on the access switches so that QoS is the same across the network, so match default Cisco settings we’ll be setting the following:
|
CoS Value |
0 |
1 |
2 |
3 |
4 |
5 |
6 |
7 |
|
DSCP Value |
0 |
8 |
16 |
24 |
32 |
40 |
48 |
56 |
|
DSCP Values |
0 |
8, 10 |
16, 18 |
24, 26 |
32, 34 |
40, 46 |
48 |
56 |
|
CoS Values |
0 |
1 |
2 |
3 |
4 |
5 |
6 |
7 |
You’ll configure these under Switching > Configure > Switch settings and define the QoS through the user interface:
Security Settings
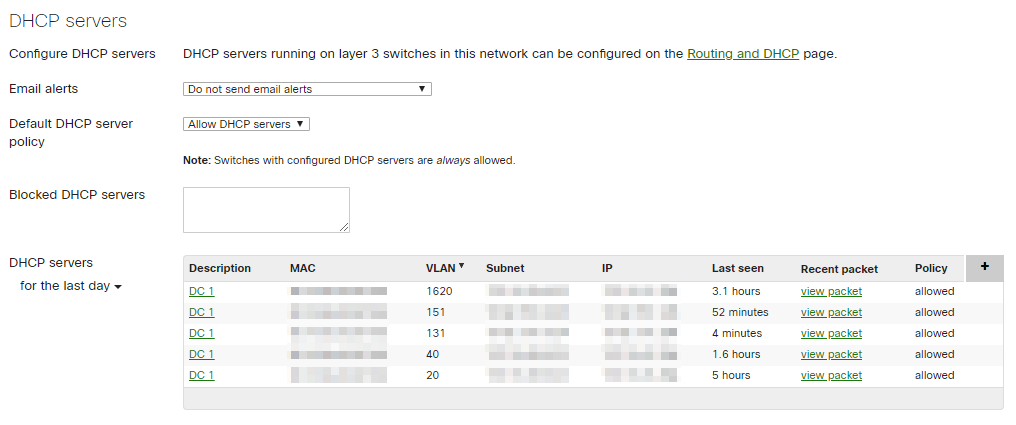
With QoS out of the way and traffic prioritized correctly, any network admin who wants to make sure they have the most control of their network will want to implement security settings. To achieve this, we can use the DHCP server detection mechanism and set it to automatically block new DHCP servers on the network. This will allow the network to remain resilient against people trying to reroute hosts and people who’ve accidentally plugged in something that they should not. This enables us to then allow the servers that should be handing out DHCP addresses to keep the network up and operational.
Another important area of campus deployment security is authentication. Most security-minded deployments will have a RADIUS server to authenticate clients within the network. The Meraki switch line can integrate with a RADIUS server to provide authentication via 802.1x or MAC Authentication Bypass (MAB) on any switch port. This allows control over who connects and the resources accessible to them. With the MS switch line, either is allowed. Alternatively, a deployment could also use a hybrid mode which will first attempt 802.1x and fall back to MAB before choosing to not allow the client access or move them into a guest or remediation VLAN. It is highly recommended to set up a remediation VLAN to isolate unauthorized, guest or non-compliant devices.
In addition to the authentication methods mentioned above, Meraki also includes a RADIUS server monitoring mechanism within the switch line to enable use of Hybrid Auth, whereby if the RADIUS server is offline, clients will be bounced for re-authentication when the server is available again. This allows a re-prompt login for clients so that they can get network resources when authentication is available, without manual intervention. Use of this particular feature is up to the design of the network, but is extremely useful if the network utilizes a data center or cloud hosted radius server that might become unreachable.
As with any of the above security considerations, no network is complete without the use of Access Control Lists (ACLs) to be able to keep traffic restricted between VLANs. For more information on configuring ACLs on MS switches, please refer to our article on Switch ACL Operation.
Multiple VLANs
With security in place, we can take some initiative in designing the campus to decrease the size of broadcast domains by limiting where VLANs traverse. This requires architecting for VLANs to be trunked to only certain floors of the building or even to only certain buildings depending on the physical environment. This reduces the flooding expanse of broadcast packets so that traffic doesn’t reach every corner of the network every time there’s a broadcast, reducing the potential impact of broadcast storms. For example, the network design may utilize VLAN 3 for Data and VLAN 4 for Voice on the first floor, then apply VLAN 5 for Data and VLAN 6 for Voice on the second floor.
When configuring trunks to the first floor Intermediate Distribution Frames (IDFs), only VLANs 5 and 6 would be required. Such a design can be easily repeated, scaling up to a multi-building campus, assigning one or more VLANs for traffic segregation. This also helps in troubleshooting, helping to locate a user based on the IP address received. Configuring VLANs allowed on a trunk is straightforward in dashboard by using a comma separated list, so to allow VLANs 1,2,3,4 and 10 through 20, simply type 1-4, 10-20.
Note that Meraki switches do not require VLANs to be created or added in order for them to be accepted on trunk interfaces. Therefore, protocols such as Cisco VTP are not necessary, but are compatible with MS switches (i.e. VTP transparent mode).
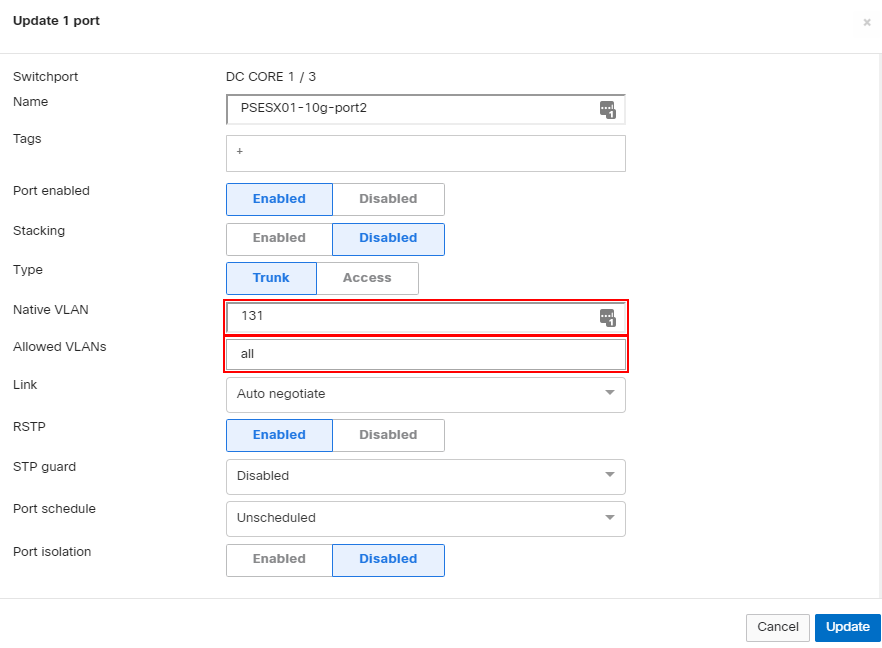
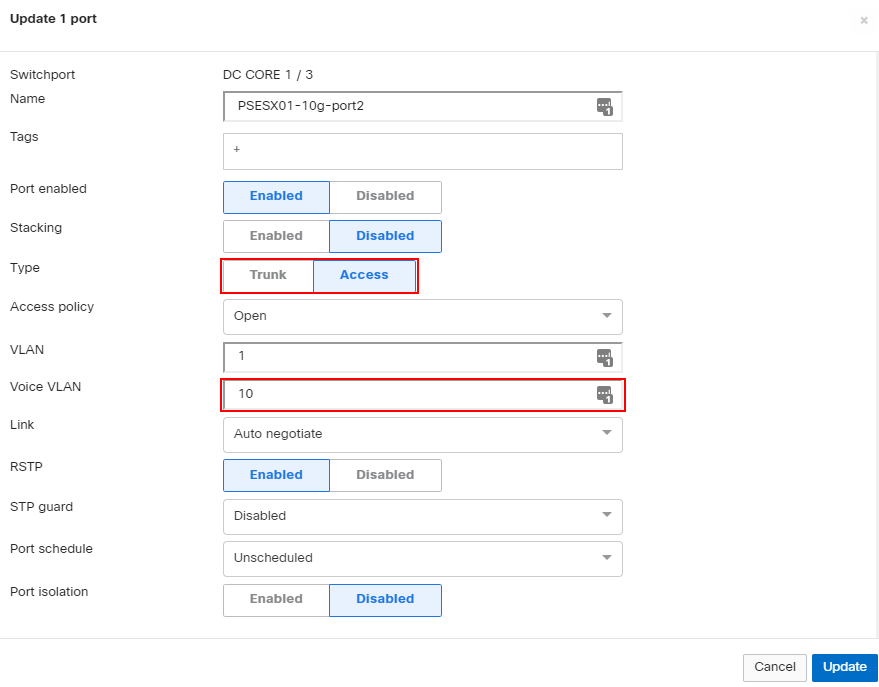
For any deployment using Voice over IP (VoIP) it’s a good idea to ensure the voice traffic gets assigned to the correct VLAN. A lot of times, this voice VLAN is defined in addition to the normal traffic VLAN and modern phones will often have a PC connected through them. With Meraki switches we can easily assign a voice VLAN that the phone will get passed so that it can tag its traffic into the appropriate VLAN. This transaction is done via CDP or LLDP, depending on the phone model being used. The configuration of this VLAN is straightforward in the dashboard. Configure the port as an access port, defining the normal VLAN and then, additionally, the Voice VLAN.
Administration & Access Control
Administration visibility and access can be custom-defined within the Meraki dashboard. With different privilege levels and the ability to tag ports/devices to control who has access visibility and control can be handed out as necessary. Within the dashboard, the options of full access, restricted access, or read only access can be defined on a per-individual basis. This allows your help desk staff to have visibility and control over user ports, allows your networking team to have control over specific building or the entire organization level, and allows the stakeholders to have visibility without the ability to break anything.
To isolate or reduce the amount of access certain admins have the ability to tag switches and/or ports provides the ability to give some access to certain ports/switches and reduce the ability of the admin to bring down critical network functions. This can be done easily in the UI on the list of switch ports. Once the ports are tagged, just tie the tag to the admin.

Visibility
At this point the campus network setup is complete, utilizing the cloud. The next step would be ensuring users transition smoothly to the brand new network. The dashboard can be used to provide excellent reporting and knowledge of what’s happening in the new campus deployment. The dashboard will provide an overview of what clients are doing with Meraki’s built-in traffic analytics.
Meraki’s layer 7 application visibility is enhanced to dynamically detect applications running on the network, and provide hostname and IP address visibility. This information can be used to understand user behavior on the network and make policy decisions, such as creating custom traffic shaping rules, or applying group policies to specific users.
Enabling Traffic Analytics
This is an opt-in feature and can be enabled under the Network-wide > Configure > General page by enabling Traffic analysis. To learn more about this feature read about hostname visibility.

Using Traffic Analytics
The enhanced Traffic analytics page will be visible under the Network-wide > Monitor > Traffic analytics menu whenever hostname visibility is enabled under Traffic analysis. This page will provide a total unique client count across an entire network over time. The view can be customized for different time periods (last 2 hours, week, day, and month), and on a per-SSID basis.
This page will show the following information on a per-network or per-SSID basis:
-
Application
-
Specific destination for broad application categories such as ‘Miscellaneous secure web’
-
Protocol information
-
Port information
-
Usage breakdowns by %, data sent and received, number of flows
-
Total active time on application across all clients
-
Number of clients
Signature or Application-Level Analytics
By clicking on an application signature (e.g. ‘Dropbox’ or ‘Non-web TCP’), it’s possible to see a complete breakdown of hostnames and IP addresses comprising this application category. Use this information to understand the communication patterns of certain types of traffic.
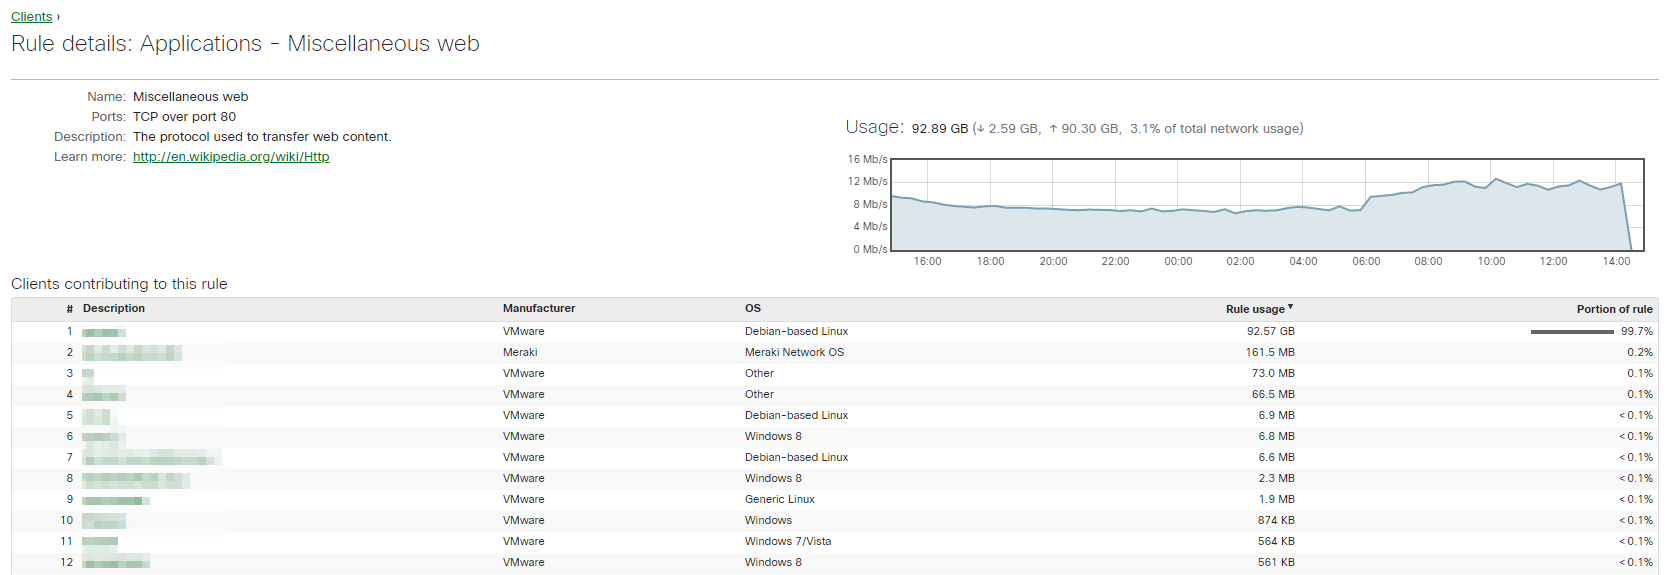
This page will show you the following information on a per-application basis:
-
Application name, category, ports, description
-
Usage over time
-
List of users
-
Destination list - hostnames and IP addresses contributing to this application
-
Total number of clients per destination
-
Time spent per client
User Level Analytics
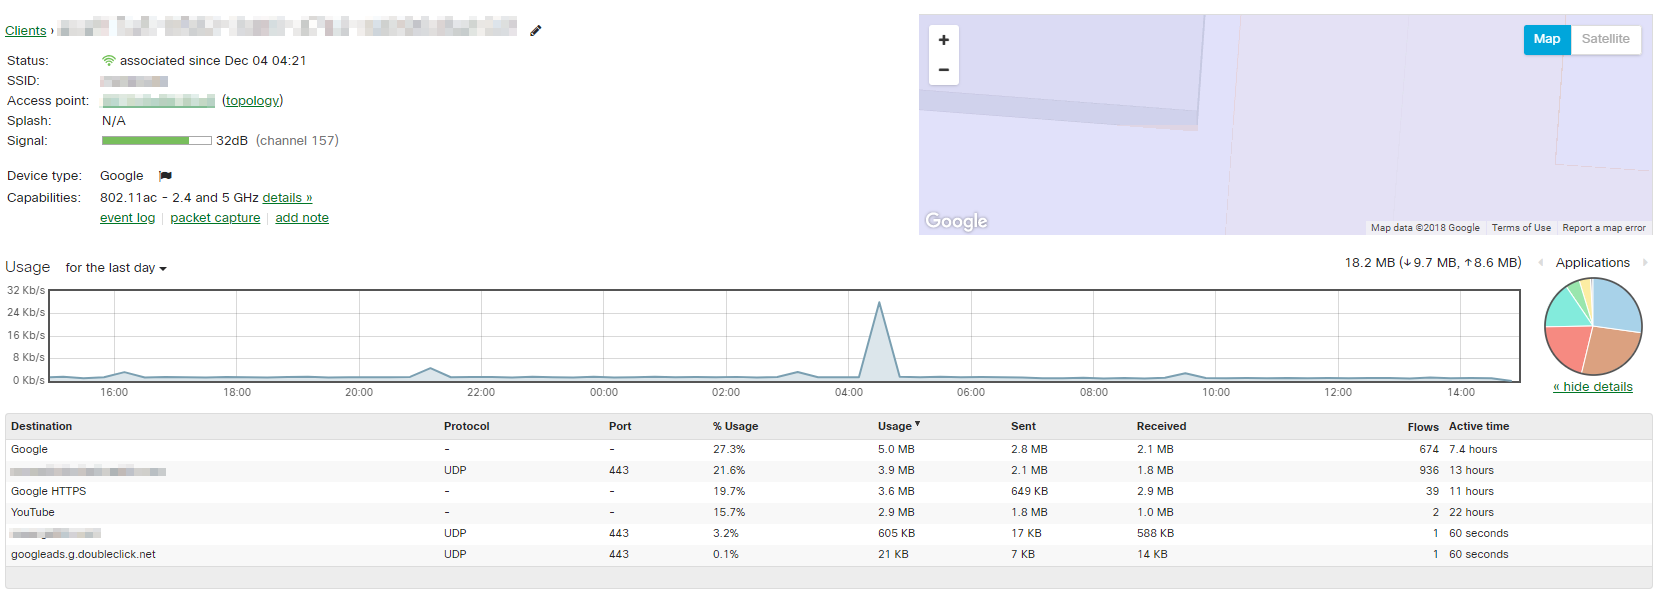
By clicking on a specific user, it’s possible to see a complete breakdown of hostnames and IP addresses this user has visited, including the time spent on each destination. Use this information to understand individual user behavior and apply policies on a per-user basis.
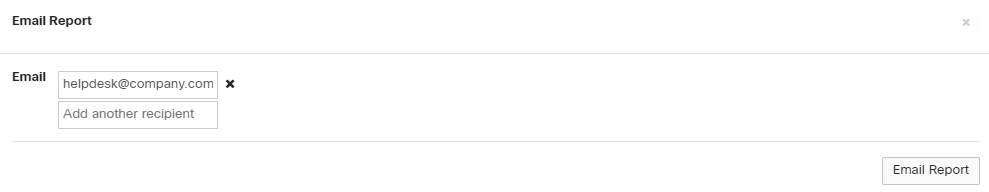
Summary reports can be mailed directly to the network administrator, relieving them of at least one task when their plate is full. These reports provide updates on the network and can be shared directly to key stakeholders with little to no effort.
Troubleshooting with MS
Traffic analytics and summary reports emailed directly to the inbox help ease the burden of the engineer. That is, until the first trouble ticket comes in from someone unable to print to their local printer or unable to access a resource on the file server. While this used to be a headache, the task can be done quickly by utilizing the visibility of the dashboard. Simply open up the clients page and type in the name associated with the user or their PC. This will filter the list directly to the machine in question.

Once the machine in question has been located, there’s more information that can be provided. By clicking on the device we’re interested in, we can get details such as what switch/port or even AP it’s connected to as well as IP address, MAC address and even firewall information.
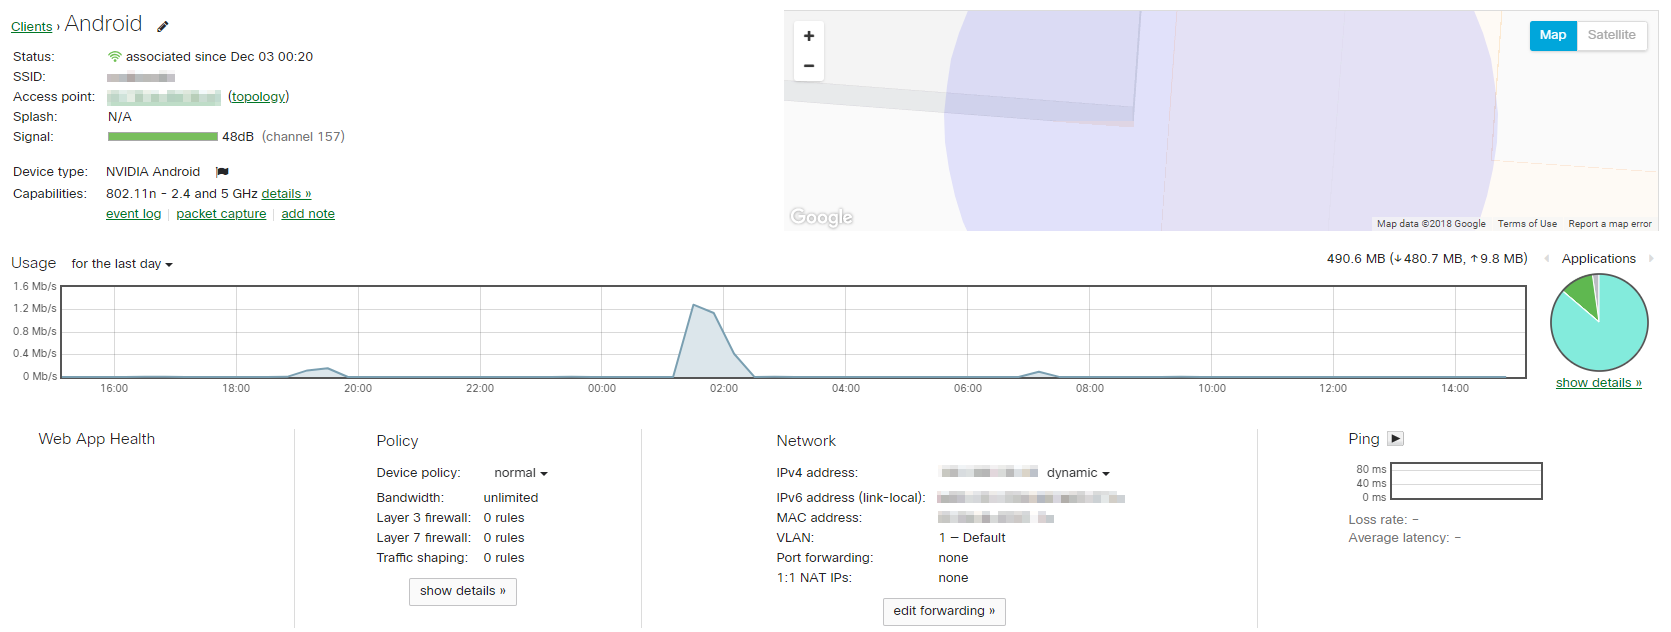
This screen allows us to quickly get an overview of the client and even try to ping it from the dashboard. We can also simply take a packet capture of the traffic while having the end user attempt the action that was failing. There’s also additional information if we’re tracking clients using Systems Manager (SM), enabling us to see what software is installed and making sure it’s in sync with any updates or policies that might be applied via SM.
If we want to rule out a physical layer issue this can be done straight from dashboard using the cable test utility available on the switches.
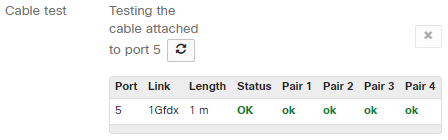
This allows us to rule out the physical layer simply and easily without trying to find a cable tester or sending someone to a remote location with cables and a tester to verify. With the information provided by the cable test, extra cables or a new cable run can be implemented if the test comes back as failed.
Another dashboard tool is the topology view, which provides insight into the network and how it’s connected, even showing a redundant link that’s not plugged in. In the case of a hybrid deployment, information can be pulled from directly connected devices to see that things are wired properly in the infrastructure.
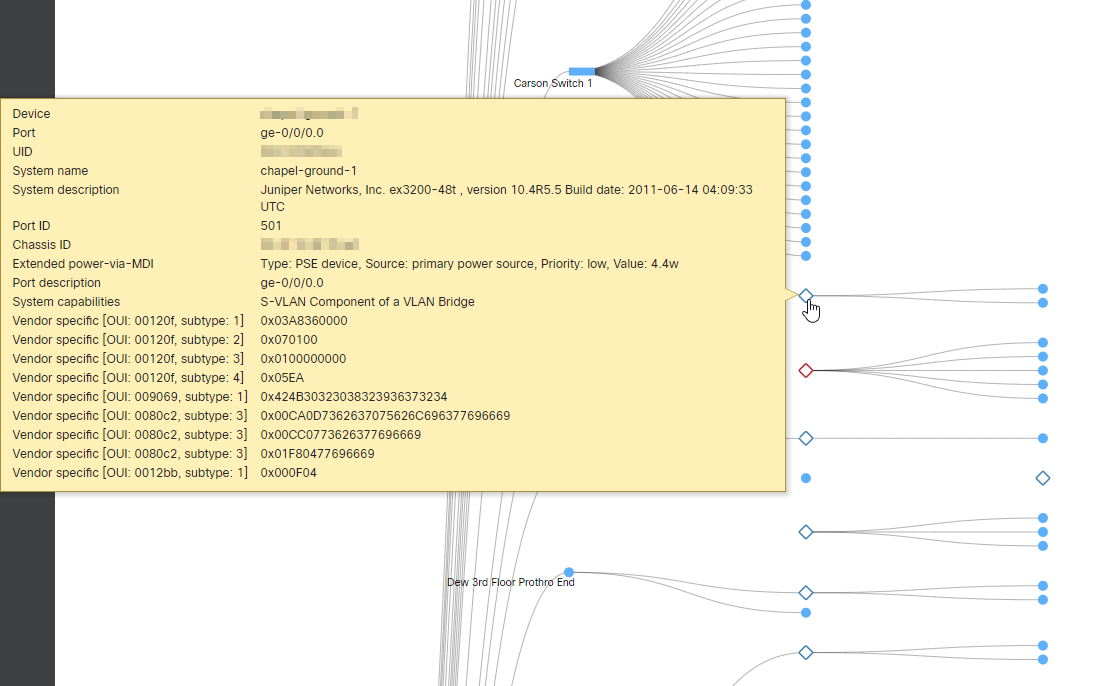
It should be noted that the dashboard topology view is only available on networks with at least one MS switch.