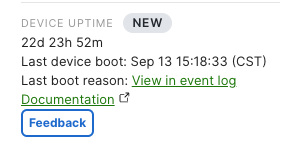
Device Uptime
Click 日本語 for Japanese
Overview
Device uptime displays how long a Meraki or Catalyst Wireless Cloud Monitored device has been powered on. The feature is accompanied by a last boot reason, which is logged to the Event log.

Use Cases
There are several reasons a network administrator may want to check their device's uptime. Those reasons include but are not limited to network administrators who need to confirm: whether a network outage was due to an upstream issue or a local power event, whether a firmware upgrade was successful, or whether a device was successfully rebooted via the dashboard or API.
Requirements and Limitations
Device uptime is supported on all Cisco Meraki switch models and most access points. Support for other products is planned for future availability.
Switching
- Cisco Meraki switches must be running MS 15.21.1 / CS 17.1 firmware or higher for the dashboard and API to report device uptime.
- Timestamps between the switch details page and event log can be up to 5 minutes apart.
Wireless
- Cisco Meraki APs must be running 30.x and above firmware version in dashboard to have the uptime information reported.
- Only networks that have all Wi-Fi 6 and above APs will be supported to show uptime information in Dashboard, any networks that include an older generation of AP(s) will not support the feature.
- Timestamps between the access point details page and event log can be up to 5 minutes apart.
- Uptime visibility is being rolled out as of December 2023, and may not be visible to all users yet as this is a phased roll out.
Cloud-monitored
- Device uptime is supported for Catalyst Wireless Cloud Monitoring wireless controllers and Access Points.
- Cloud Monitored Catalyst Switches device uptime is not yet supported.
- Catalyst Wireless Cloud Monitored wireless controllers last boot reason is not yet supported.
Boot Reasons
There are several reasons a device might reboot. Here are the following reasons, all of which get logged to the Event log, provided the device has cloud connectivity. These can be easily accessed by clicking “View in event log”, or by navigating to Network Wide > Monitor > Event Log and filtering on the Device Boot event type.
| Reason | Description |
|---|---|
| Power event or other | The device has either rebooted due to a power related issue or in very rare cases, a software problem. If you suspect a stability issue ensure you're running the latest firmware. If you continue to see these events, contact Cisco Meraki Support. |
| Administrator initiated | The device was rebooted by an administrator using the dashboard live tool or the API. |
| Firmware upgrade | The device rebooted due to a firmware upgrade |
| Firmware upgrade failed | The device attempted to upgrade its firmware but was unsuccessful and rebooted. Firmware upgrades may fail if the switch is unable to reconnect to dashboard after a firmware upgrade completes or the firmware upgrades exceeds 2 hours. |
| Device was factory reset | A user depressed the physical reset button on the device, causing the device to be reset. |
Cloud-Managed Catalyst Specific Reasons
| Reason | Description |
|---|---|
| Device down | A switch in the stack loss power or rebooted |
| Device container up | The device's container initialized |
| Device container down | The device's container has stopped running |
Cloud-managed Catalyst switches use a container architecture for communicating with the Meraki dashboard, applying 802.1X access policies, and hosting the SNMP server and Syslog client.
Event Log
When a device goes offline and comes back online, a device boot event will be recorded in the Event log. In the details section, you will be able to find information about what caused the device to boot up, firmware upgrade, power event (loss of power), etc.

Event log entries older than 30 days might be unavailable. Learn more about our data retention policy here.
API
The API endpoint, getOrganizationDevicesBootsHistory (GET /organizations/{organizationId}/devices/boots/history), returns a list of all boot records for devices in the organization. If a device is currently online, you can use these records to derive uptime by subtracting the current time with the bootedAt timestamp. You can use API endpoint getOrganizationDevicesBootsHistory, providing the history of your device boots, and getOrganizationDevicesAvailabilitiesChangeHistory, providing the change history of your device availabilities, together for a more complete view.
Troubleshooting Unexpected Reboots
Identifying not only the occurrence of a reboot, but its cause, is important towards ensuring continued network stability. While the above Boot Reasons chart should provide some initial guidance, the following steps can be taken to narrow down the cause of any unexpected reboots.
Identify Scope
How many devices rebooted at the time of the incident? If more than one, are they the same device type and do they share the same power source? It’s unlikely for a local device failure to occur across multiple devices simultaneously, and so external factors should be considered in this scenario.
Identify Patterns
Is it the same device or set of devices that are rebooting? Do they consistently occur within a specific interval or timeframe? Are the devices operating on an outdated firmware version?
Identify Recent Changes
When did the reboots start? Do they coincide with any network configuration changes or changes to the physical environment?
Take Action
Once the scope has been identified, steps should be taken to determine if the fault is with the device itself. For example, if a device is frequently rebooting, try changing its power source or swapping the device with another that isn’t. If the issue follows the device, then it may be faulty and require replacement, but if it follows the power source, then that will need to be investigated instead.
If further assistance is required during investigations or if a device is suspected to be faulty, contact Cisco Meraki Support for guidance.

