
Meraki Status Page
Overview
This article explains the Meraki Status Page, the value it represents, and how to use it.
This Page keeps customers informed of severe outages within the Meraki Cloud. It shares a high-level description of incidents that Meraki is aware of and how Meraki addresses them.
After reading this article, you will know the purpose, benefits and whatto expect from this page. Along with this you will also know about how to subscribe to the Meraki Status Page for updates
Benefits
- Customers quickly grasp the scope of critical incidents in flight at Meraki.
- Components categorize Services and Regions, so customers focus on a more granular view.
- Customers stay informed about critical in-flight incidents without contacting Meraki Support.
- Customers subscribe to updates when they choose, including Component-specific subscriptions.
Updates are available in the following formats:
- RSS feed
- ATOM feed
- Slack
Scope of incidents
The Meraki Status Page communicates critical, global customer outages only. Only outages that affect most customers appear on the page. This implies an outage of a large number of Meraki servers, or a critical supporting service that affects most customers.
If a particular Meraki server that your Meraki devices use is down, but most servers operate normally, you should not expect a posting on the Meraki Status Page.
The following conditions are specifically excluded from posting on the Meraki Status Page (non-exhaustive):
- Maintenance notifications
- Issues that affect only a single Meraki server, or a small group of servers (anything less than a cluster/region)
- Any non-critical services that are down (even if they affect all customers)
- General Dashboard latency, unless attributed to a global outage
- Latency of specific operations (for example, processing new device claims or auto-VPN updates), unless attributed to a global outage
Status Page Components
Status Page Components categorize incidents by Service and Region, helping you quickly identify impacts to your specific environment. Meraki aims for granular detail, but applies Components at its discretion based on the information available to ensure accurate and clear communication for each incident.
Components in Status Page postings are encouraged but not required for every incident. As part of the Incident Management process, Meraki follows a subjective process for understanding the scope of the incident impact on customers and creates appropriate messaging accordingly.
Service Components
The following Components define broad categories of Services:
- Dashboard — the Meraki Dashboard
- API — a programmatic interface to the Meraki Dashboard
- Network Device Connectivity — connectivity between customer-hosted Meraki network devices and the Cloud
- End User Device Connectivity — connectivity between end-user devices and customer-hosted Meraki network devices
- Access Point — a customer-hosted Wireless access point (MR)
- Switch — a customer-hosted switch (MS)
- WAN appliance — a customer-hosted WAN appliance (MX)
- Camera — a customer-hosted camera device (MV)
The Camera Service Component is not listed for the China or India geographic regions, as Cameras are not sold in those markets.
Region Components
The following components define Regions where Meraki services are supported:
- North and South America
- Europe
- Asia-Pacific
- Canada
- China
- India
What you can expect to see
The example incidents in this section explain what customers see on the Meraki Status Page.
The images shown are not taken from actual Meraki incidents and therefore won't be visible on the actual Meraki Status Page. They are for illustrative purposes only. The exact look and feel of actual incident posts may vary somewhat from what is shown.
New incident published
As part of the incident triage process, Meraki evaluates each new incident against the Scope of Incidents above. Once an incident is in scope, the teams post a preliminary message to share that an investigation is underway.

Update to incident published
As the investigation unfolds and the incident remediation team has information to share, additional posts appear. Keep the following in mind:
-
Updates are not posted on a fixed schedule, but as needed to convey useful information.
-
More than one update may be posted for an incident.
-
The level of detail is kept intentionally low to send a clear, comprehensible message.

Incident resolved
Once Meraki investigates and remediates an incident and restores normal service levels, the incident is Resolved on the Meraki Status Page. To view recently resolved incidents, select the Incident History link near the bottom-left corner of the page.

Meraki Status Page incident color legend
The color of the frame around the incident text conveys the relative severity of the incident. In the examples above, it begins as black, then shows yellow. The color legend is:
- None (black) — Newly created incidents default to this, as the severity may not be clear from the outset.
- Minor (yellow)
- Major (orange)
- Critical (red)
Prerequisites
- No login or authentication is required to view the Meraki Status Page.
- To subscribe to Slack updates, you must be the Workspace owner of a Slack instance or have Workspace owner permissions.
The Meraki Status Page is not incorporated into the Meraki Dashboard, by design. Keeping the page independent maximizes its utility if the Meraki Dashboard experiences an issue.
Step-by-step instructions
Access the Meraki Status Page
Access the Meraki Status Page at https://status.meraki.net. No login or authentication is required.
The URL https://status.meraki.com is also available; however, it redirects to https://status.meraki.net.
Manage Component notification subscriptions
Components extend granularity to notification subscriptions. You can tailor your subscriptions to receive notifications for only the Region(s) or Service(s) that you care about, and subscribe to as much or as little as you like.
The following example shows the subscription management cycle supported with Components. This example uses Email notifications, but the process works similarly for other notification methods.
-
On the main subscription screen, enter an email address for the notification subscription. This screen does not yet specify what you are subscribing to; that comes a few steps later.

-
After you enter your email address, the system emails a One Time Password (OTP) to that address.

-
Enter that password to gain access to the subscription screen.

-
If challenged with an image-based CAPTCHA, complete it to validate that you are an actual person accessing the subscription notification screen.
-
After you pass the CAPTCHA screen, a dialog window appears that lets you select the Regions and Services for which you want to receive notifications.

-
Check or uncheck the Regions and Services to your liking.
-
Select the Save button in the lower-right side of the window to save your notification subscription choices.

Repeat this process anytime you want to amend your notification subscription choices.
Subscribe to email updates
-
Navigate to https://status.meraki.net.
-
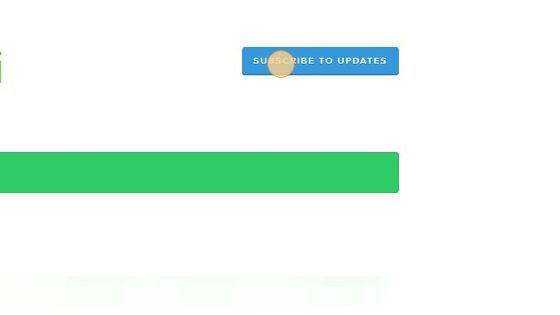
Select SUBSCRIBE TO UPDATES.
-
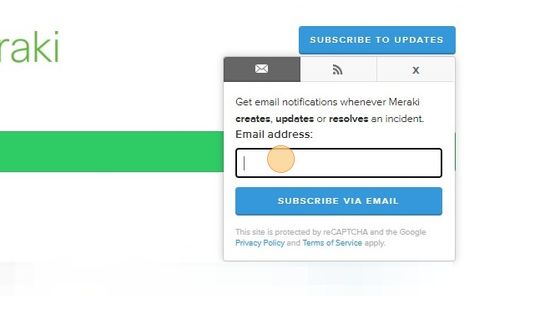
Select the Email address field.
-
Type the email address you want to receive updates.
-
Select the Subscribe Via Email button.
-
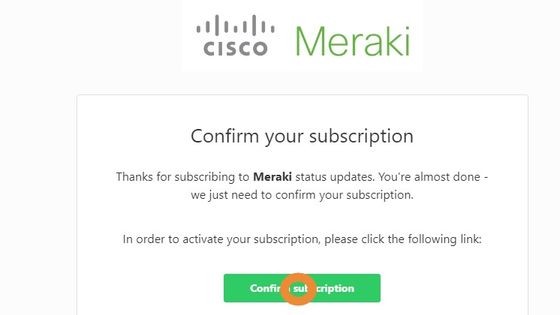
You receive a confirmation email from the Meraki Status Page. Select the Confirm subscription link in the email to finalize your email subscription.
In some cases, Statuspage may ask you to complete an image-based reCAPTCHA (matching up images) to prove that you are not an automated script. These steps are not reflected in the procedure above, but if they happen, they occur between steps 5 and 6.
Subscribe to an RSS feed
-
Navigate to https://status.meraki.net.
-
Select SUBSCRIBE TO UPDATES.
-
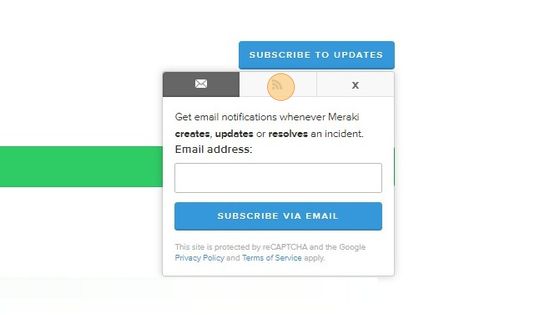
From the pop-up window, select the tab with the feed icon (looks like a wifi icon).
-
Select the link for RSS Feed.
The browser refreshes to show the RSS feed URL. Copy that URL and inject it into any tool that supports RSS feeds.
Subscribe to an Atom feed
-
Navigate to https://status.meraki.net.
-
Select SUBSCRIBE TO UPDATES.
-
From the pop-up window, select the tab with the feed icon (looks like a wifi icon).
-
Select the link for Atom Feed.
-
The browser refreshes to show the Atom feed URL. Copy that URL and inject it into any tool that supports Atom feeds.
Subscribe to Slack updates
If you are the Workspace owner of a Slack instance (or have Workspace owner permissions), you can subscribe to updates in one of your Slack channels.
-
Visit the Meraki Status Page and select the blue Subscribe to Updates button. Choose the Slack icon from the pop-up menu, then select Subscribe via Slack.
-
After selecting Subscribe via Slack, sign in to your workspace on Slack. Grant Slack the permissions that the Meraki Status Page needs to access the workspace.
-
While granting permissions, select the Slack channel where you want notifications posted.
-
The integration process may require you to send an authorization request to your Slack App Manager before you can install the integration.
-
Once the integration is installed, you receive a success message in your web browser and a welcome message in Slack from the Statuspage app.
To get updates to a private Slack channel, you must invite the Statuspage app to that channel.
Cancel your email subscription
To stop your email subscription, select the Unsubscribe link at the bottom of every email you receive from the Meraki Status Page (including your subscription confirmation email).
Verification
- After you subscribe via email, confirm your subscription by selecting the Confirm subscription link in the confirmation email. Receiving this email verifies that your subscription request was successful.
- After you subscribe to an RSS or Atom feed, the browser refreshes to display the feed URL, confirming the feed is active.
- After you subscribe via Slack, a success message appears in your web browser and a welcome message appears in Slack from the Statuspage app, confirming the integration.
- After you save Component notification choices, the subscription window confirms your saved Regions and Services.
Troubleshooting
- If a particular Meraki server your devices use is down but most servers operate normally, you should not expect a posting on the Meraki Status Page. The page communicates only critical, global outages.
- If you subscribe to a private Slack channel but do not receive updates, verify that you invited the Statuspage app to that channel.
- If an image-based reCAPTCHA appears during email subscription, complete it to proceed. This step occurs between selecting Subscribe Via Email and receiving the confirmation email.
Additional resources
Contact Meraki Support if this article did not answer your questions.