Using Chrome Devtools with Wireshark
Overview
The purpose of this article is to provide instruction on how to take data from Chrome devtools and use it to troubleshoot resources loading within Wireshark. It is meant as a basic educational starting point. Chrome devtools is going to be the tool of choice for this article even though there are other tools such as Firebug for Firefox.
With web pages getting more and more complex sometimes it is hard to determine what exactly isn’t loading on a webpage. Devtools shows all of the requests that a webpage makes in order to fully load. In order to properly troubleshoot you'll need to have Chrome and Wireshark running on your machine. Wireshark will need to be capturing on the interface that the computer will be sending traffic through. You'll also want to have chrome://net-internals open when you start troubleshooting.
Steps to Troubleshoot
Add Connections ID to Devtools
Open the Chrome menu and navigate to Developer Tools in the More Tools section.

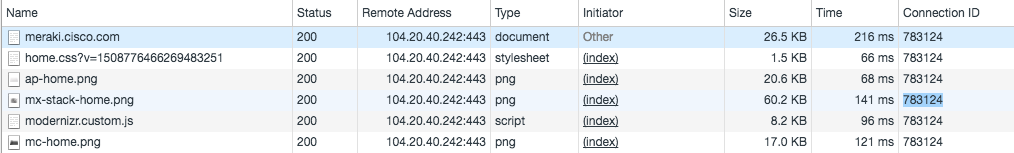
Once Devtools has opened a window pane will start populating data. We want to focus on the network tab. Loading the meraki.cisco.com webpage, we can see multiple page resources that were loaded by the browser.
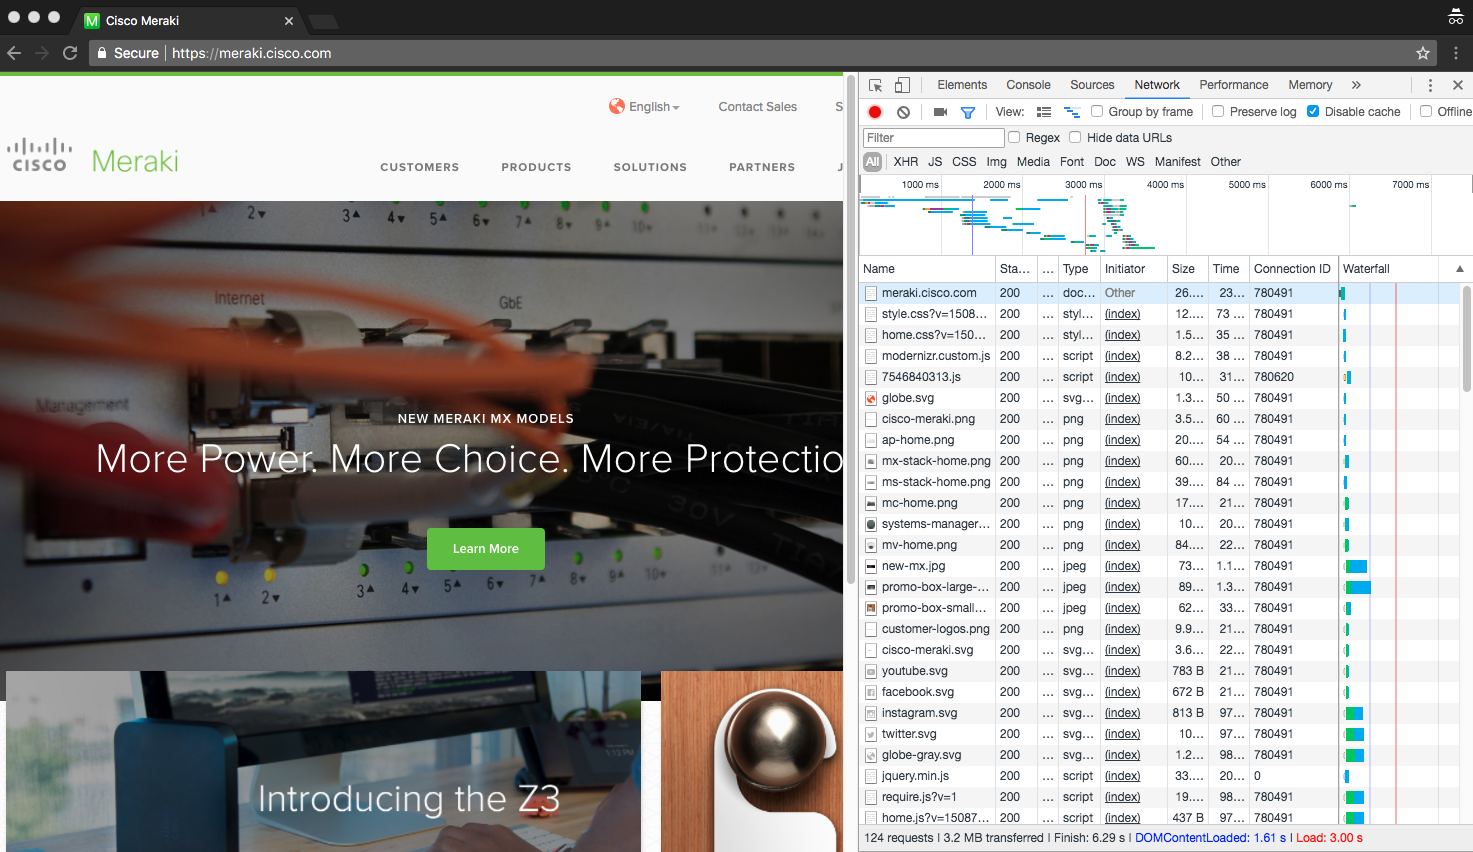
Once Devtools has opened a window pane will start populating data. We want to focus on the network tab. Loading the meraki.cisco.com webpage we can see multiple page resources that were loaded by the browser.
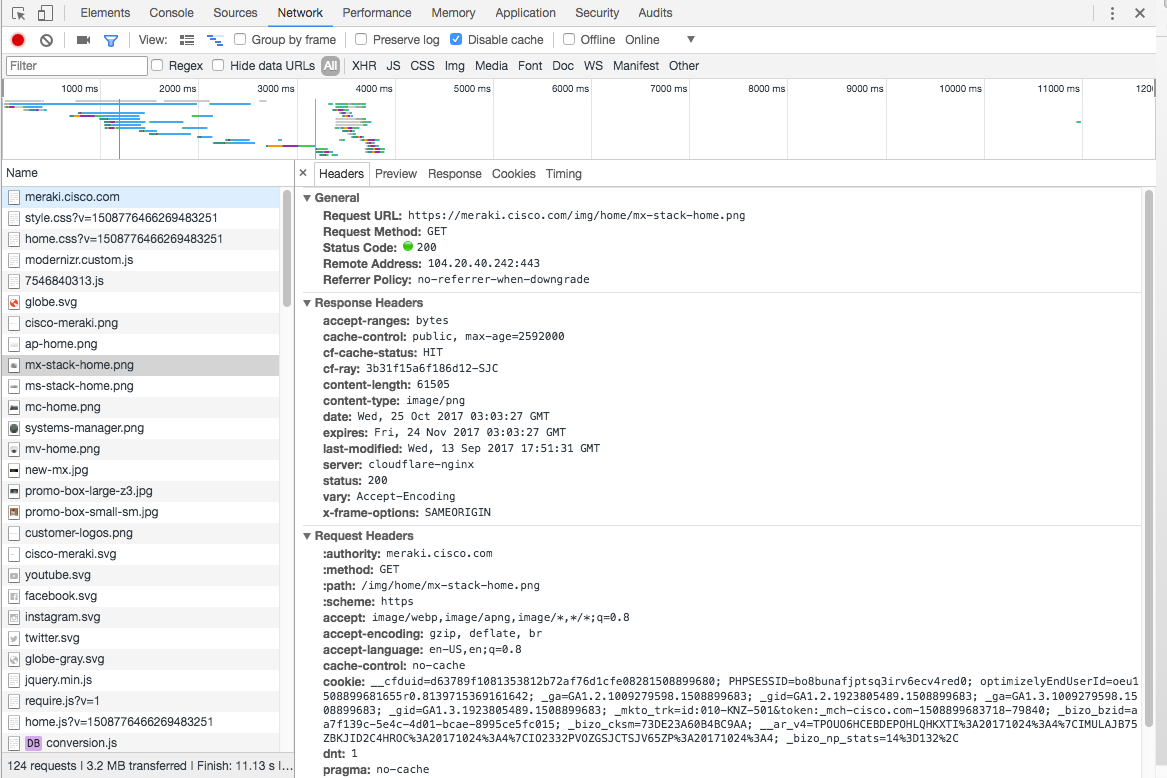
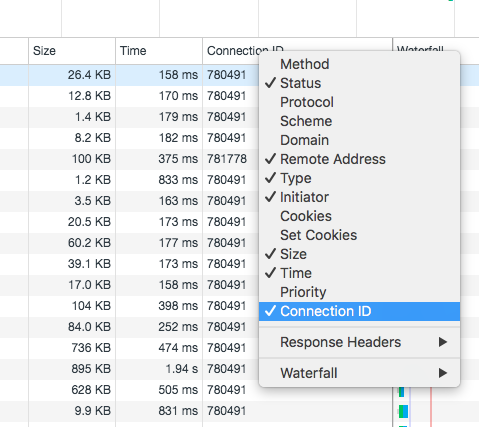
Now we can add a column for Connection ID.
Note the Connection ID that you want to troubleshoot.
Find the Source Port of the Connection ID
Open chrome://net-internals/#events and search id:111111 (where 111111 is the connection id). If this page isn't open when you got the connection ID then you'll need to refresh the page you're troubleshooting and get the connection id again.
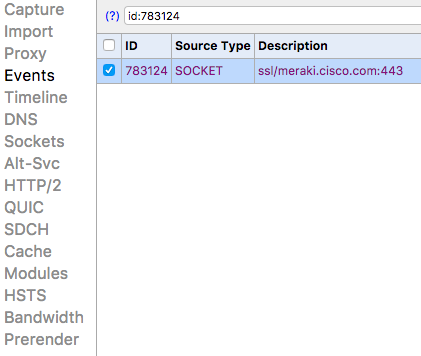
You'll now be able to see source port of the TCP connection.
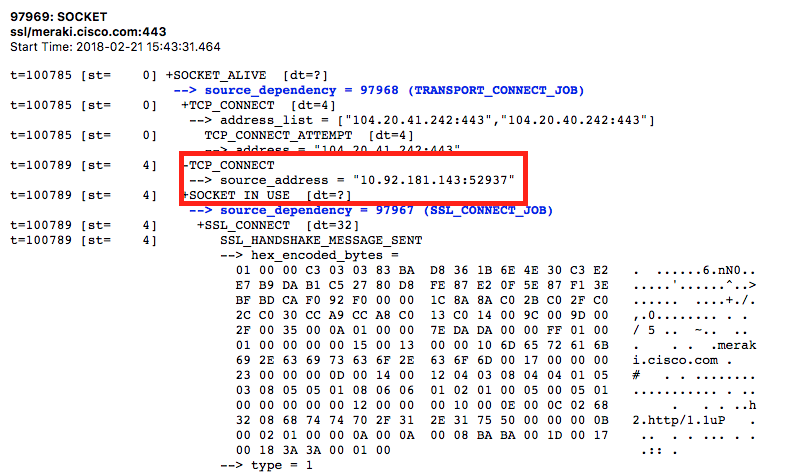
Analyze the TCP Flow in Wireshark
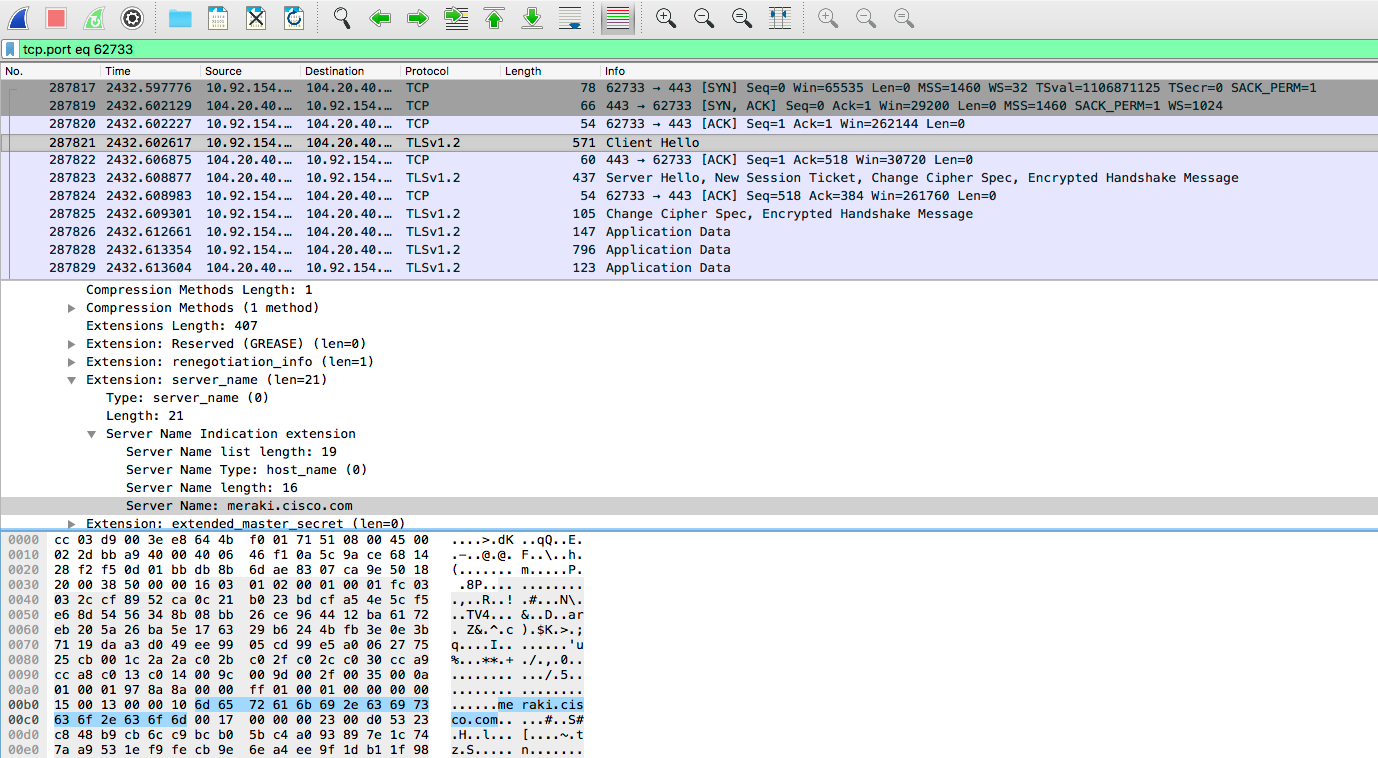
With the source port you can now filter for the connection with the filter tcp.port == SRCPORT. This will allow you to effectively filter the connection from the browser to the server.