
How to Set Up Webhooks in the Meraki Dashboard
Overview
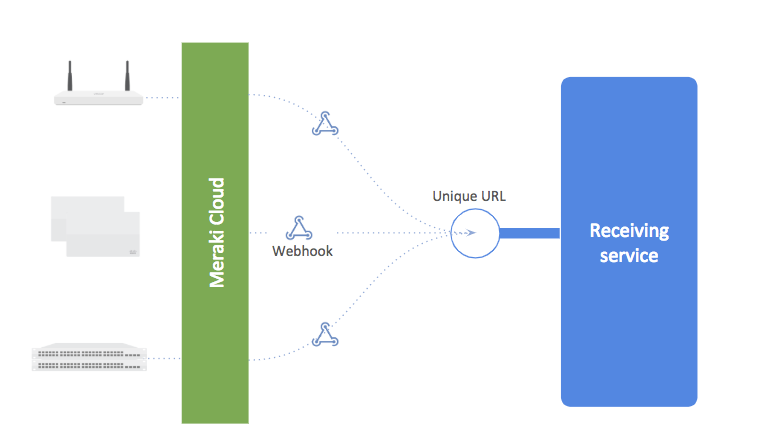
Meraki webhooks are a lightweight way to subscribe to alerts sent from the Meraki Cloud when something happens on your network. Each webhook is an API-style message in machine- and human-readable JSON, delivered to a unique URL where you can process, store, or use it to trigger automations.
This article explains what Meraki webhooks are, what they can be used for, how to configure them in dashboard, the firewall rules required at your receiver, and how Meraki monitors receiver health (including the auto-disable policy and how to recover from it).
Webhooks support all configurable alert types available in dashboard under Network-wide > Configure > Alerts. This includes alerts for every product type you own or operate.
Webhooks architecture consists of the Meraki cloud and a cloud-accessible HTTPS receiver (server). Several standalone cloud webhook services (for example, hook.io and Zapier) can receive and forward webhooks.

As of August 20, 2019, non-HTTPS receivers are no longer supported.
Benefits and features
Webhooks are a powerful tool for network monitoring and can be integrated with other reporting and automation systems so your business can react to and learn from outages and network changes.
-
Helpful for service providers and other organizations that need around-the-clock monitoring of their networks.
-
Receive updates within minutes for outages, network changes, new configurations, and many other events in your environments.
-
Any alerts configured on the Network-wide > Configure > Alerts page are sent as webhooks in addition to emails to network administrators.
-
Meraki alerts include a JSON-formatted message sent to a unique URL where you can process, store, or use them to trigger automations.
Prerequisites
-
A Meraki Dashboard account with permissions to edit Network-wide > Configure > Alerts and Organization > Configure > API & Webhooks.
-
A cloud-accessible HTTPS receiver (your own server or a third-party service such as hook.io or Zapier) that can accept inbound HTTPS POST requests.
-
A valid SSL/TLS certificate on the receiver, signed by a globally trusted Certificate Authority. Self-signed certificates are not supported.
-
Ability to configure inbound firewall rules at the receiver to allow Meraki source IP ranges listed under firewall rules.
Step-by-step instructions
Configure a webhook receiver in dashboard
Create the HTTPS receiver definition in dashboard and selects it as a recipient for alerts.
-
Go to Network-wide > Configure > Alerts.
-
In the Webhooks section, add one or more HTTPS receivers. Save the page.
-
On the same page, add the configured webhook as a recipient for the alerts you want to send.
For detailed configuration steps with screenshots, go to https://create.meraki.io/guides/webhooks/.
Configure firewall rules at your receiver
Open the network path between the Meraki cloud and your receiver so webhook deliveries are not blocked.
Once you have configured the webhook in dashboard, the IPs and ports populate on the Firewall Info page in dashboard. Configure these inbound on your receiving server. The FQDN and ports are based on the FQDN and port configured in your URI and may not be the same as below.

Source IP ranges:
-
209.206.48.0/20
-
216.157.128.0/20
-
158.115.128.0/19
Verification
Verify that dashboard can reach your receiver successfully:
-
Go to Organization > Configure > API & Webhooks > Webhooks tab in the Meraki dashboard.
-
Locate your configured receiver and click Send test.
-
Confirm you see the message "Webhook test was successful!"
Troubleshooting
Receiver health monitoring and auto-disable policy
Meraki continuously monitors the health of all configured webhook receivers. If a receiver fails consistently over an extended period, dashboard automatically disables it.
-
A webhook receiver is automatically disabled if delivery consistently fails for more than 100 attempts in 24 hours.
-
Temporary failures (brief downtime, intermittent errors) do not trigger auto-disable. Only sustained, consistent failures result in disabling.
-
When a receiver is disabled, dashboard sends an email notification to the organization administrator(s).
How to re-enable your webhook receiver
Once you have fixed the underlying issue with your webhook endpoint:
-
Go to Organization > Configure > API & Webhooks > Webhooks tab in the Meraki dashboard.
-
Delete the disabled webhook receiver.
-
Create a new webhook receiver with the same (now-working) URL.
-
Save the URL and click Send test to confirm you get the message "Webhook test was successful!"
Common webhook receiver failures and how to avoid them
This list names the most common reasons a receiver fails so you can rule them out quickly before opening a support case.
- Your webhook receiver service crashed or server is offline
- There is a typo in the URL, or endpoint path has changed
- HTTPS endpoint has an expired, self-signed, or mismatched certificate
- Endpoint requires authentication but credentials are wrong/missing
- Firewall does not allow connections from Meraki IP ranges
- Endpoint responds with HTTP 2xx status codes (You can use https://webhook.site/ to test if the webhook receiver is functional)