Guest Insights in Meraki Go
Meraki Go wireless access points offer the ability to gain insights about the people who walk by and come to your small business, even if they don't connect to your WiFi or come inside. This can help you understand things like peak foot-traffic times throughout the day, how long people are in your business for week over week, and how frequently they return in a month.
Please note that this feature is disabled by default for EU customers due to GDPR. It can be enabled by going to Settings > Guest insights, and toggling the feature to be enabled.
Viewing Guest Insights
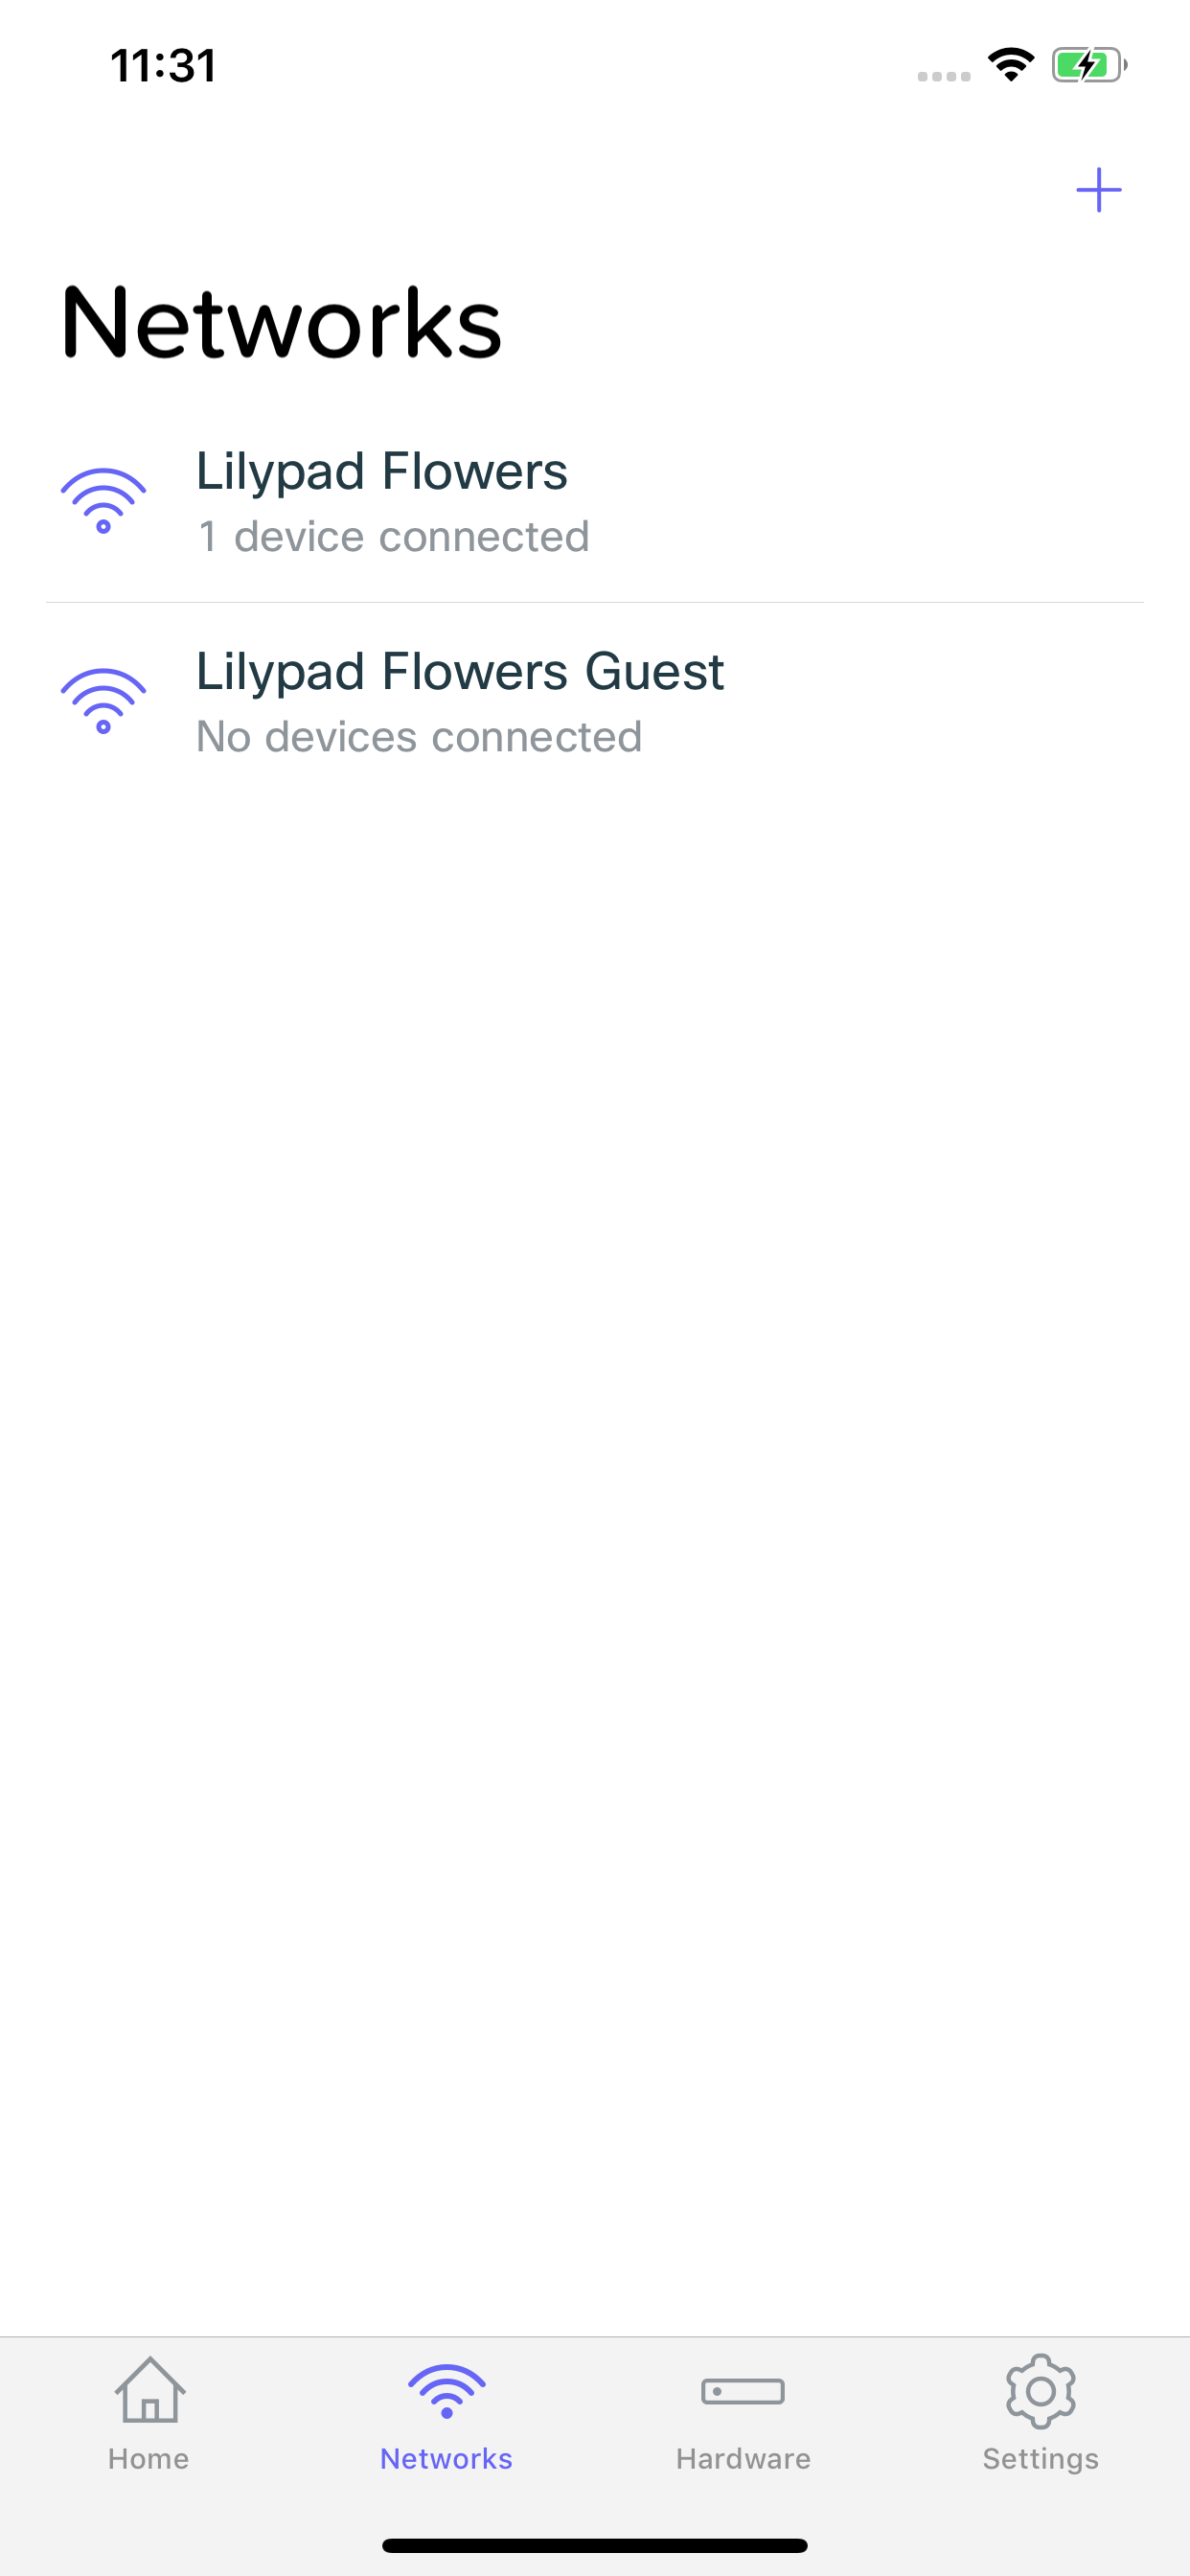
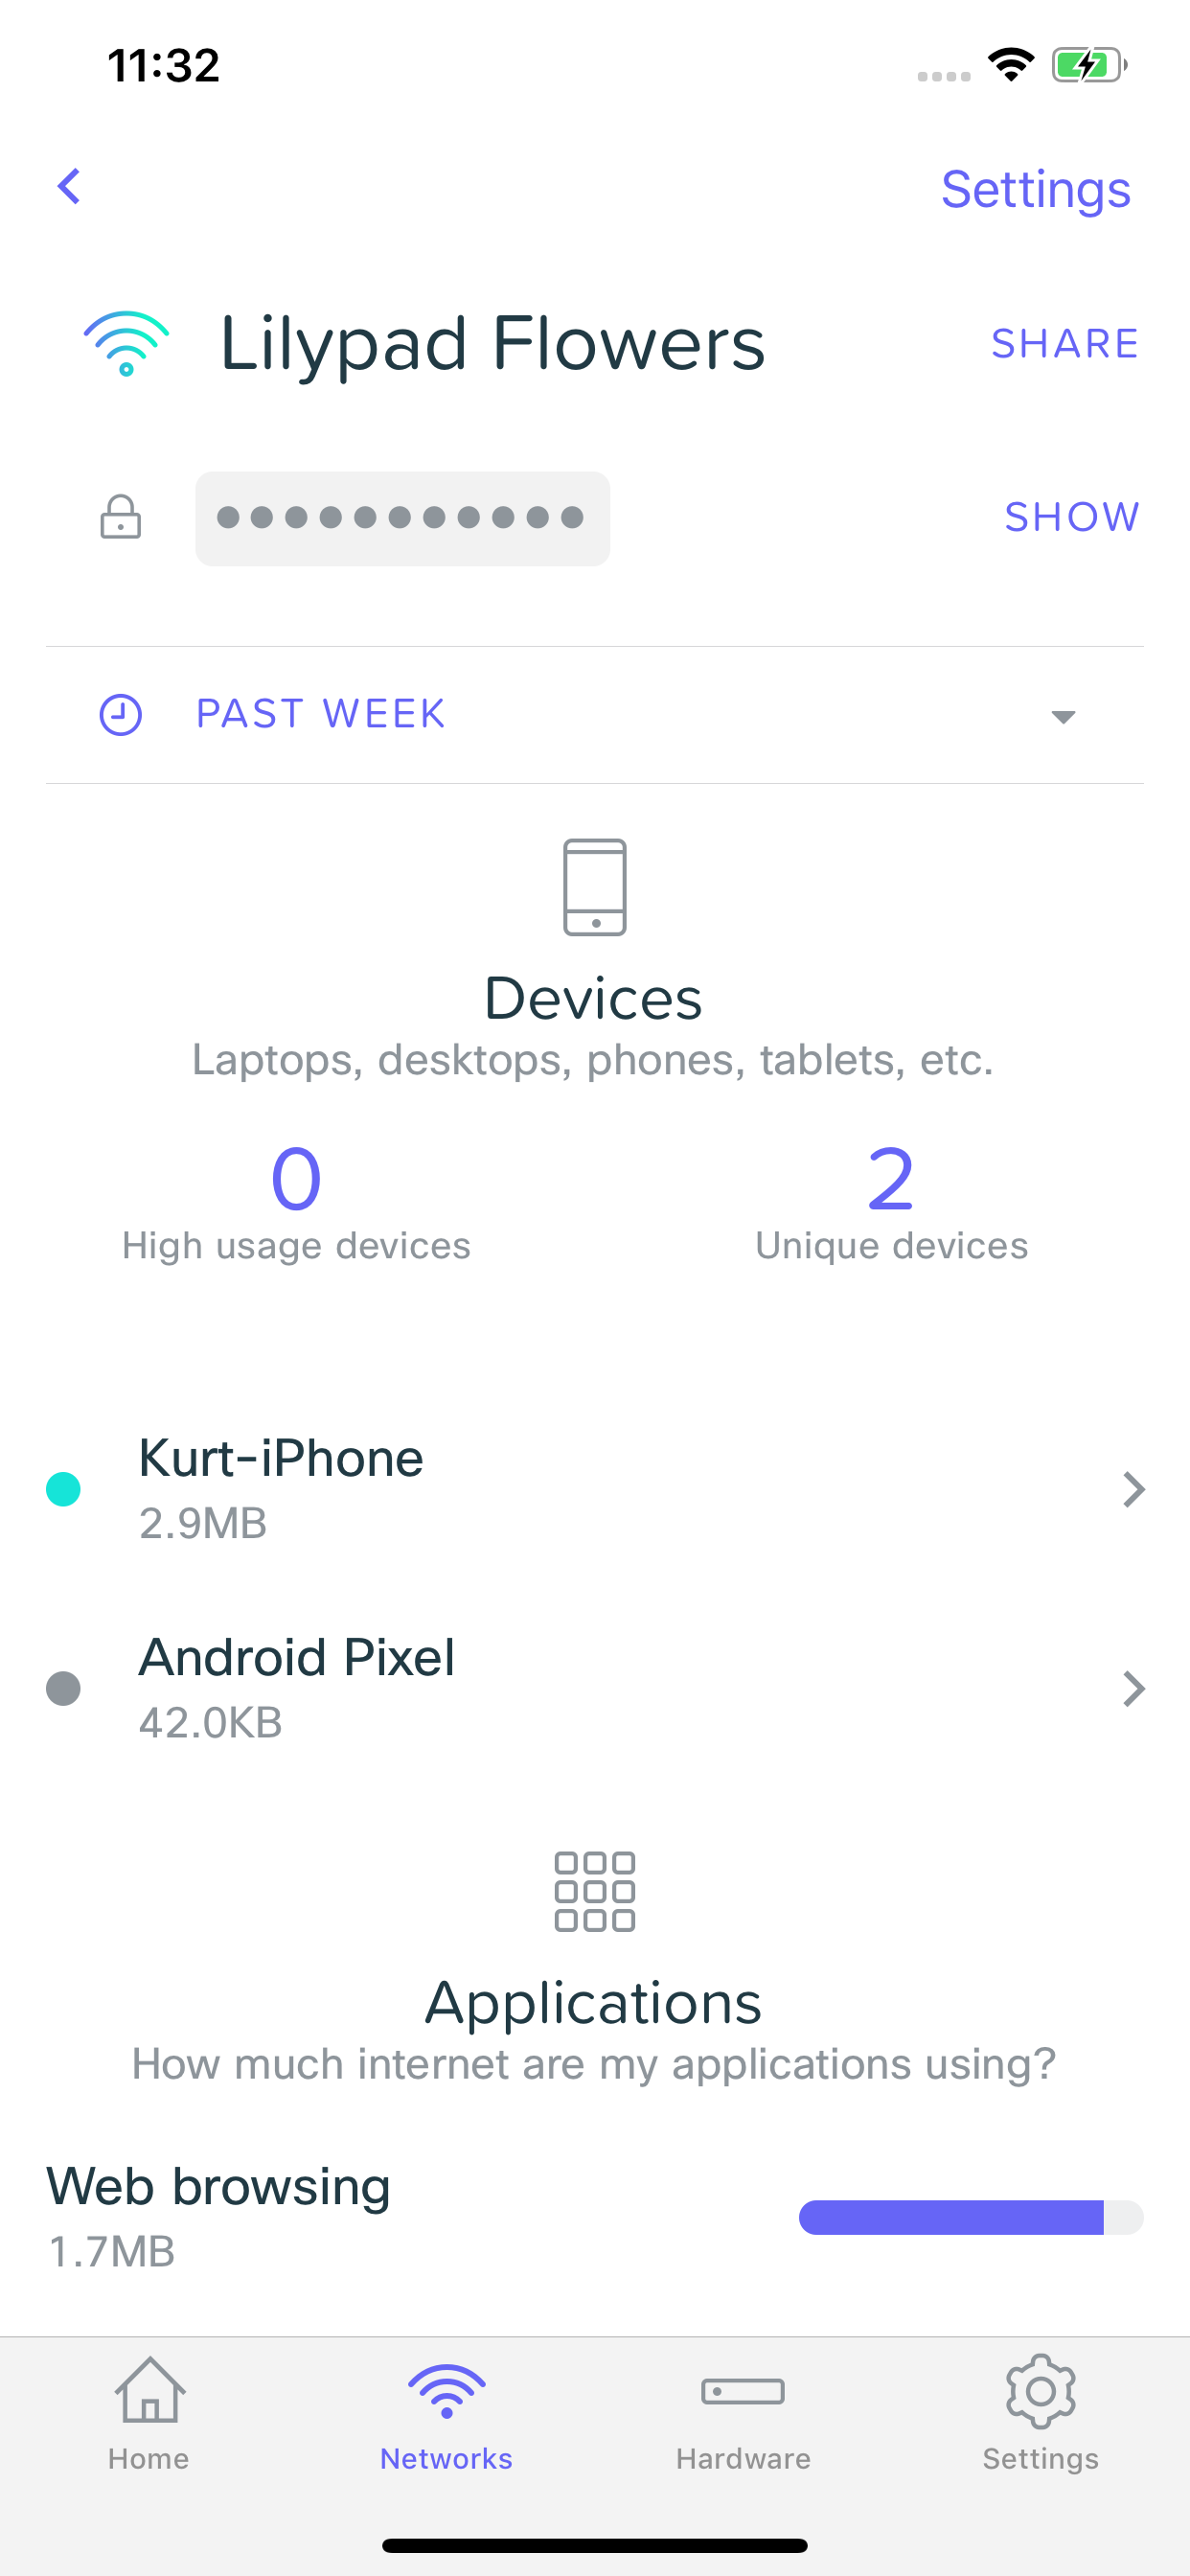
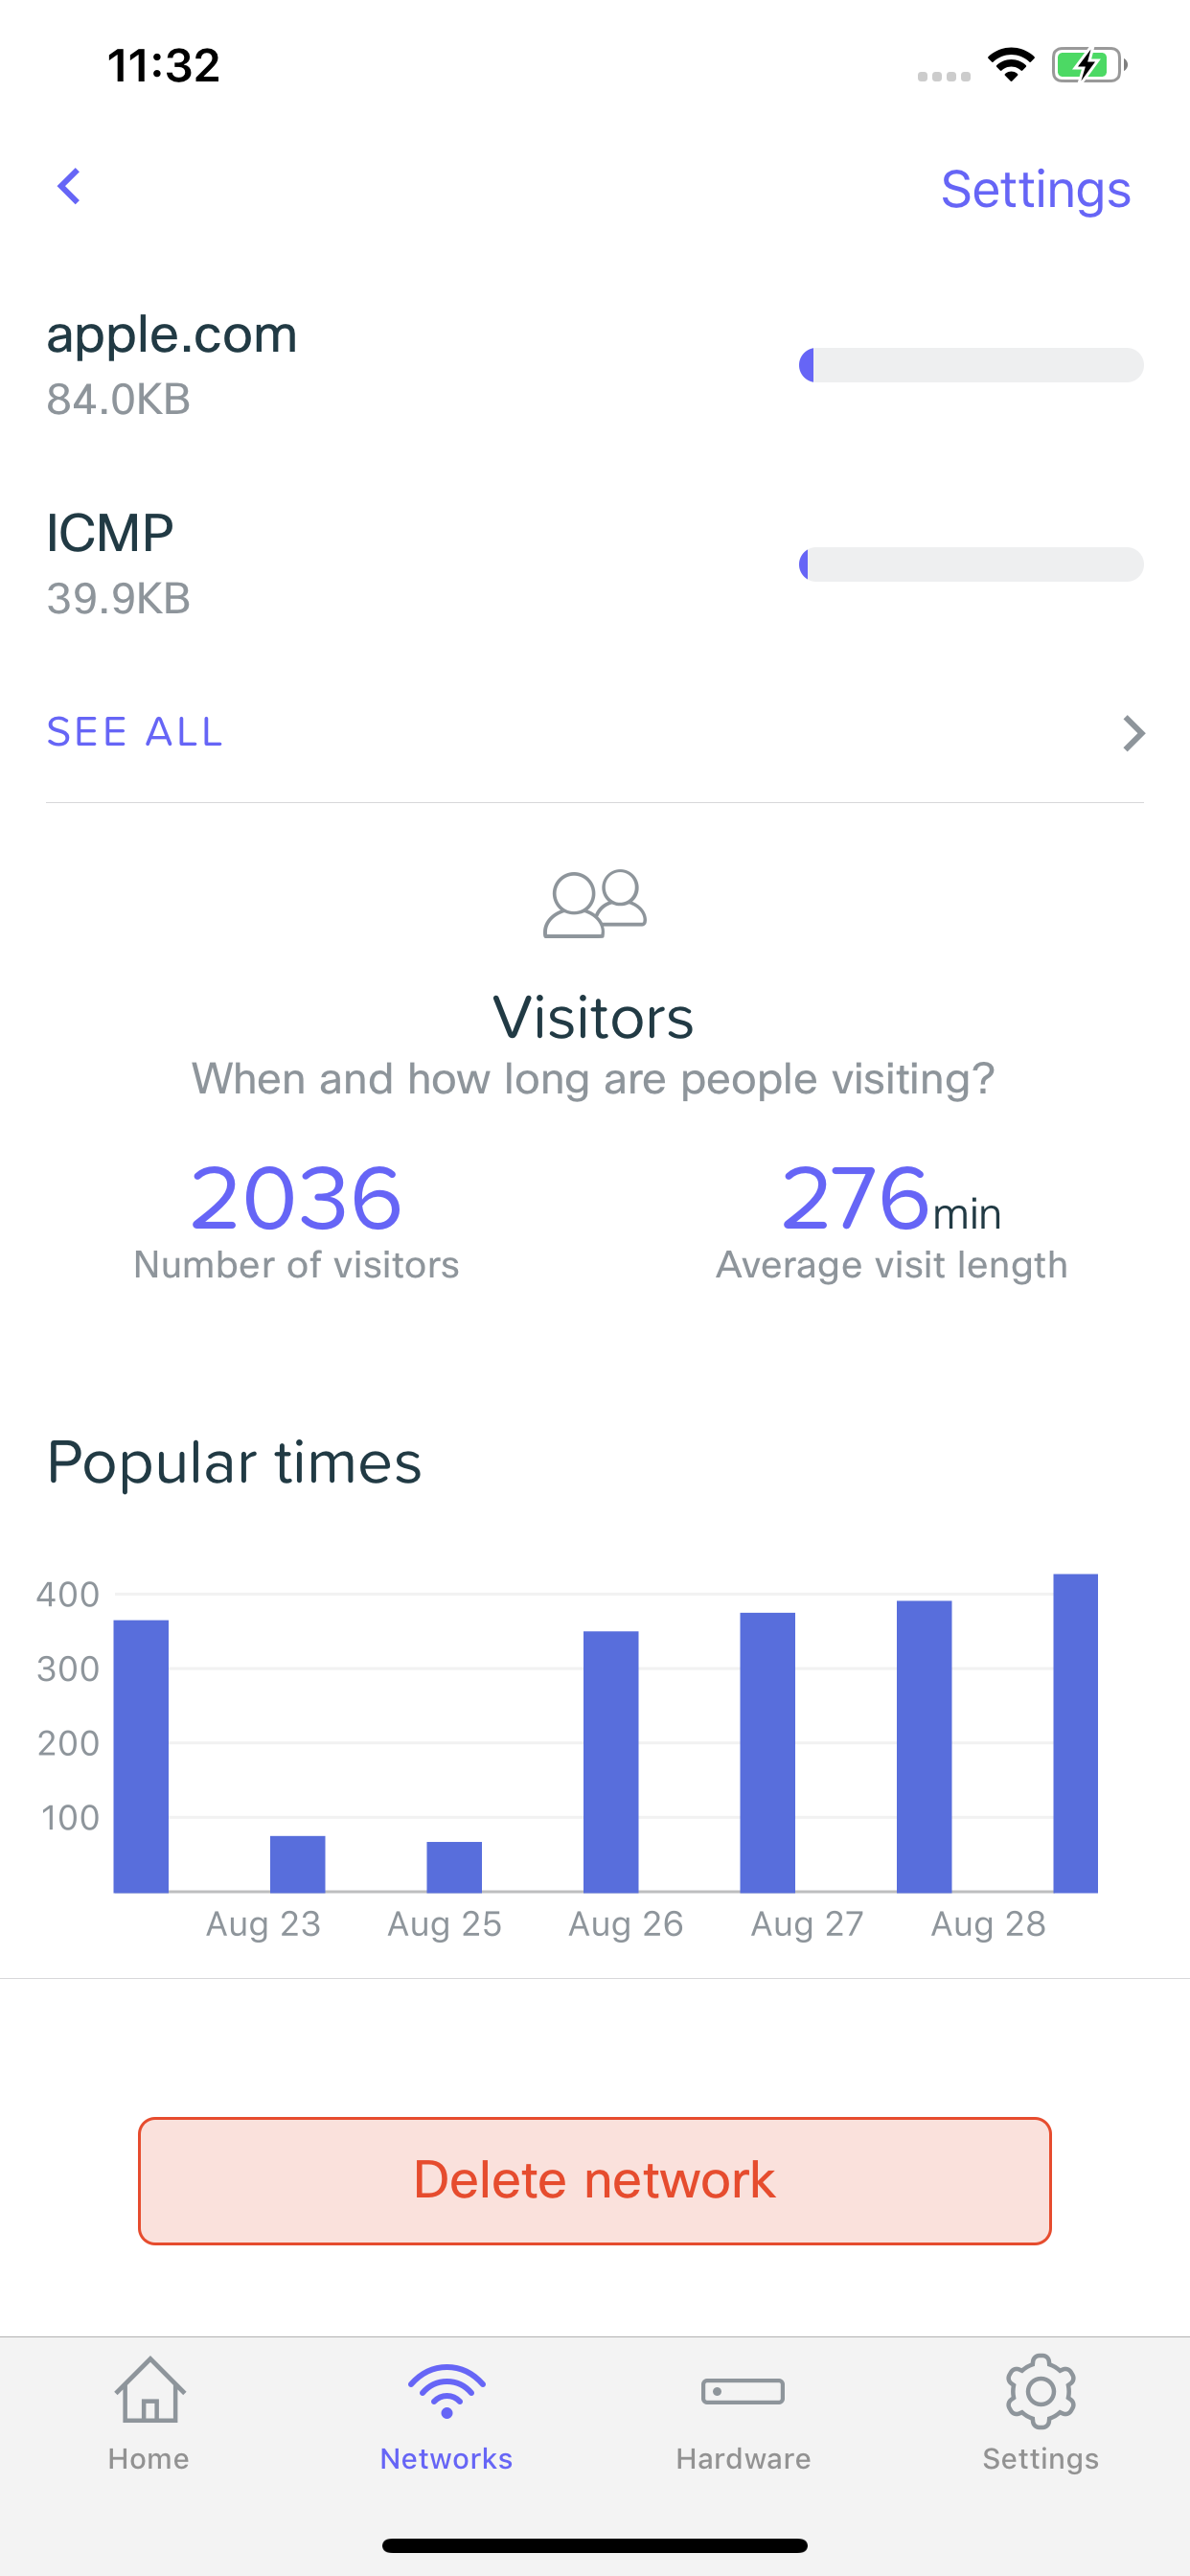
Guest Insights is automatically enabled when you configure a Meraki Go network. You can view them by selecting a network from your list and scrolling to the bottom of the page. From here, you can see basic information such as the number of visitors, average visit length, and popular times based on the time frame selected at the top of the page. Selecting either of the metrics or the graph will allow you to see additional information.
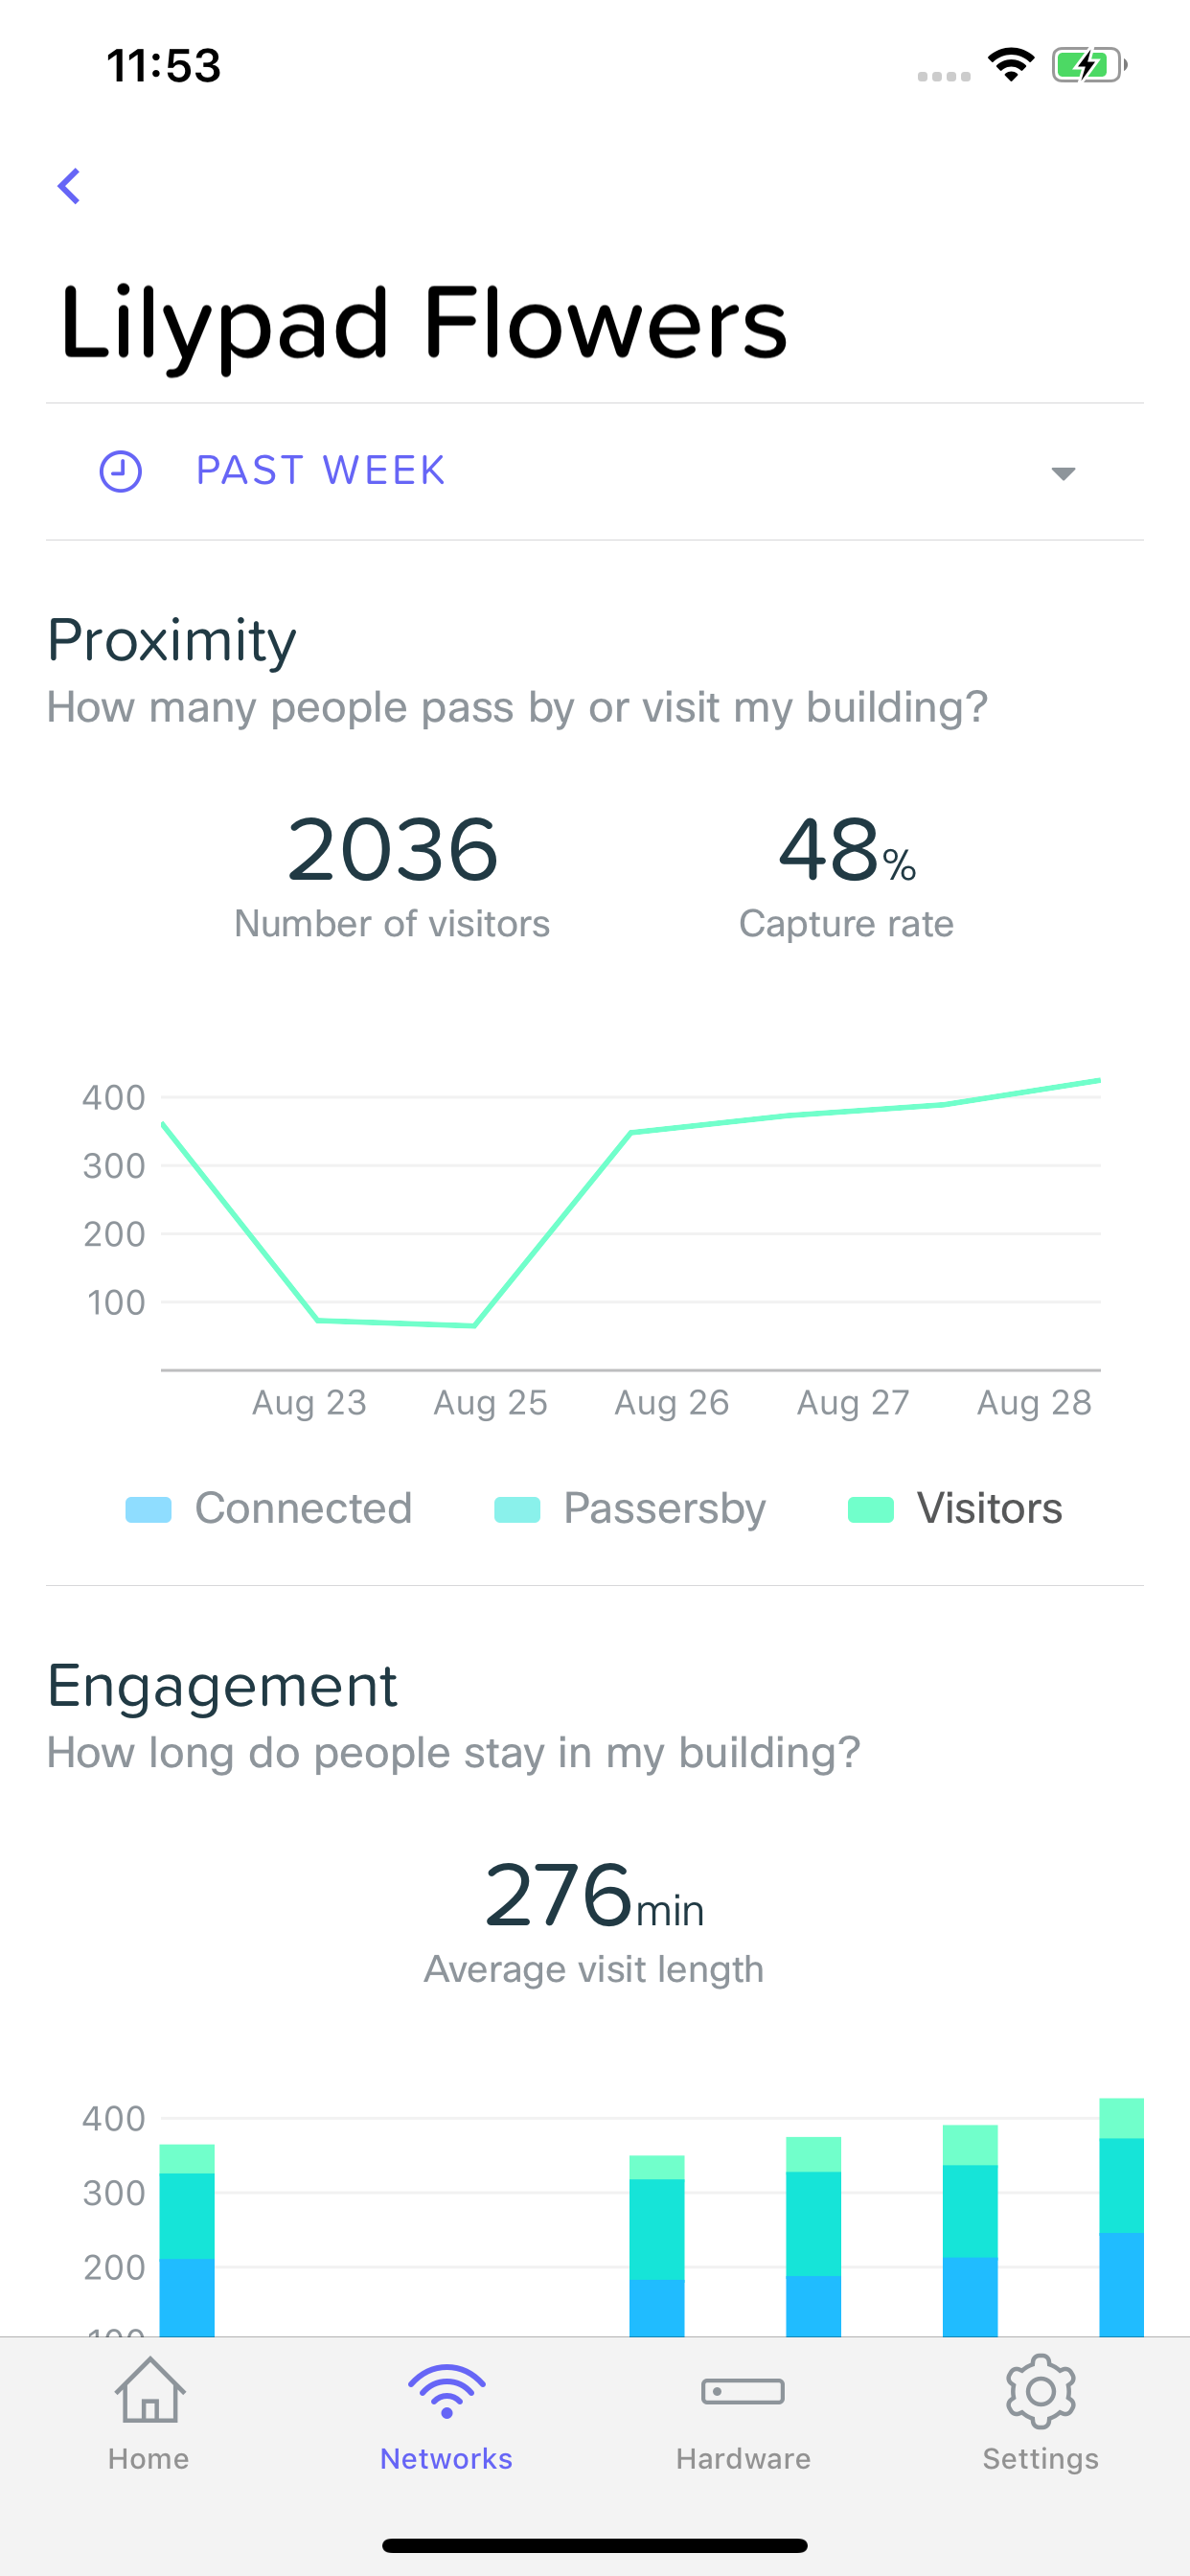
Proximity
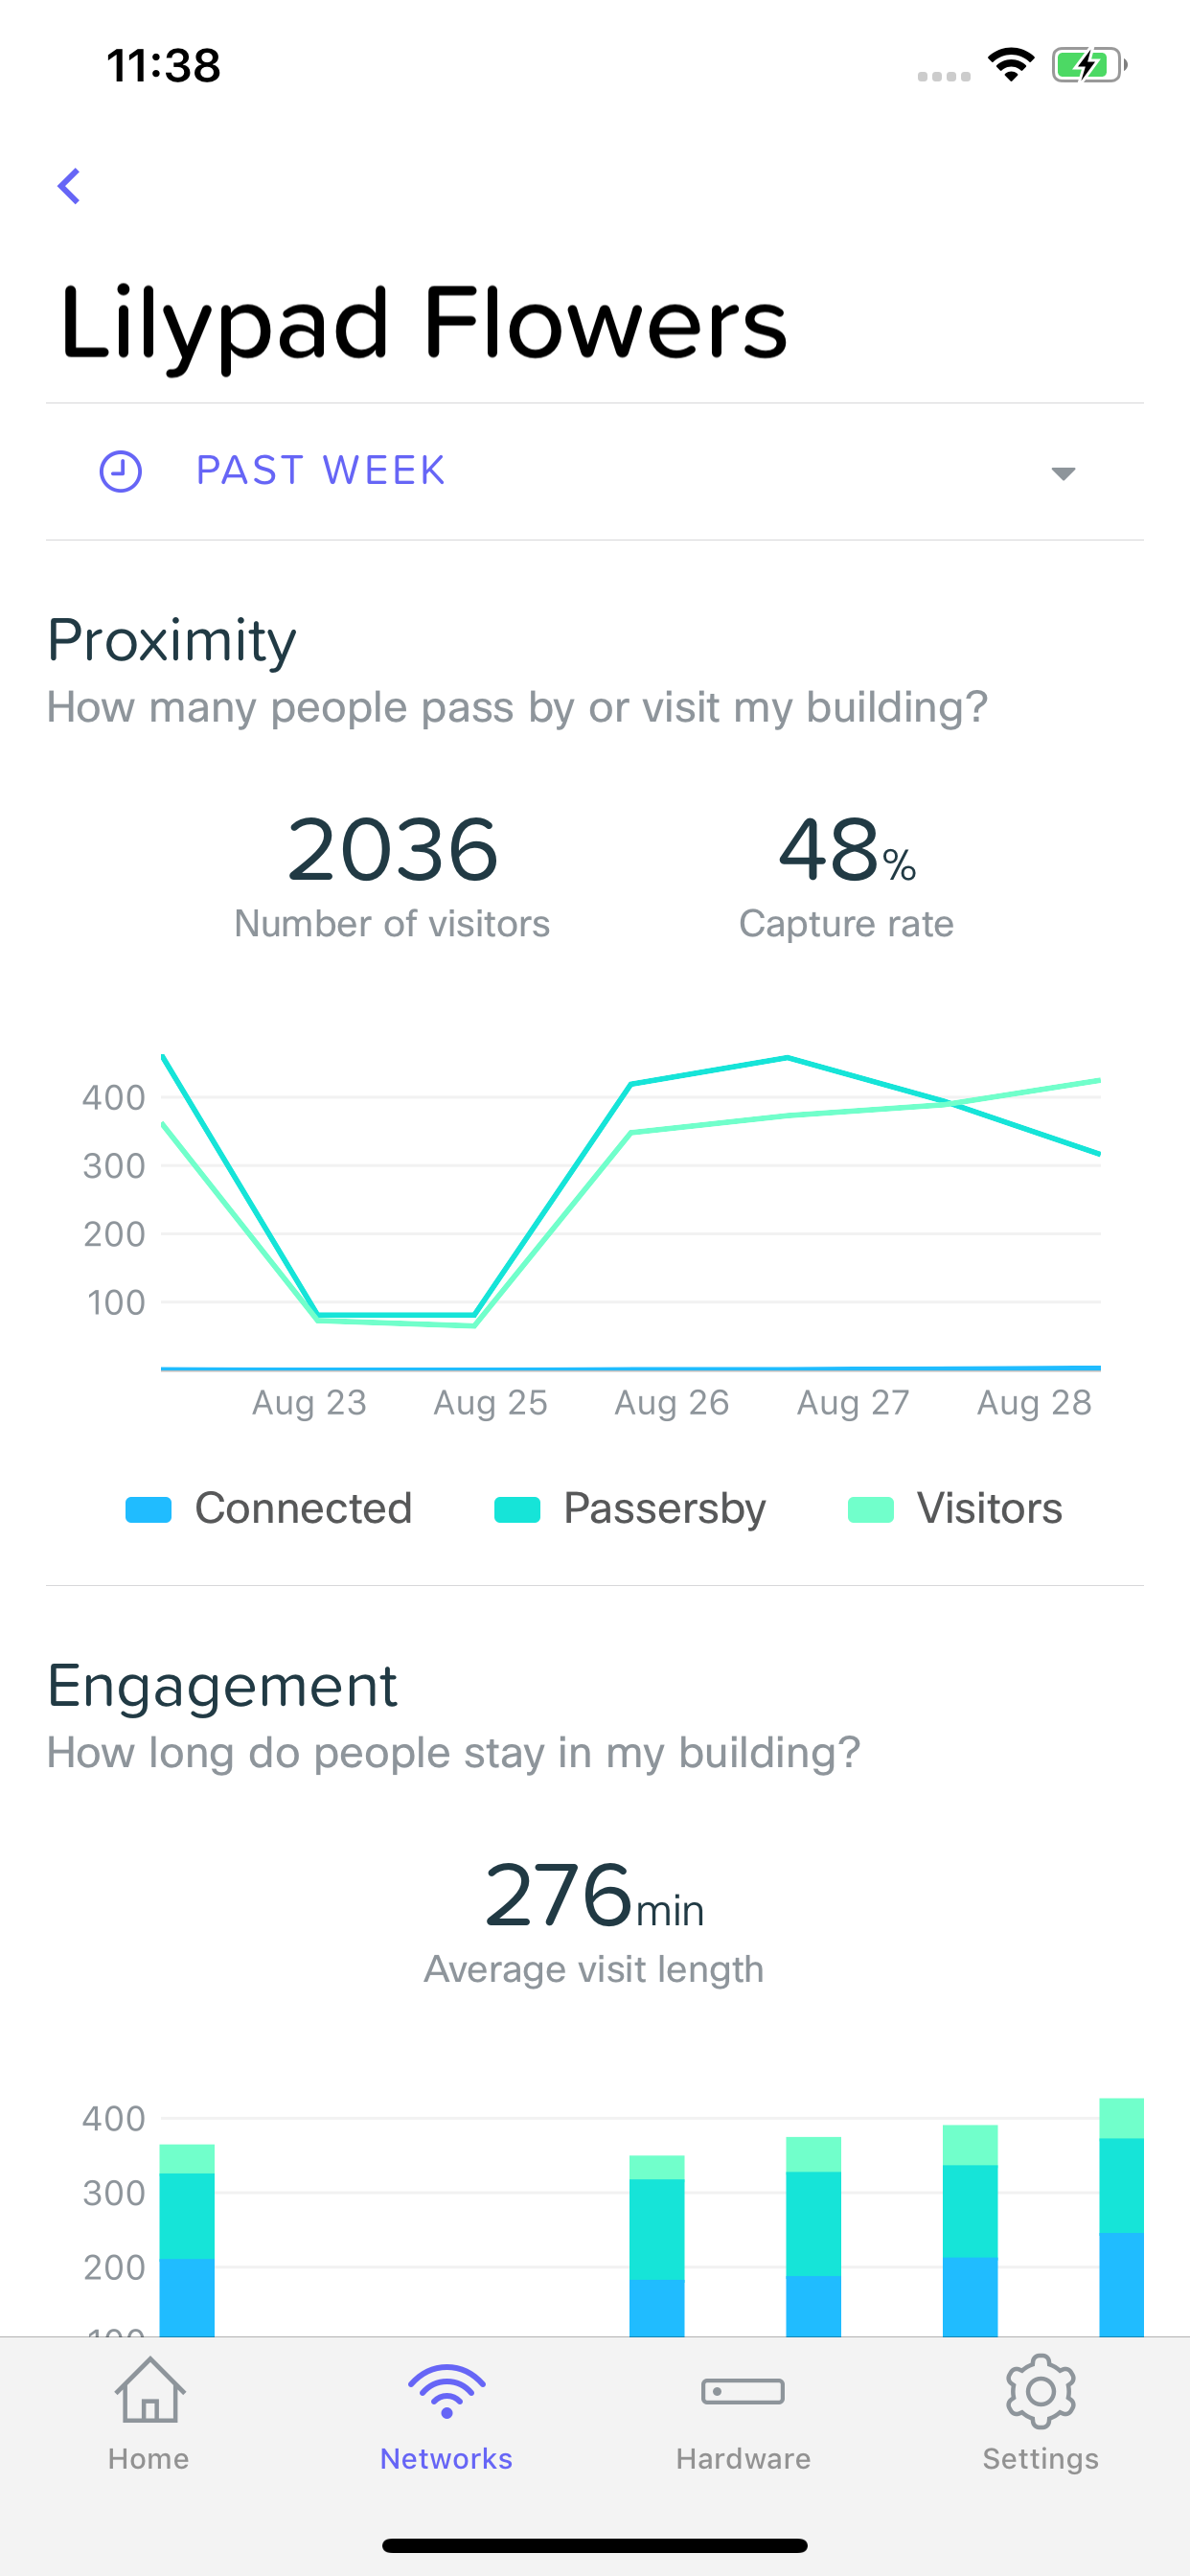
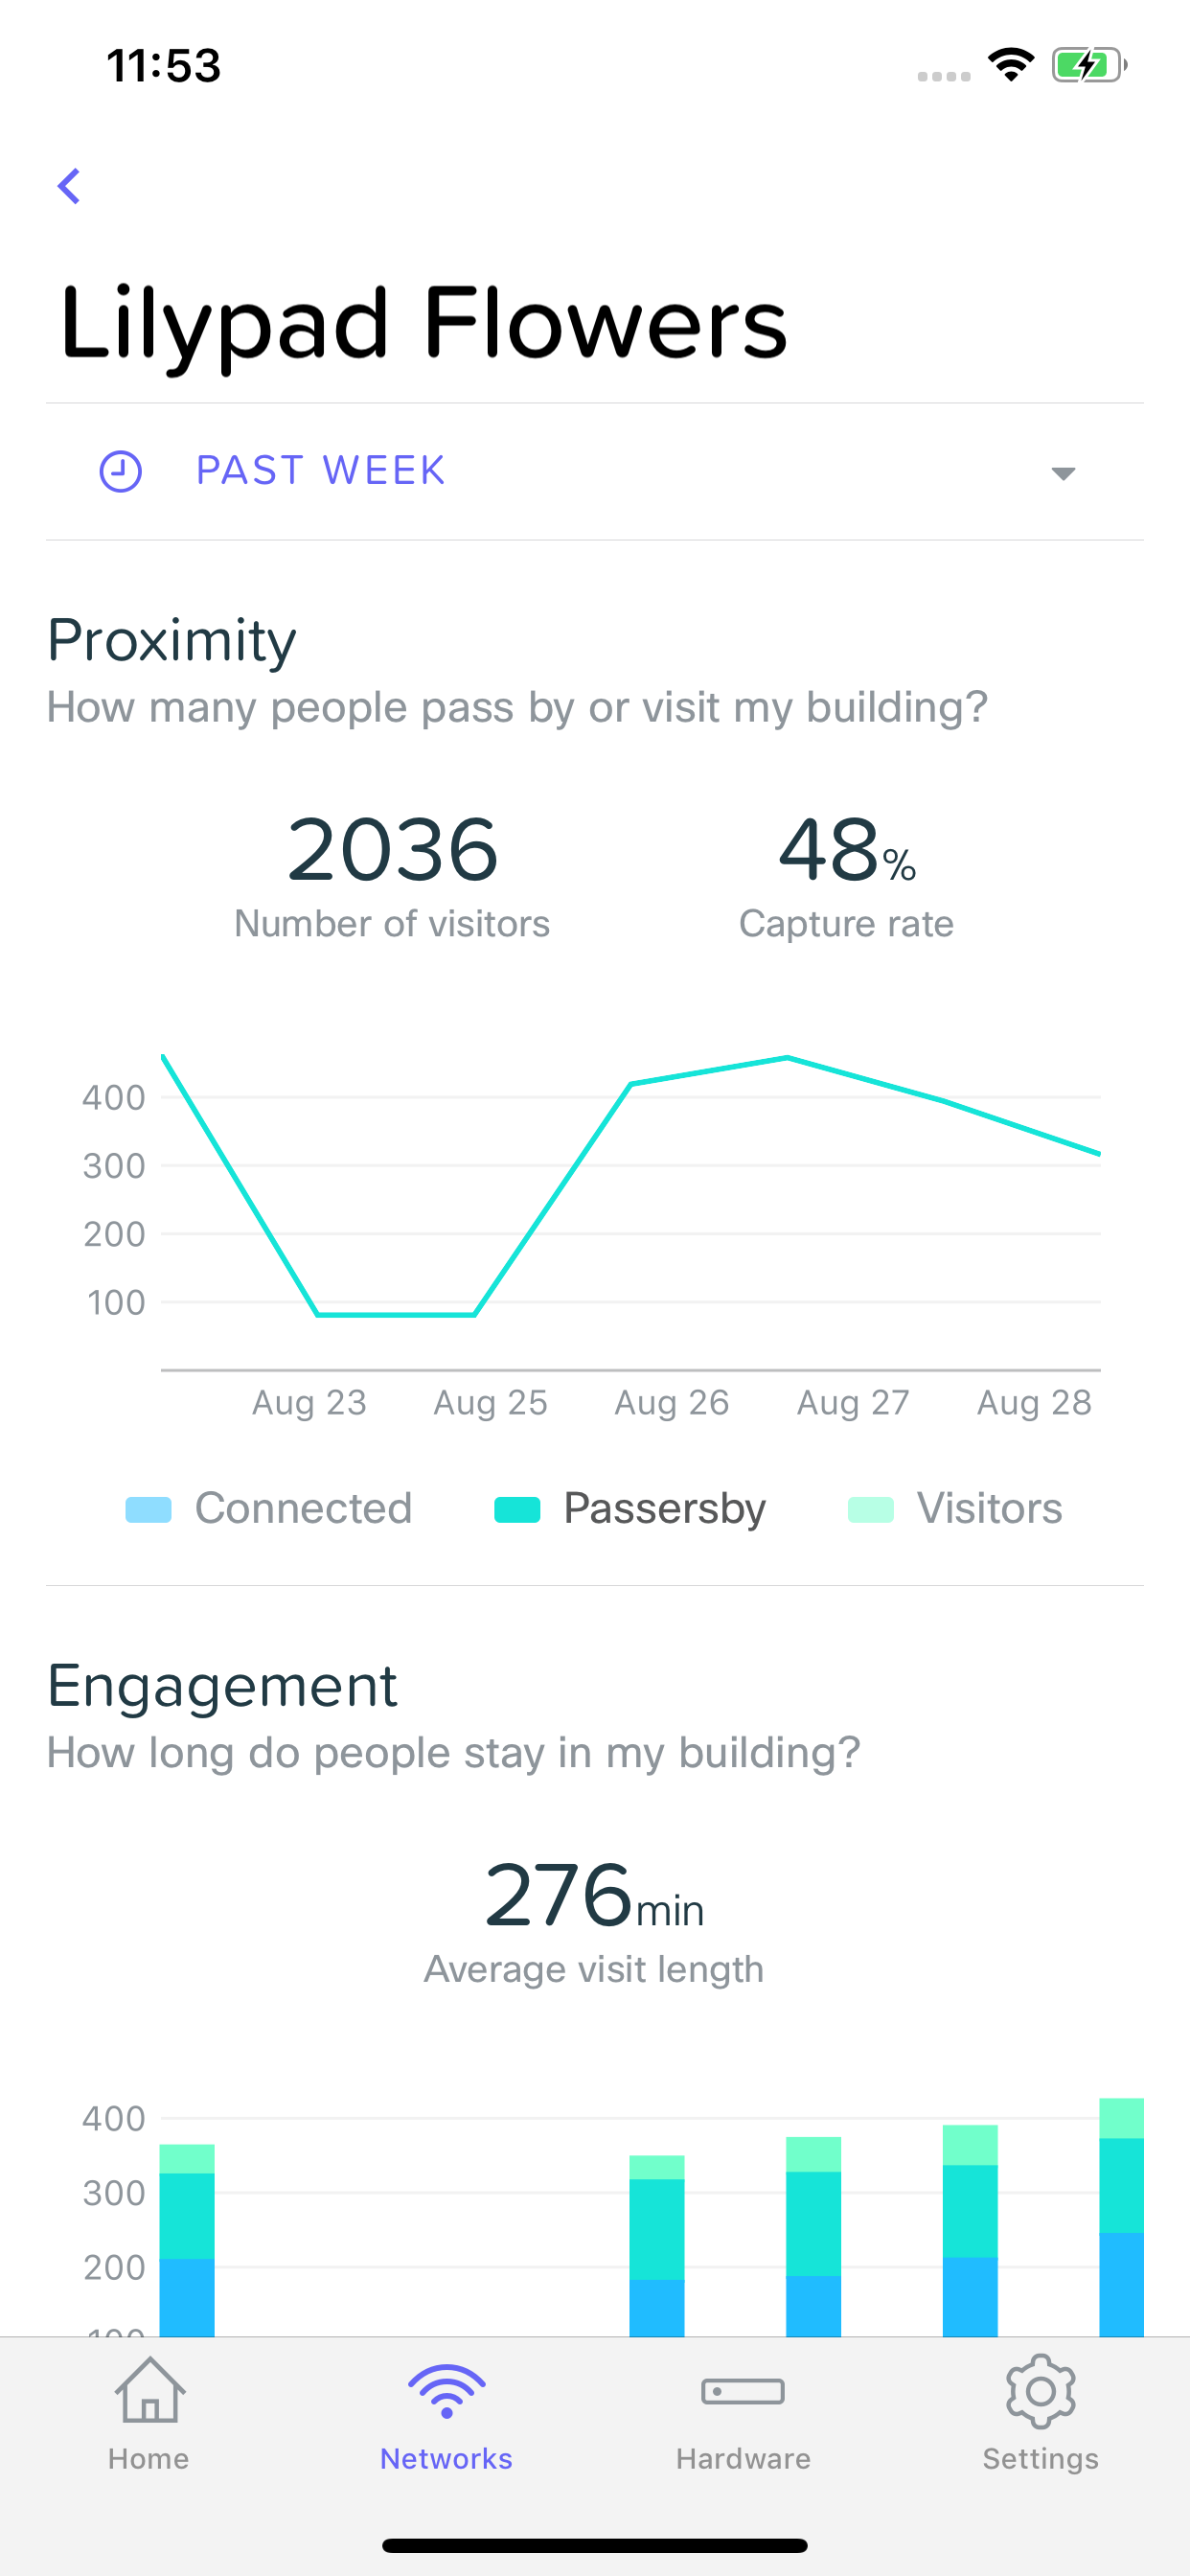
Visitor Insights allows you understand information about how many people have passed by and visited your business. The Proximity section breaks down this information into three categories (listed below). Clicking on any combination of these categories will filter the data shown on the graph.
Connected
These are users who pass by and connect to the network you are currently looking at.
Passerby
These are users who pass by, do not connect, and do not dwell long enough to be classified as a visitor.
Visitors
These are users who pass by, do not connect, but are near your business for five minutes or longer.
 .
.
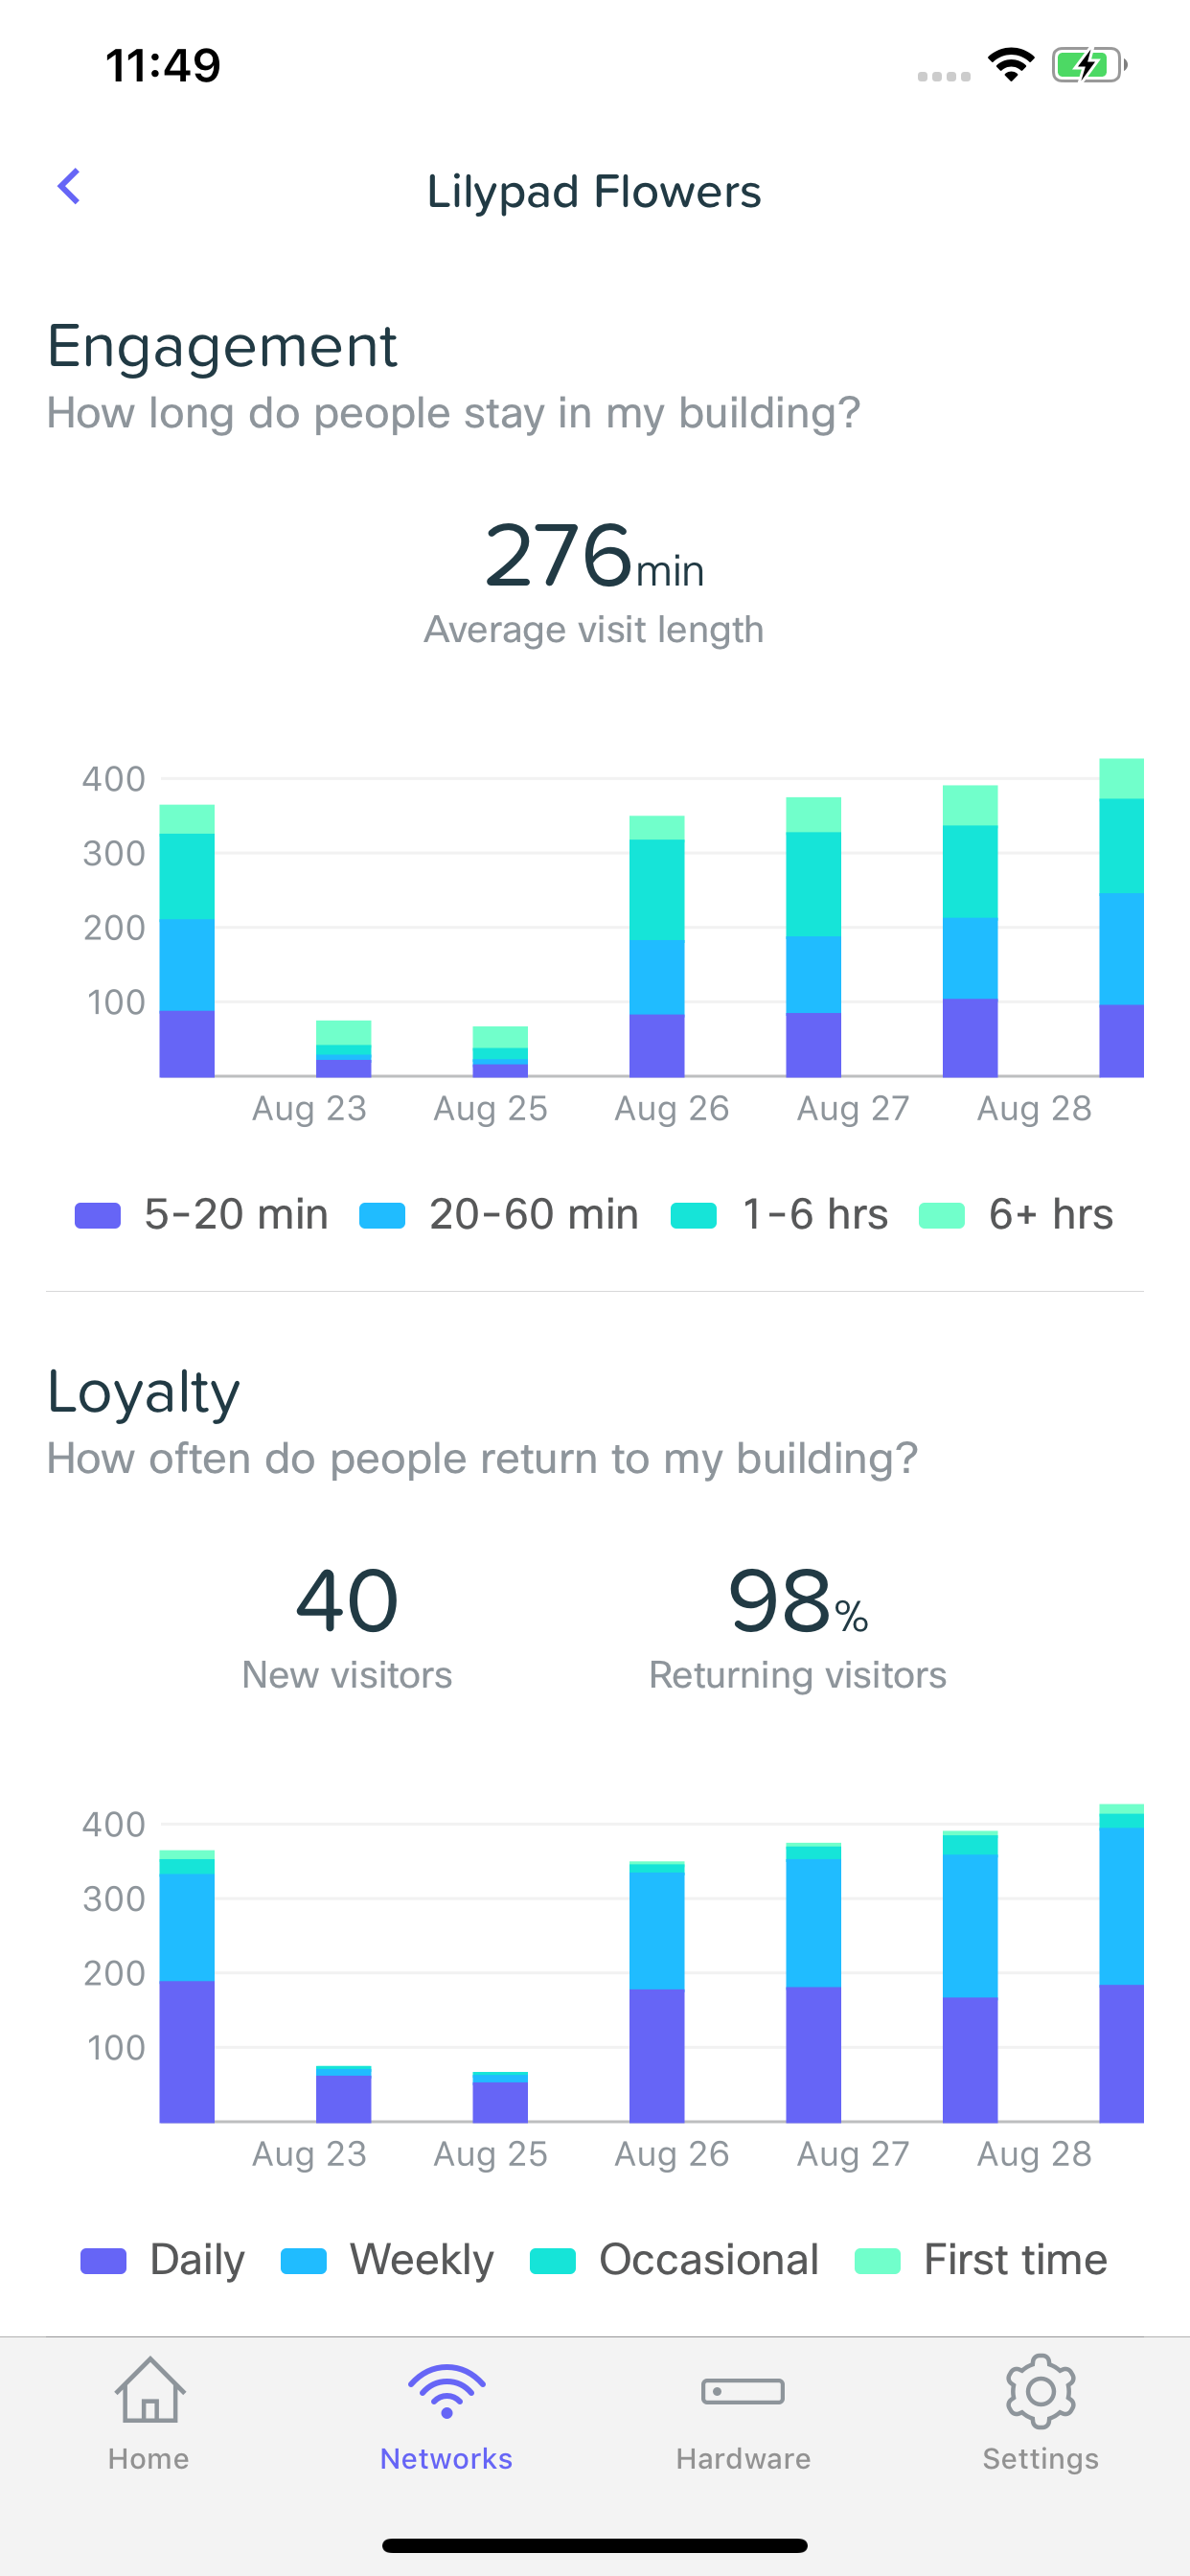
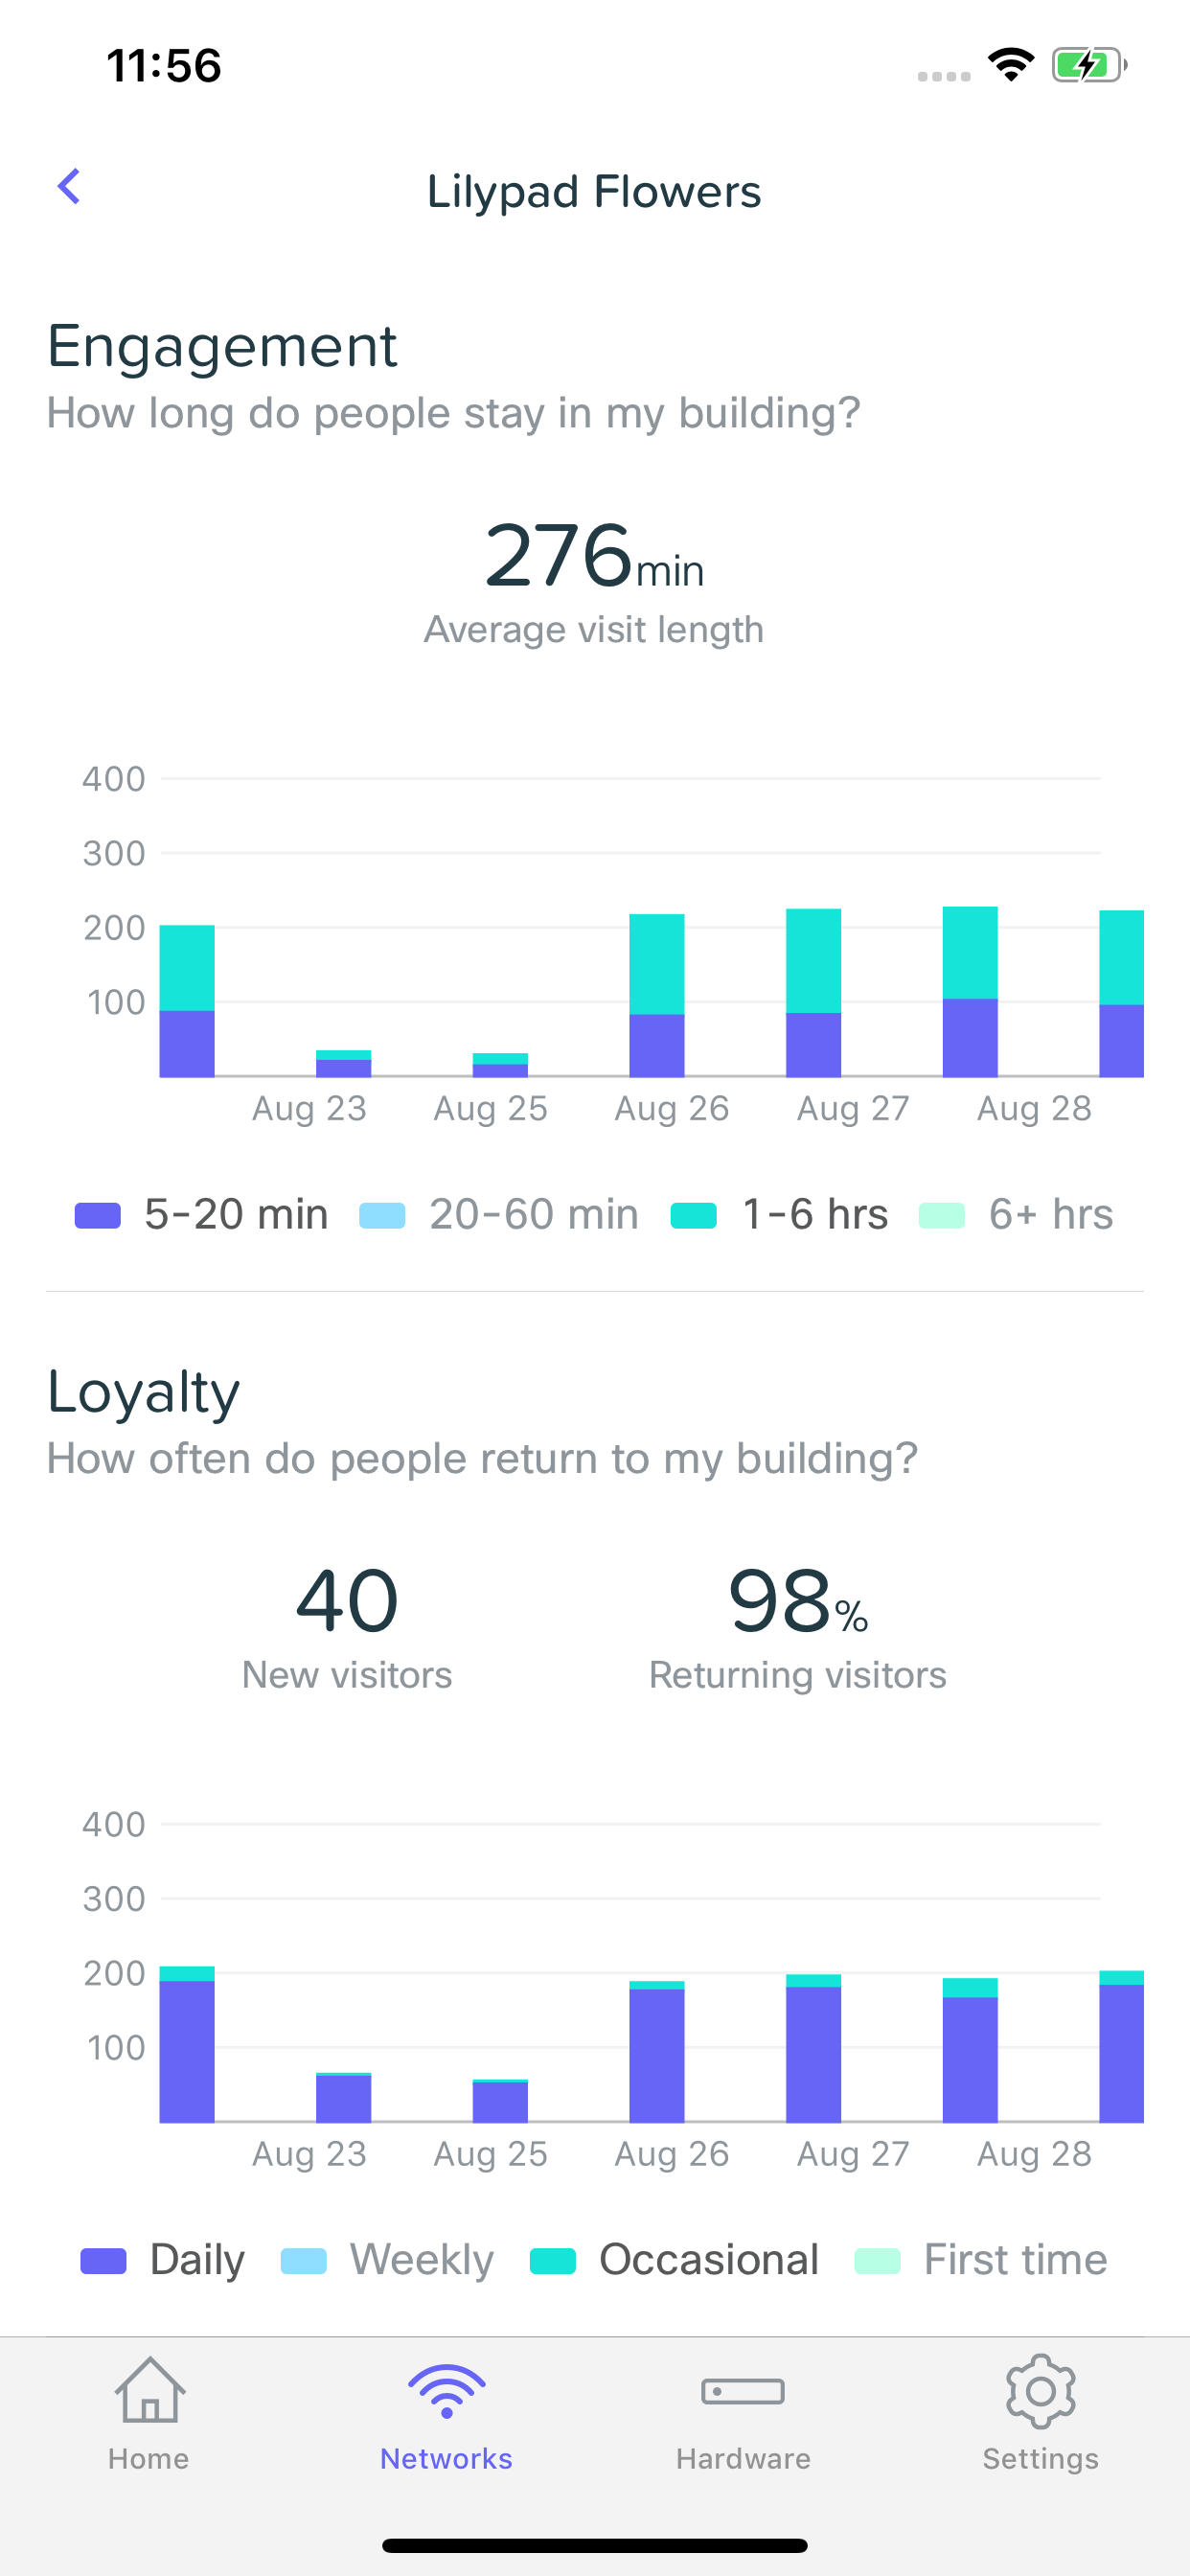
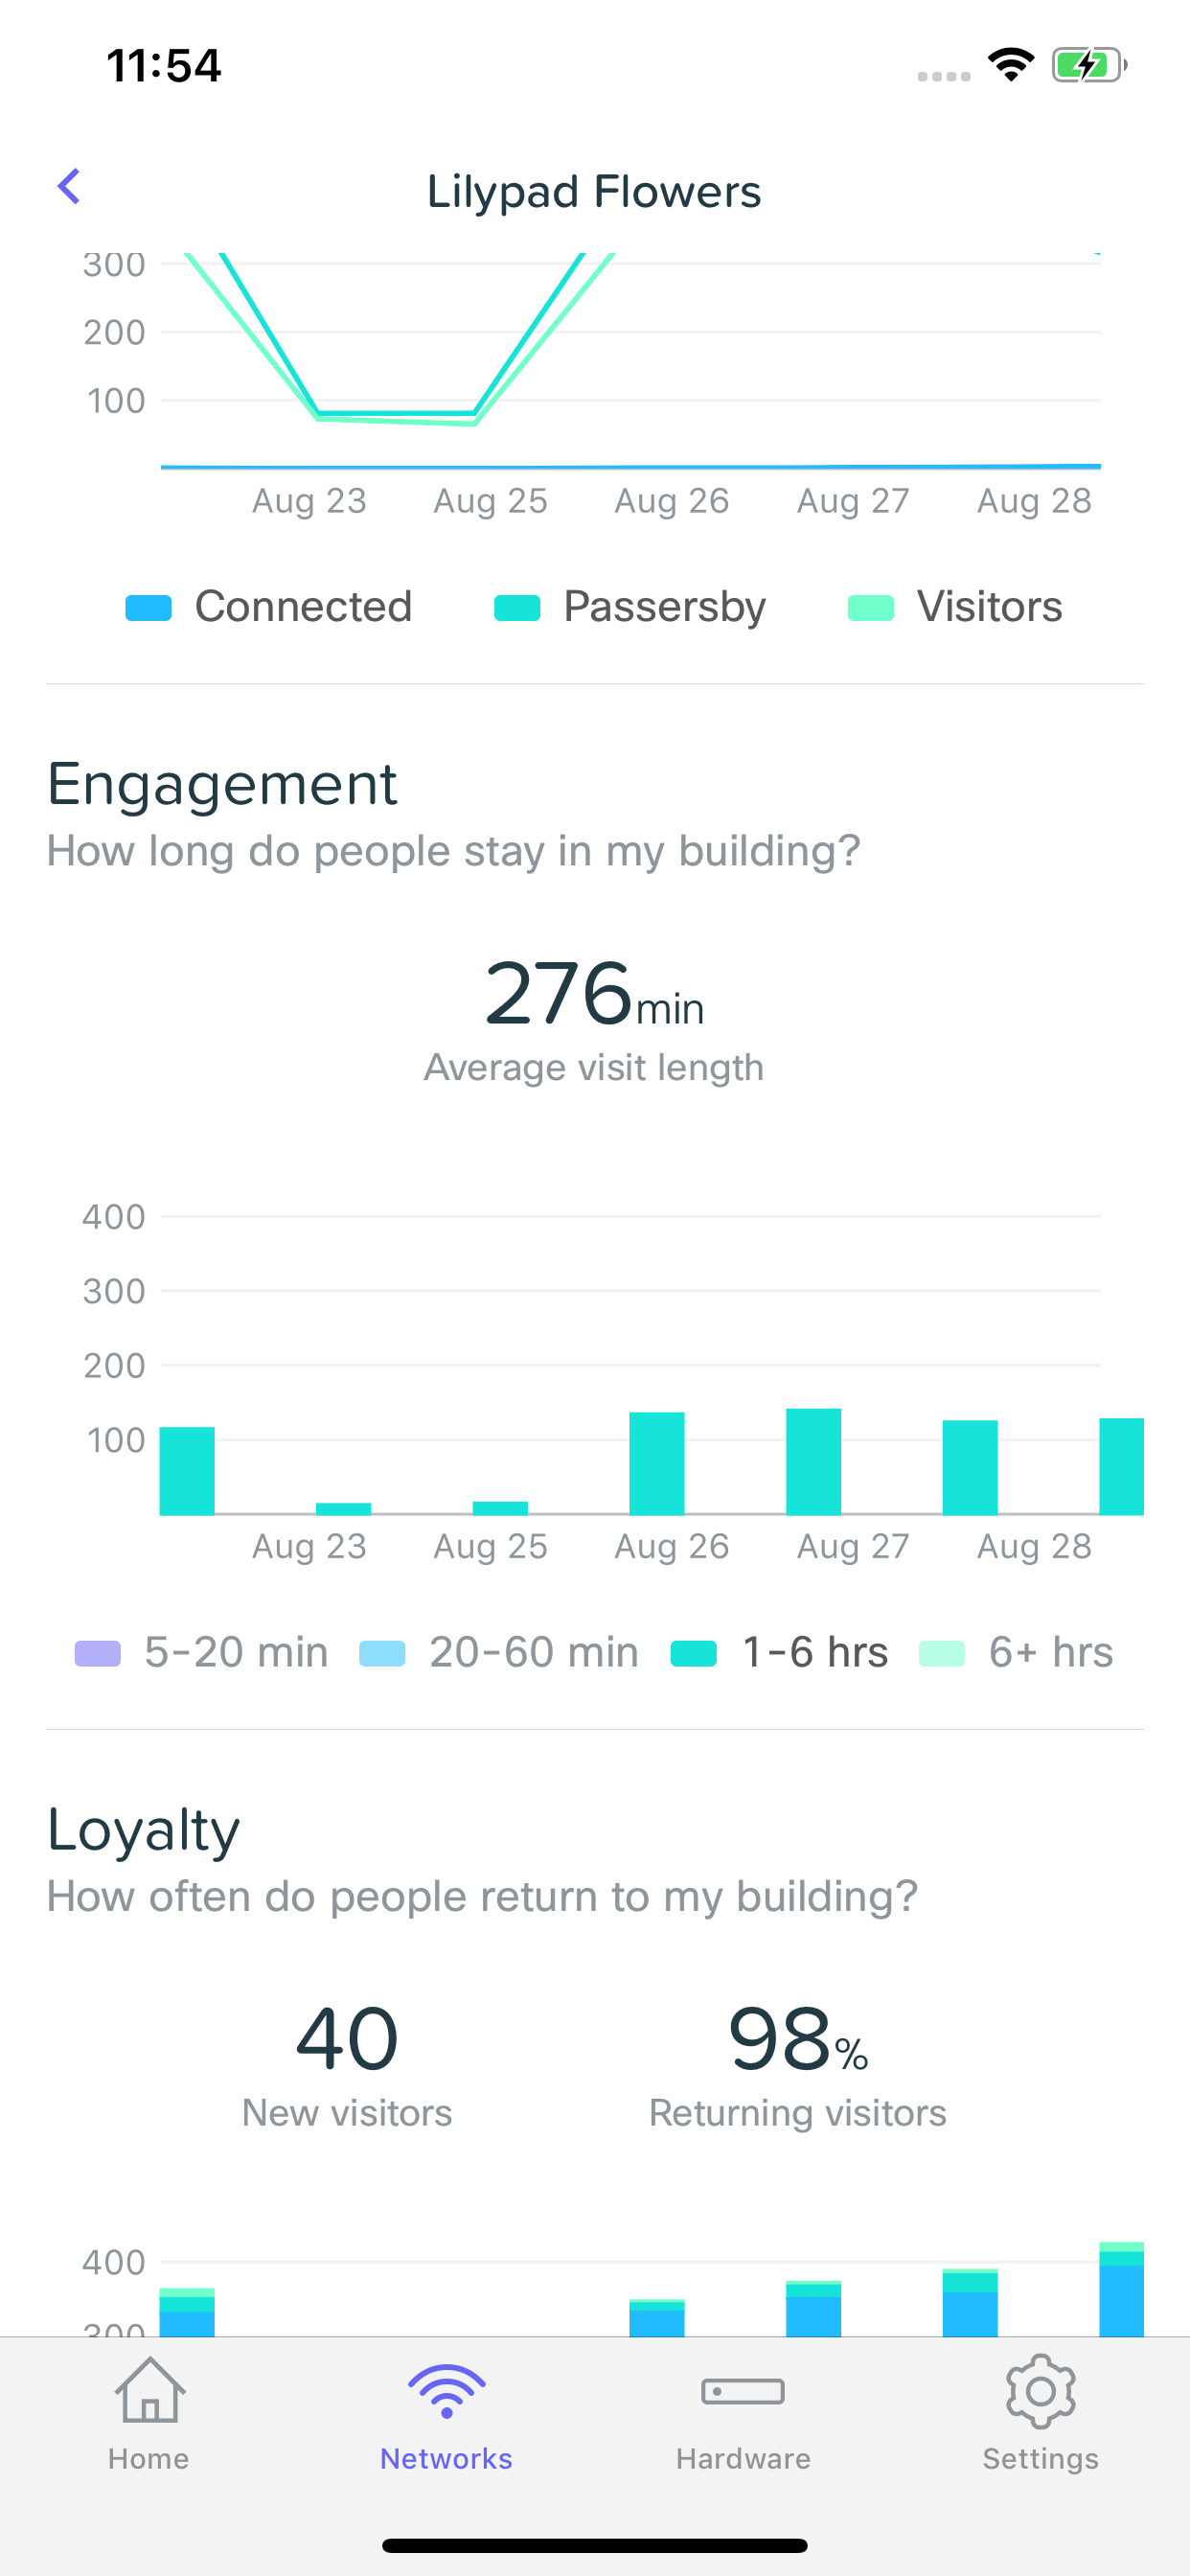
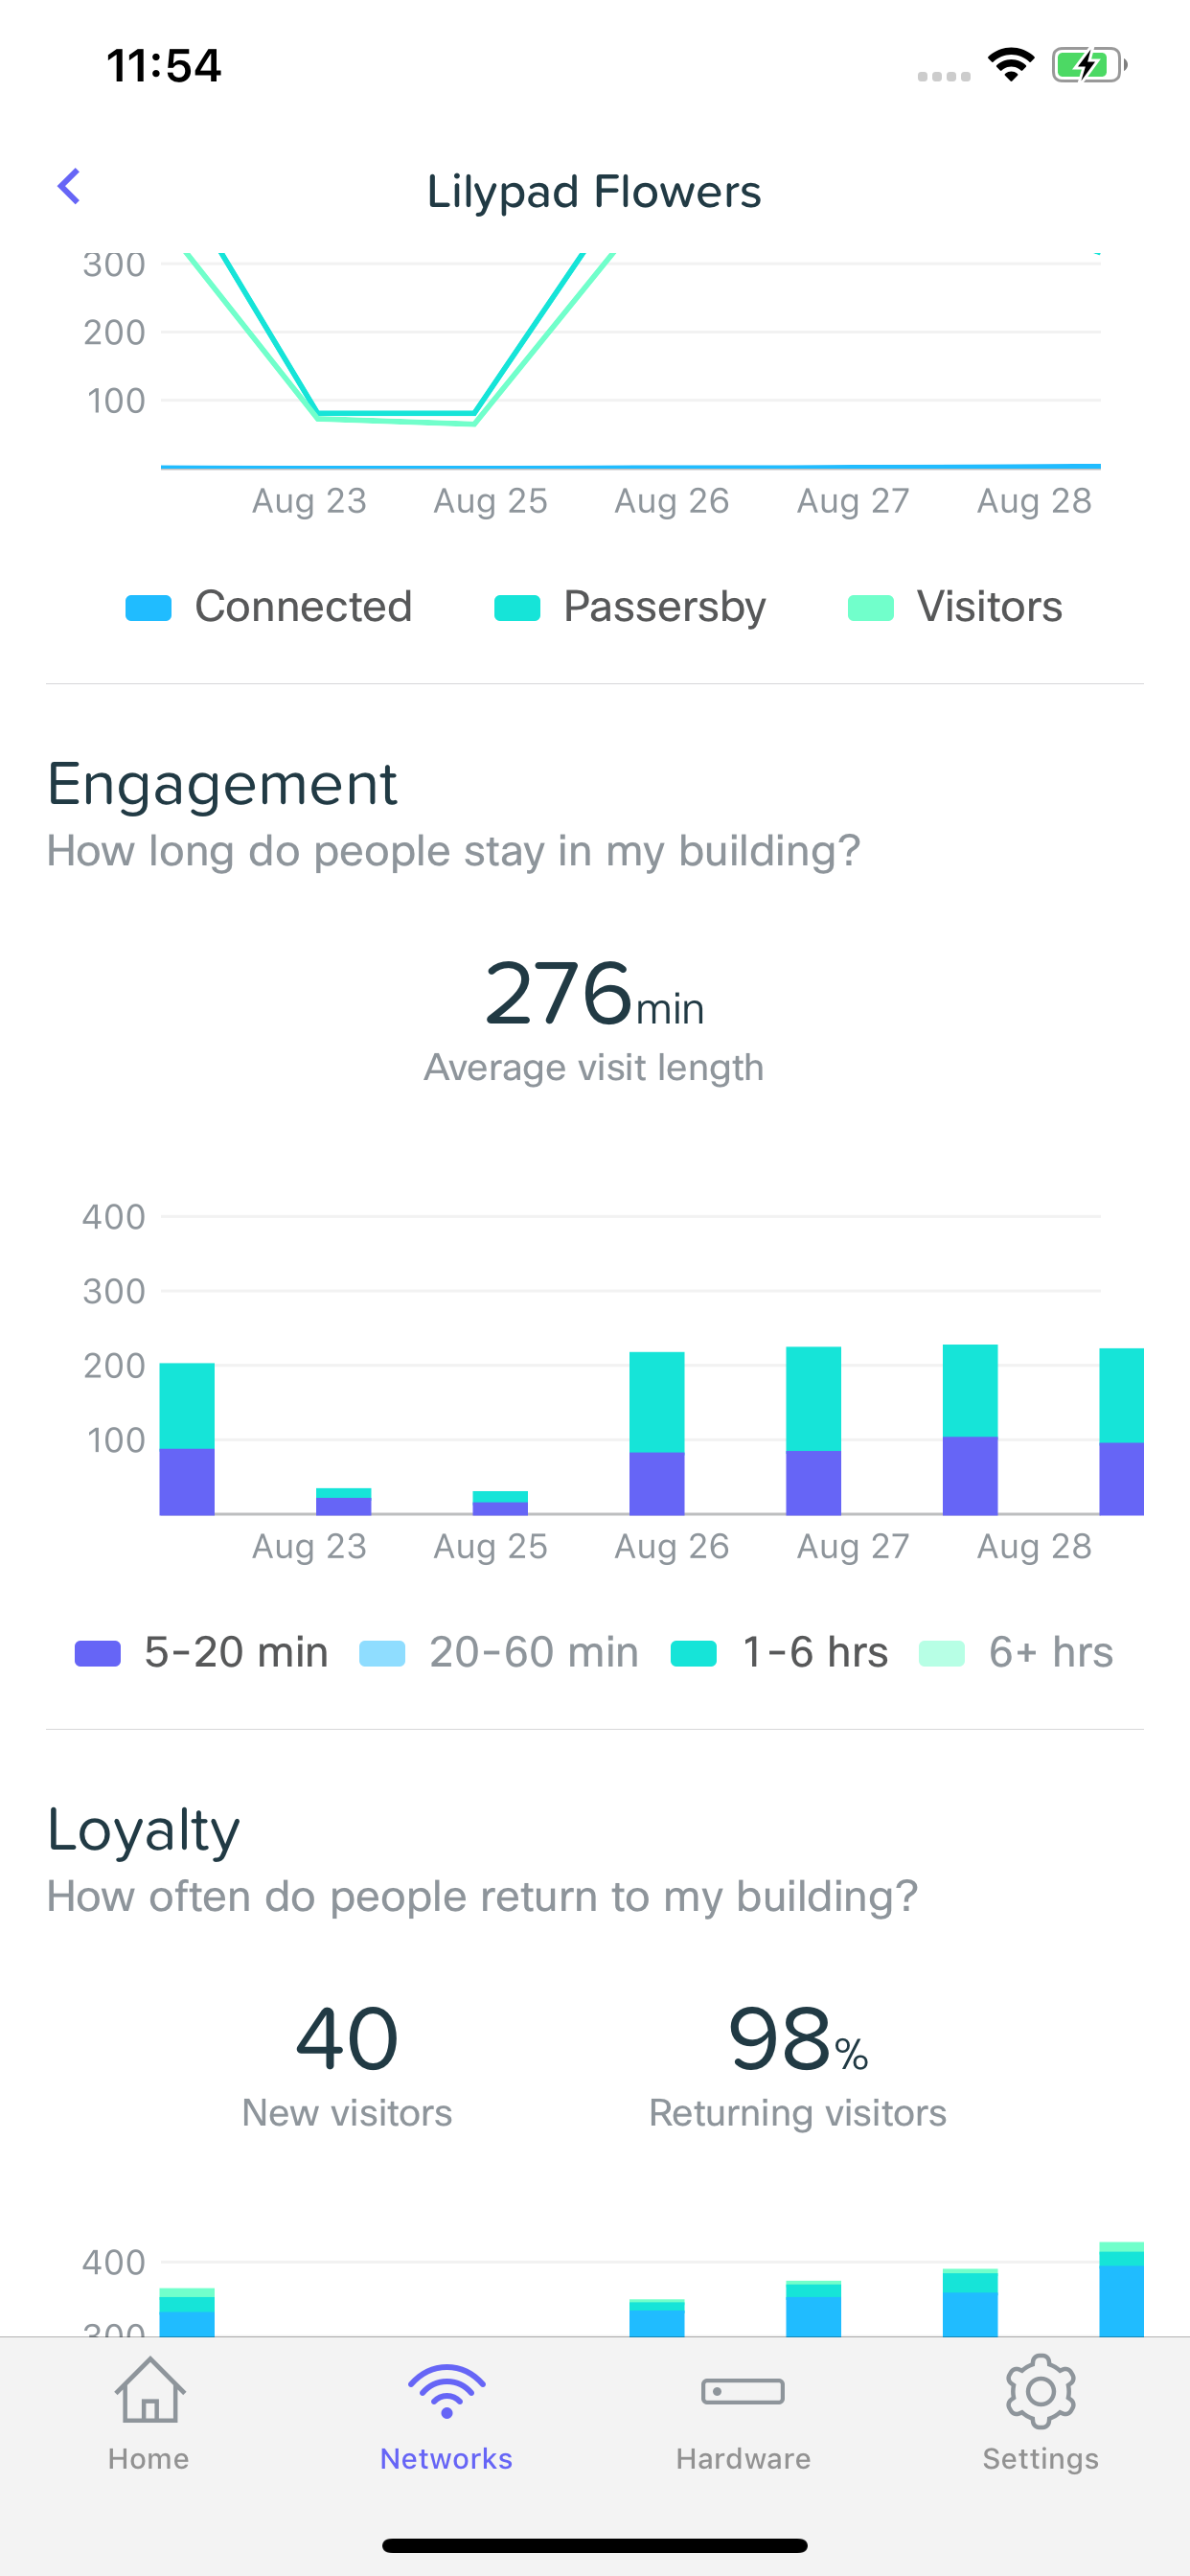
Engagement
The engagement section of Visitor Insights allows you to understand how long users are staying in your building. Selecting any combination of the time frames shown will filter the data shown on the graph.
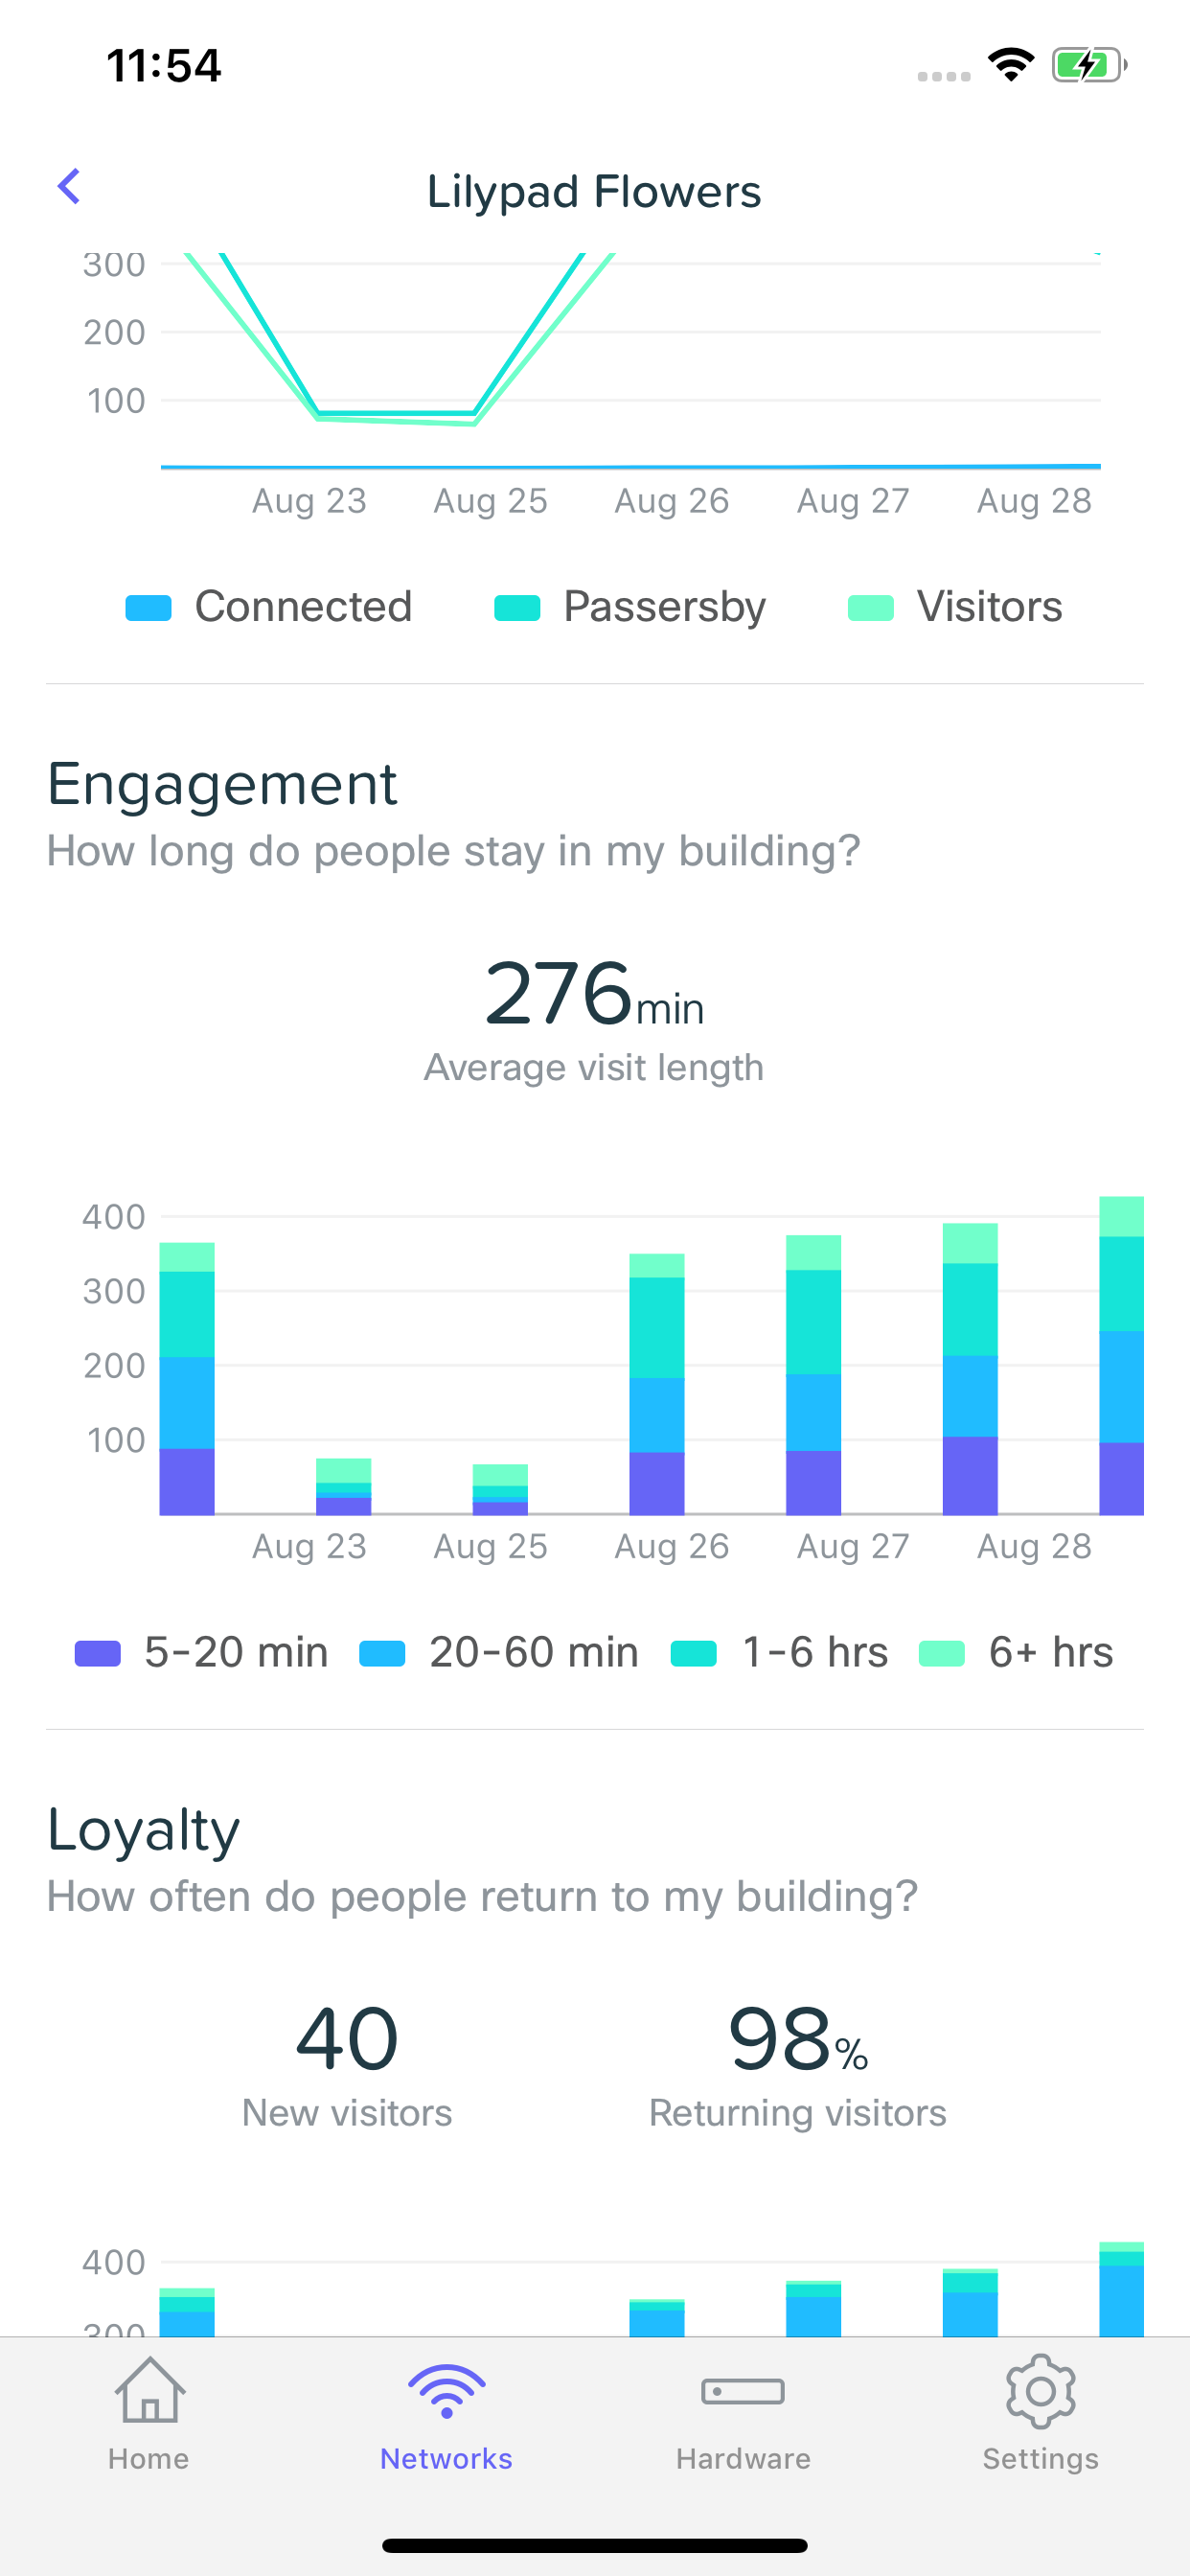
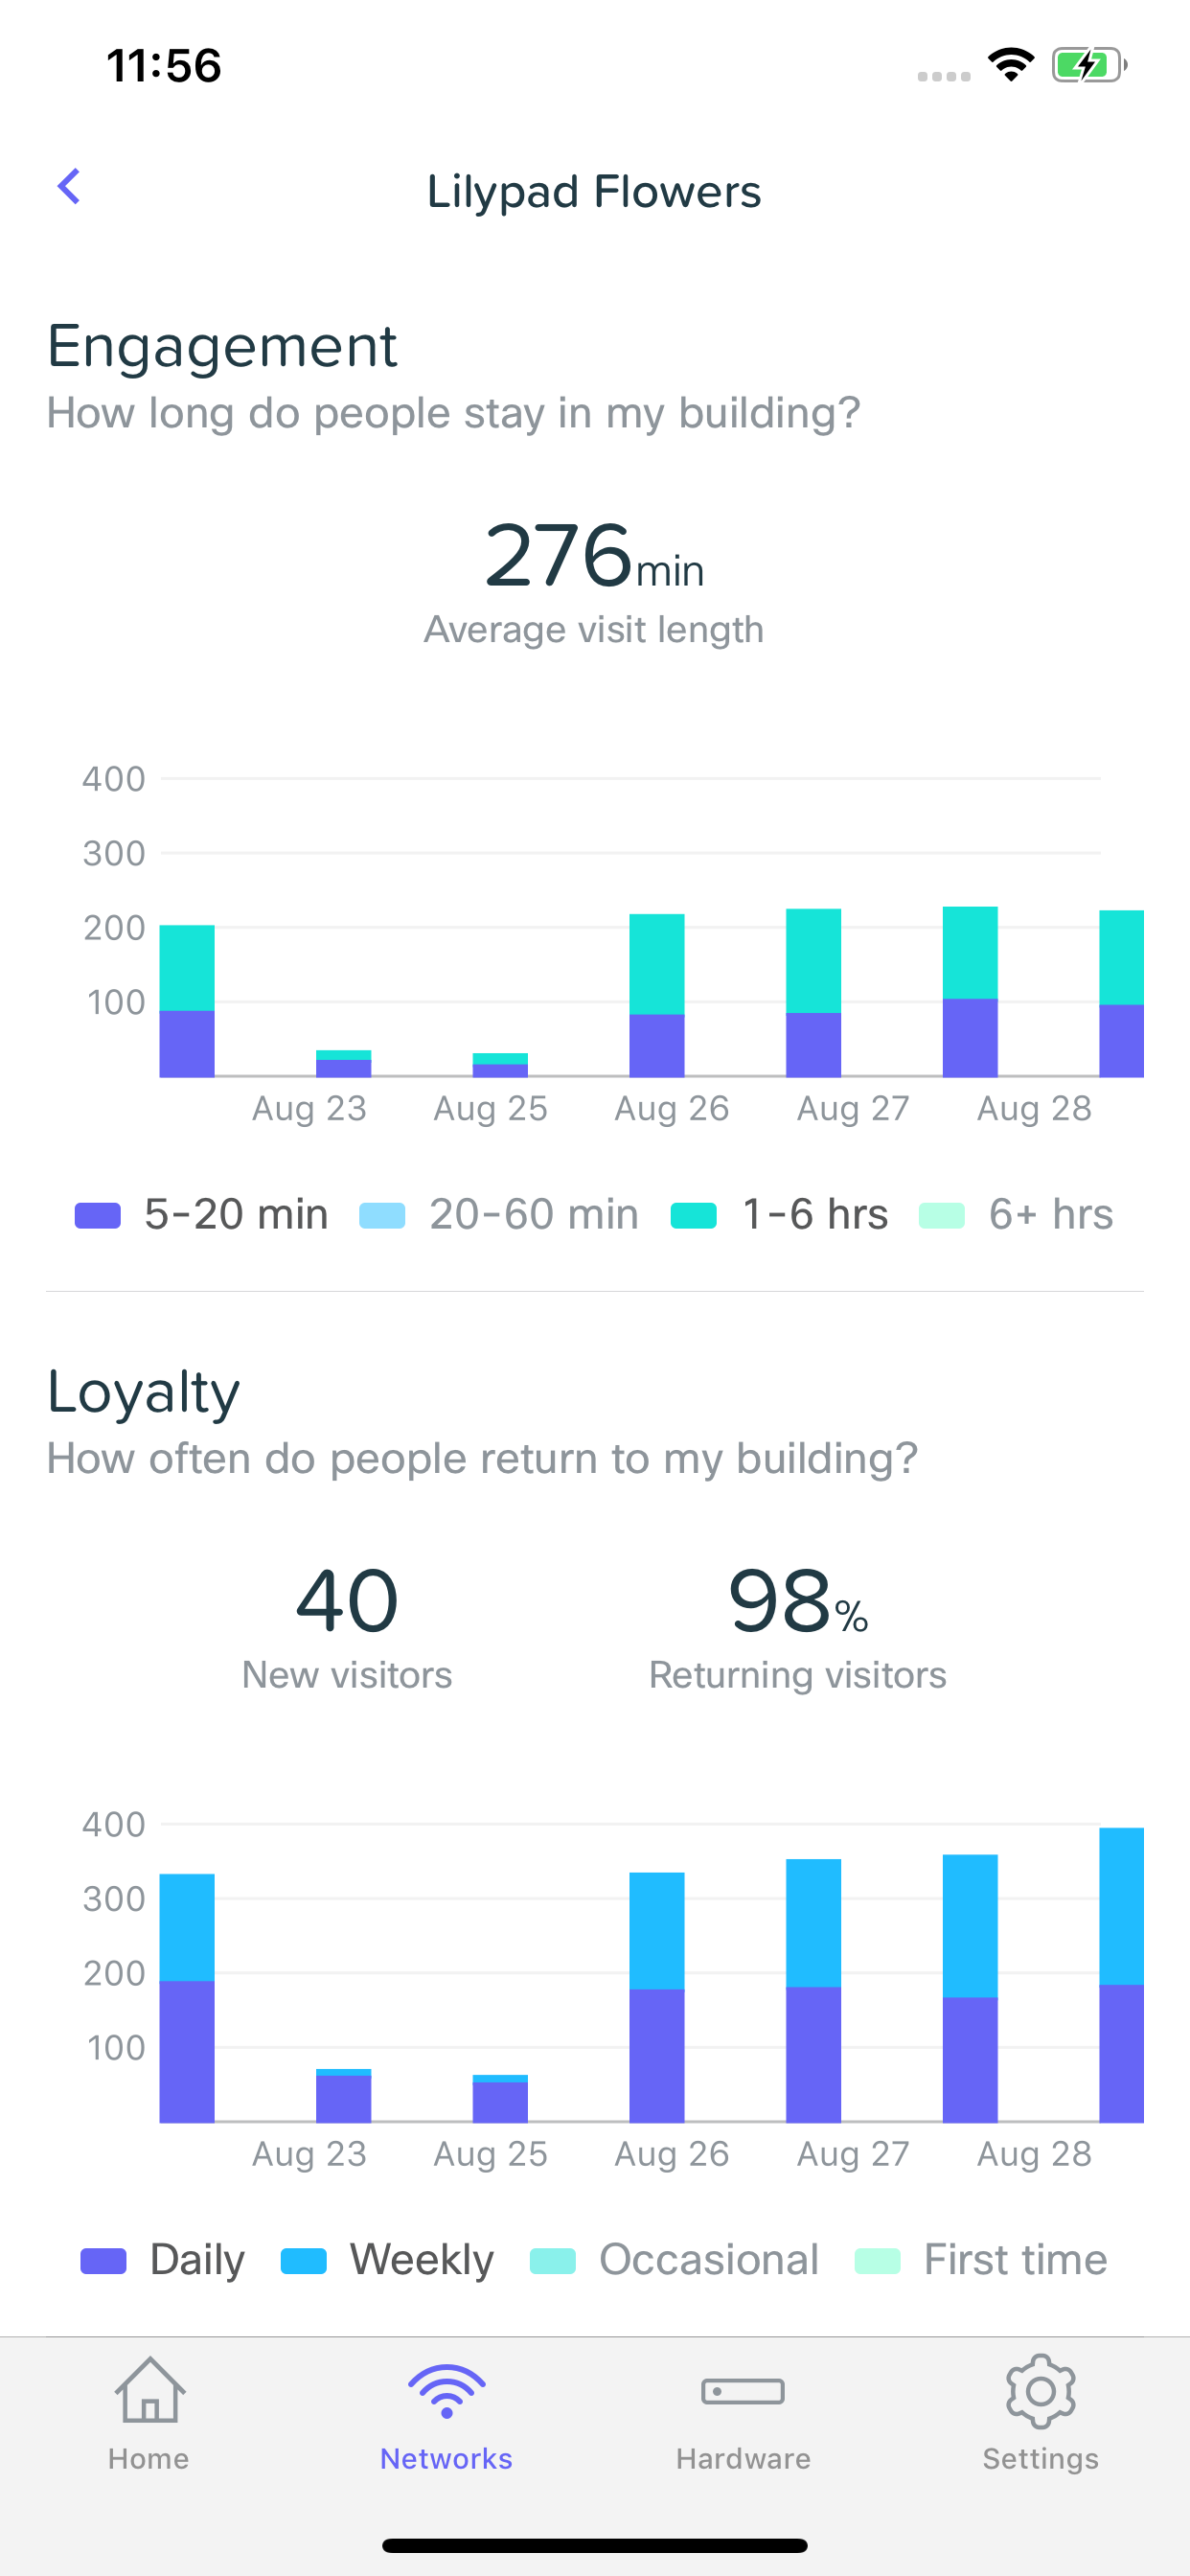
Loyalty
The loyalty section of Visitor Insights provides you with the ability to understand how often people are coming back to your business. This data will be grouped into four categories (listed below). Selecting any combination of those categories will filter the data shown on the graph.
Daily
Has visited in five distinct days over the past eight days.
Weekly
Has visited in at least two distinct weeks of the past four but does not qualify to be a daily visitor.
Occasional
Has visited at least once before, but not frequently enough for any other category.
First time
Has not visited before.