MI Web App Health Overview
Tracked Web Applications
Utilizing Meraki Insight, an MX can be configured to monitor and track all traffic associated with specific Web Applications. This data is tracked on a per-flow basis at the MX, then the relevant flows are aggregated into categorical groups based on their associated application and sent over an encrypted connection back to the Meraki Cloud Controller for further analysis before populating that flow data into the Insight feature on Dashboard. The data gathering process utilizes deep packet inspection, similar to our Advanced Malware Protection and Intrusion Protection systems, to allow Meraki to gather information at both the Network layer and the Application layer so we can help to identify if performance issues are based around local Network performance or Application layer issues.
Performance Indicator
The Performance Indicator is a symbol that is displayed for each application, and is intended to provide a quick reference to the quality of the user experience relative to a specific Web Application, based on the thresholds defined by a Meraki Administrator. A green performance indicator symbol means that both the Application level and Network level are performing within the defined thresholds and user experience should be optimal. A yellow performance indicator means that the application is having a poor performance in the respective domain and will soon reach the red state if not looked at or does not self-heal. A red performance indicator symbol indicates that there are noticeable issues with the performance of a specific application for some users.
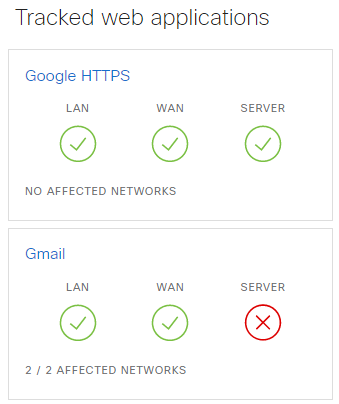
Affected Networks
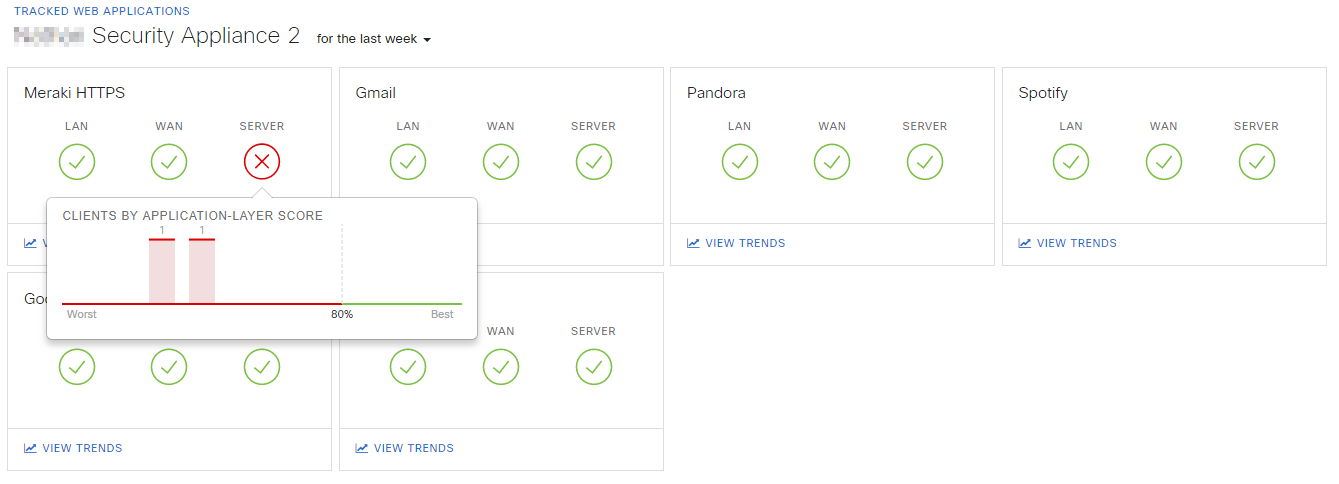
If an Application has a Performance Score of <80% any Networks that are reporting a score below 80% will have a red performance indicator symbol and will be listed under the Affected Networks list. Clicking on the red performance indicator symbol for each respective application source (LAN, WAN, Server) will display a list of Affected Networks.
Clicking one of these Affected Networks bring you to an overview of all tracked Web Applications on that Network and their respective Performance Indicators for the selected network. For more information about the per-Network view of Tracked Web Applications please reference the 'Tracked Web Applications - Per Network View' section of this article.
Configure Web Applications
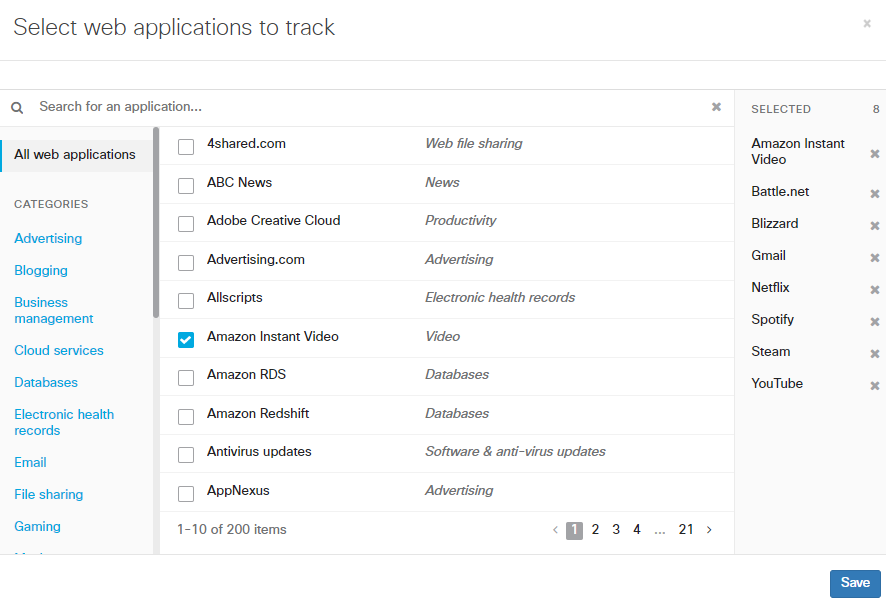
To begin tracking the performance of Web Applications there first has to be at least one category/application selected to monitor. To begin configuring Web Applications to monitor, select Configure Web Applications from the Insight > Monitor > Web App Health page, near the bottom of the applications list. From the popup window you can browse through several categories of applications to monitor, then once a category has been selected, browse until the desired application is listed. Mark the checkbox for that application and select Save.
MI is intended to track your most critical apps. As best practice, we recommend tracking around 10 applications. Although you can track up to 50 apps, high numbers of tracked apps can lead to degraded dashboard performance.
Alternatively, Web Applications can be searched for directly by typing the application name into the Search bar ar the top of the popup window. Once the selected applications have been saved any MX that are configured to have Insight enabled will begin monitoring and reporting information on traffic that matches the applications selected.
Thresholds
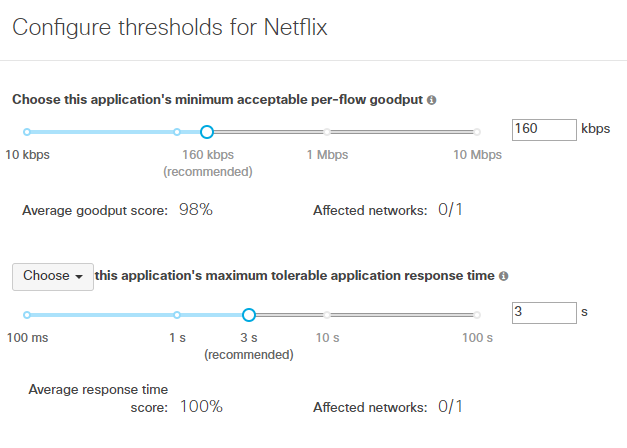
The Application Performance Score is calculated based on several defined Thresholds, primarily Per-flow Goodput and Application Response Time. The Per-flow Goodput is defined as the "predicted maximum amount of data that could be transmitted per flow, based on network latency and loss," while Application Response Time is based on the HTTP response time for requests initiated by the application, excluding any Network Latency. Both the desired Per-flow Goodput and the desired Application Response Time can be configured and customized on a per-Application basis by an Organization Administrator.
The defined minimum acceptable Per-flow Goodput can be set as low as 10Kbps or up to 10Mbps, with the default value being 160Kbps. Similarly, the maximum tolerable Application Response Time can be configured as low as 100ms and up to 100s with a default value of 3s. Application Response Times can also be configured to be ignored when calculating statistics for a specific application if the application is known to use long-polling or WebSockets, as these are expected to have long application response times that do not indicate an issue. This is done by selecting 'Ignore' instead of 'Choose' on the dropdown when configuring the Application Response Time.
Adding Custom Applications
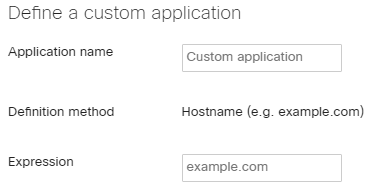
In addition to being able to add traffic from pre-defined categories, custom applications can be defined, based on hostname. To add or edit custom categories, select Configure web applications, and then select Custom from the categories.

In the Define a custom application window, you will be able to fill out the Application name and hostname for the application you wish you track. For example, if you wanted to track traffic to/from google.com, you could enter "Google" as an application name, and "google.com" as the expression.
Adding Applications by IP Address
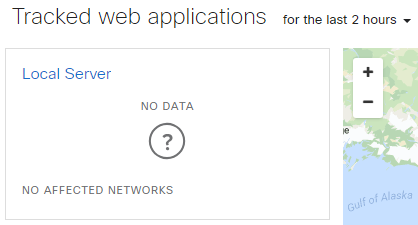
Traffic can also be tracked based on IP address. This can be helpful for tracking traffic to/from a local server or application, or a web application that does not have a hostname. To add an application based on IP address, the definition must first be added to the Organization tab, Traffic analysis. To do this, navigate to Organization > Settings, and then to the Traffic analysis section.

On this page, you can enter a name for the application/traffic you will be tracking, and the IP address for the application. Be sure to select Save to commit your changes.
Note that MI will only monitor HTTPS traffic (TCP port 443), and that ports cannot be specified. For HTTP, any port can be monitored.
After the definition has been added, you must set the application to be tracked in MI. To do this, navigate to Insight > Web App Health, select Configure web applications, and then select Custom. The definition you added in Traffic analysis should be listed in your custom applications.

Check the box next to the application you added, then select Save, and you'll find the application in your Tracked web applications list. Note that it may take some before this new application generates some traffic.
Insight Limitations
Meraki Insight is currently only supported on MX series devices as well as the Z3/C Teleworker Gateway. This does NOT include the Z1 Teleworker Gateway, MS, or MR series of devices. Additionally, MXs that are acting as Auto VPN Hubs will not be able to analyze traffic arriving over the VPN from Spoke sites. To gather data about traffic from Auto VPN Spoke sites, Insight must be enabled on the spoke MX. Finally, traffic originating from the WAN, such as that destined for an onsite web server will not be tracked.
Tracked Web Applications
Per Network View
Selecting an Affected Network from the Tracked Web Applications page will bring up all Tracked Web Application statistics for just the selected network. By clicking on the respective application indicator symbols, this page displays the Performance Score for each application for clients in the selected network for both the Network-Layer and the Application-Layer individually. Both the Network-Layer and Application-Layer scores are shown in a way that clearly shows how many clients are in the acceptable performance range and how many clients are having experiences that fall outside the configured acceptable range of performance, in addition to how far out of range the experience is.
For example, the image below shows the Performance Score for Meraki HTTPS traffic for the last week, which is currently below the respective threshold for two clients. If we click View Trends, we can check on the individual clients by clicking on the Clients tab. Looking at both the Application-Layer score chart we can see that while some clients might be experiencing noticeable issues with the applications, not all clients are experiencing issues and those that are experiencing issues are experiencing application layer issues, not network layer issues.
To view more detailed information about a specific Web Application click on the View Trends link for that Application.
Client Details View
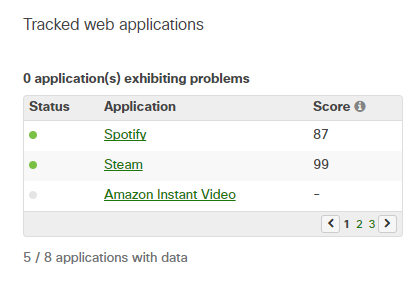
Selecting a client from the Network-wide > Monitor > Clients page will open the Client Details page for that specific client. If the network has Insight enabled then this page will also list any Tracked Web Applications and the respective Performance Score for this client for each application. Clicking on the application name from this view will bring up the Application Trends page for the chosen application in the current network. For more information about Application Trends, please refer to the Viewing Application Trends section of this article.
Viewing Application Trends
Overview
To get a better idea of how exactly a specific Web Application is performing we can view the trends for that specific application. The View Trends page is broken down into several different sub-pages, Network, Application, WAN, LAN, Clients, Servers, and Domains, with each one explained in detail below.
Network
The Network tab displays information related to the Network-Layer performance of data flows that match the definition of the selected Web Application.

Events
The Events Timeline displays a marker for each Network related event that is logged to the Event Log. Events such as VPN route changes and WAN failovers will be displayed here. To view the details of an event simply click on the marker and then select 'Details' from the right panel under where the number of events is displayed.

Performance Score
The Performance Score chart displays a historical timeline of the Network Performance Score for the selected application. The Network Performance Score is calculated by comparing the configured Threshold values for Network Latency and the actual recorded latency of the application.

Total Network Usage
The Total Network Usage graph displays a historical view of the total bandwidth usage on the WAN of the MX for all traffic types.

Latency
The Latency graph displays a historical view of the recorded TCP round trip time of connections made by the selected application. The network latency for an application is calculated based on the TCP SYN, SYN/ACK response time for connections from that specific Web Application.

Application
The Application tab displays information about the Application-Layer performance that has been gathered from traffic flows matching the selected Web Application.

HTTP Response Time
The HTTP Response Time graph displays the historical average time between the last HTTP Request packet and the first HTTP Response packet for an application flow.

App Usage
The App Usage graph displays the total network usage of the selected application as recorded on the WAN of the MX, including the Sent and Received data.

HTTP Request Rate
The HTTP Request Rate graph displays the historical average of HTTP Requests per-minute generated by the selected application.

WAN
The WAN tab displays information about application performance specific to the WAN side of the MX.

Events
Exactly like the Events Timeline on the Network tab, the Events Timeline on the WAN tab displays a marker for each network related event that is logged to the Event Log. Events such as VPN route changes and WAN failovers will be displayed here. To view the details of an event simply click on the marker and then select 'Details' from the panel on the right.
Available Goodput (WAN Limited)
The Available Goodput graph displays historical information about the recorded potential goodput on the WAN side of the MX. The Available Goodput is defined as the predicted maximum amount of data that could be transmitted per flow, based on network latency and loss on the WAN. The predicted Available Goodput is limited to 100Mbps, if the predicted goodput is higher than 100Mbps then the graph will still only display a maximum of 100Mbps.

HTTP Response Time
The HTTP Response Time graph displays the historical average time between the last HTTP Request packet and the first HTTP Response packet as seen on the WAN.

WAN Loss
The WAN Loss graph displays the amount of packet loss that has been detected on the WAN side for flows matching this application.

Latency
Exactly like the Latency graph on the Network tab, the Latency graph on the WAN tab displays a historical view of the TCP round trip time of connections made by the selected application as seen on the WAN interface. The reported latency is calculated based on the TCP SYN, SYN/ACK response time for the initial connections made by the specified Web Application.
Total Network Usage
Exactly like the Total Network Usage graph on the Network tab, the Total Network Usage displays a historical view of the total bandwidth usage on the WAN of the MX for all traffic types.
LAN
The LAN tab displays information about the network performance on the LAN side of the MX.

Events
Exactly like the Network and WAN tabs, the Events timeline on the LAN tab displays a marker for each network related event that is logged to the Event Log. Events such as Active Directory communication failures will be displayed here. To view the details of an event simply click on the marker and then select 'Details' from the panel on the right.
Available Goodput (LAN Limited)
The Available Goodput (LAN Limited) graph displays historical information about the recorded potential goodput on the LAN side of the MX. The Available Goodput (LAN Limited) is defined as the predicted maximum amount of data that could be transmitted per flow, based on network latency and loss on the LAN. Like the Available Goodput graph on the WAN tab, the predicted Available Goodput is limited to 100Mbps. If the predicted goodput is higher than 100Mbps then the graph will still only display a maximum of 100Mbps.

LAN Loss
The LAN Loss graph displays the measured packet loss on the LAN for flows matching the specified application.

Total Network Usage
Exactly like the Total Network Usage graph on the Network and WAN tabs, the Total Network Usage displays a historical view of the total bandwidth usage on the LAN of the MX for all traffic types.
Clients
The Clients tab displays information about each client that has used the specified Web Application during the selected time period. The information includes the average Performance Score for a given client and the current application, the number of requests the client has made, and the average HTTP Response Time.

Clients
The Clients column lists the Description and detected Operating System of clients who have generated traffic flows that match the definition of the specified Web Application. Clicking on the client Description will open the Client Details page for that client.
Score
The Score column displays the calculated Performance Score of a given client for the specified Web Application over the selected time period.
Requests
The Requests column displays the number of HTTP Requests that were made by the Web Application from a given client for the specified time frame.
Available Goodput
The Available Goodput column displays the average predicted Available Goodput to the Web Application for a given client for the specified time frame. The Available Goodput is defined as the predicted maximum amount of data that could be transmitted per flow, based on network latency and loss.
Response Time
The Response Time column displays the average HTTP Response Time for the application for a given client for the specified time frame. HTTP Response Time is calculated as the time differential between last HTTP Request packet and the first HTTP Response packet of a flow.
Servers
The Servers tab displays information about the remote Web Servers that have been utilized by the Tracked Web Application during the chosen time period. This can be useful to help identify if there is a specific Web Server that could be contributing to application issues.

Servers
The Servers column lists identifying information about the remote server that have been contacted. This could include just the servers IP address or the full address of the server.
Score
The Score column displays the average calculated Performance Score for flows that are communicating to each specific server over the specified time frame.
Requests
The Requests column displays the number of HTTP Requests that have been sent to a given server over the chosen time period.
Available Goodput
The Available Goodput column displays the predicted maximum amount of data that could be transmitted per flow, based on network latency and loss to a specified server over the chosen time period.
Response Time
The Response Time column displays the average HTTP Response Time, minus Network Latency, for flows destined for a given server over the chosen time period.
Domains
The Domains tab displays information about different Web Domains that have been contacted by the selected Web Application. Similar to the Servers tab, this can be useful to determine if there is a specific domain that could be contributing to application performance issues.

Domains
The Domains column lists domains that have been contacted by the selected Web Application.
Score
The Score column shows the average calculated Performance Score for flows that are communicating to each specific domain over the specified time frame.
Requests
The Requests column displays the total number of HTTP Requests sent to each domain by all clients in the network over the specified time period.
Available Goodput
The Available Goodput column displays the predicted maximum amount of data that could be transmitted per flow, based on network latency and loss to a specific domain over the chosen time period.
Response Time
The Response Time column displays the average HTTP Response Time for a given domain over the specified time period.
Configuring Alerts for Web App Health
To help with proactively monitoring and troubleshooting issues, Web App Health provides the ability to configure email alerts. Configuring an email alert is a two-step process.
First, navigate to Insight > Web App Health and scroll to the bottom of the page. At the bottom of the list of applications, select the Manage alerts option, which is listed as shown in the figure below.
Second, click on Manage alerts to open a pop-up window, where alerts can be managed on a per-application basis.
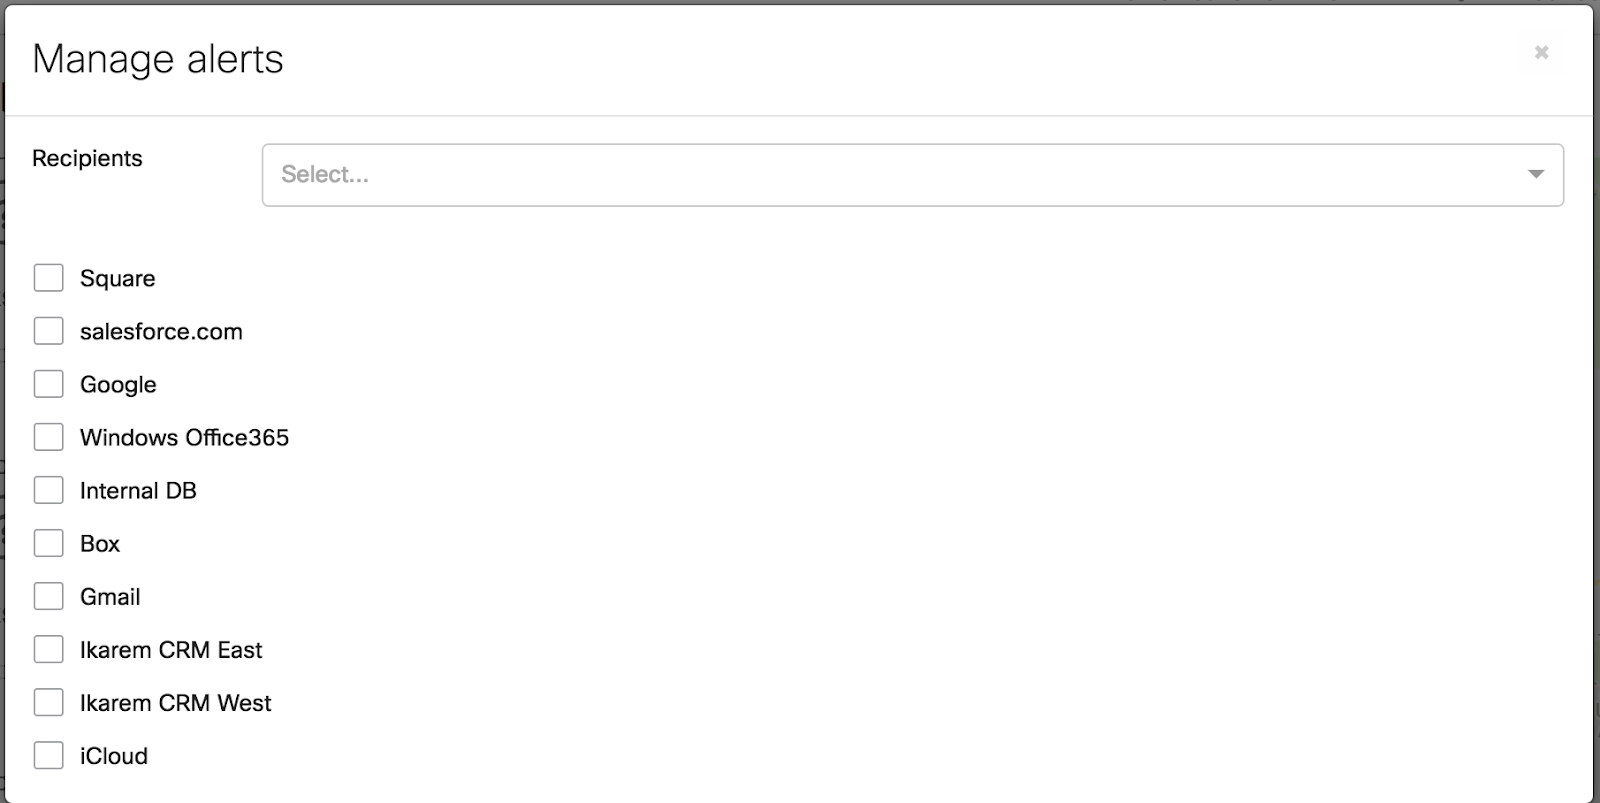
Alerts will be triggered (send an email) if an application is performing "poorly" (as defined by the threshold levels you've set for each application) either on a network side (LAN/WAN) or a server-side (hosting resource). The email will also include information about which side is experiencing poor performance, and will include a link to your dashboard, where you can learn more about the issue.
Note: Keep in mind that thresholds play a significant role in alerting. It is highly recommended to set thresholds (i.e. Per-Flow Goodput and Response Time) properly in order to receive actionable Alerts to take proactive measures.
Alerting Capabilities
-
Currently, all recipients will receive the same alerts. Alerts cannot be set on a per-recipient or per-application basis.
-
Recipients can either be written in manually or, for convenience, can be selected from a list of organization-level admins. Accounts in the pre-populated list include users with organization-level read-only or full access.
-
Applications can be selected individually, or multiple applications can be selected at once.
Features of Alerts
-
Receive a clear indication of an issue when it occurs, and understand at a glance, before using the dashboard, whether it is an application or network level issue. Alerts include the application name and network that is having an issue
-
Web app email alerts are smart enough to recognize "flapping" alerts (quickly and repeatedly crossing an acceptable threshold) and send an alert at staggered time intervals (every 30 mins)
-
Alerts also include notifications when the issue is resolved
Additional Alerting Considerations - SPAM Filters
- All network alerts will be sourced from the same email address. To ensure that alerts are not being lost to a spam filter, please be sure to add alerts-noreply@meraki.com as a trusted email source.

