
RF Spectrum Page Overview
Click 日本語 for Japanese
Cisco Meraki access points with a dedicated WIPS (Air Marshal) radio, such as the, MR36, MR57 or newer have the ability to do real-time spectrum analysis of their environment while still serving clients. This information can be useful when troubleshooting wireless issues or determining which channels to use in high-density environments.
To access this information, navigate to Wireless > Monitor > RF spectrum. Only APs (Access Points) with a dedicated WIPS radio will appear on this page. If there are none within the selected network, the page will not appear.
When monitoring channel utilization and reviewing the information below, it is important to remember that a busy wireless network will naturally result in higher utilization of channels. While this is to be expected, it can still be used as an indicator that a particular AP or channel may have too many clients. If using this page as part of channel planning, measurements are best taken when no SSIDs are active on the AP.
The information on the RF Spectrum page is sourced from the scanning radio. The scanning radio on the Meraki Access Point has a counter for each channel that it scans. Each channel is scanned for 150 ms and the counter is updated every 20 nsec. Counters indicate how many times the AP was transmitting, receiving and saw congestion on the channel as well as the total cycle count. For every 150 ms sample, the AP reads the counters and computes the difference between the value from 150 ms ago and the new value. This difference is used to calculate the channel utilization.
Summary View
The initial page will provide a list of all compatible APs, along with the following information for each band used (2.4 GHz, 5 GHz, and 6 GHz):
- Name - The name of the AP (or MAC address if no name has been configured).
- Channel - The channels currently in use by this AP.
- Avg. channel utilization - Average utilization over the last week for the AP's client-serving radios.
- Packet loss - Packet retry rates of 802.11 data and management frames over the last week.
Firmware version MR 31.1.6 and higher only considers data frames in the packet loss rate.

For details of how an AP is interacting with neighboring APs, click on its row in the table:
Detailed View
Viewing neighbor details for a given AP will provide several data points, updating in real-time from the AP. The view can be filtered by frequency band, and the data are presented two graphs:
- AP Neighbors by Channel: a visual representation of channels being seen by the AP, with signal strength in RSSI on the y-axis, and channels on the x-axis
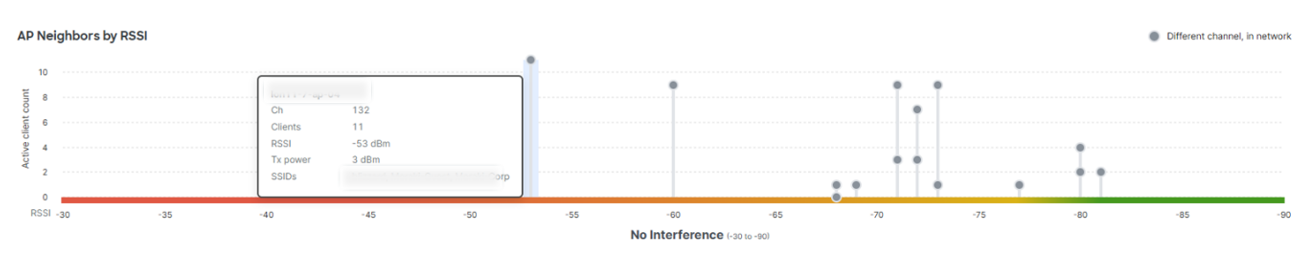
- AP Neighbors by RSSI: a visual representation of the level of interference from neighboring APs, with active client count on the y-axis and signal strength in RSSI on the x-axis:

The data are also summarized as a list, and you can select the following views:
- Interfering APs (same channel)
- Interfering APs (some overlap - shown below)
- Non-Interfering APs.
- Total In-Network Neighbors.

You can chose to view data In network or Outside Network by using the slider:
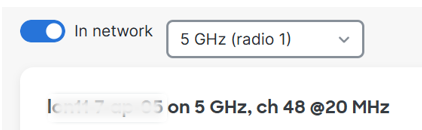
In Network
AP Neighbors by Channel
Hovering the mouse over the data point for a neighboring AP reveals the following details:
- Name - Name of AP neighbor.
- interference level- Reported according to RSSI: High (-35 to -67), Moderate (-68 to -75), or Low (-76 to -90).
- Channel - Channel being used by the neighboring AP.
- Clients - number of clients associated with the neighboring AP.
- RSSI - Received signal seen from the neighboring AP.
- TX Power - TX power level utilized by the neighboring AP.
- SSIDs - SSIDs being broadcast by the neighboring AP.

AP Neighbors by RSSI
Hovering the mouse over the data point for a neighboring AP reveals the following details:
- Name - Name of AP neighbor.
- Channel - Channel being used by the neighboring AP.
- Clients - number of clients associated with the neighboring AP.
- RSSI - Received signal seen from the neighboring AP.
- TX Power - TX power level utilized by the neighboring AP.
- SSIDs - SSIDs being broadcast by the neighboring AP:
Outside Network
AP Neighbors by Channel
Hovering the mouse over the data point for a neighboring AP reveals the following details, where available:
- interference level- Reported according to RSSI: High (-35 to -67), Moderate (-68 to -75), or Low (-76 to -90)
- Channel - Channel being used by the neighboring AP.
- RSSI - Received signal seen from the neighboring AP.
- SSIDs - SSIDs being broadcast by the neighboring AP:

AP Neighbors by RSSI
This graph will only display data from neighbors in network irrespective of the view selected using the slider
Old Version
Spectrograms and Waterfall graphs can sill be viewed by clicking on the link in the information box which will take you to the Overview page in the Old Version of the page:

Overview Page
The initial page will provide a list of all compatible APs, along with the following information:
- Name - The name of the AP (or MAC address if a name hasn't been configured).
- Channels used - The channels currently in use by this AP. Listed as 2.4 Ghz channel, 5 GHz channel, and 6 GHz channel.
- Avg. channel utilization (2.4 GHz) - Average utilization over the last 80 seconds for the AP's client-serving 2.4 GHz radio channel.
- Avg. channel utilization (5 GHz) - Average utilization over the last 80 seconds for the AP's client-facing 5 GHz radio channel.
- Avg. channel utilization (6 GHz) - Average utilization over the last 80 seconds for the AP's client-facing 6 GHz radio channel.
The average channel utilization for the last 10 samples is calculated on the AP and displayed on this page initially. The longer the page is open, AP sends information around every second are aggregated average is shown. The data is refreshed when the page is refreshed.
For detailed information from an AP, click on its row in the table:

Once viewing the details for a given AP, several sets of information will be displayed, updating in real-time from the AP.
Details Page
To see which channels an AP is currently serving clients on, refer to the channels information right next to the AP's name. In this example, channels 11, 100, and 53 are being used. This will also be bolded in the X-axis of the spectrograms below.

The information on the rest of the page can be displayed for either the 2.4 GHz, 5 GHz, or 6GHz band, dependent on the channel selection box. In the image below, 2.4 GHz is currently selected:

Spectrograms
The next section of the page will display a spectrogram of utilization on each channel. Lower values are better (like -100dBm), keeping in mind the numbers are negative. This graph will start largely empty, and continually update with new readings. The current reading will be indicated by a thin white line.

Over time, as more measurements are taken, a more colorful graph will develop. Points on the graph will move from blue to red as more measurements match that point. Thus over time, the red area of the graph can represent the average/typical channel utilization, while blue represents less frequent values. The image below shows a result of this after about 3 minutes.

The second graph section on the page displays the same information, but providing snapshots of each measurements over time. Each second, a new line will appear on the top of the graph, color-coded based on noise level (utilization). Blue representing low noise, and red indicating high noise.

As more data is collected, trends can be seen as color bands develop over frequencies with higher average noise levels. The newest measurement will always be at the top of the graph.

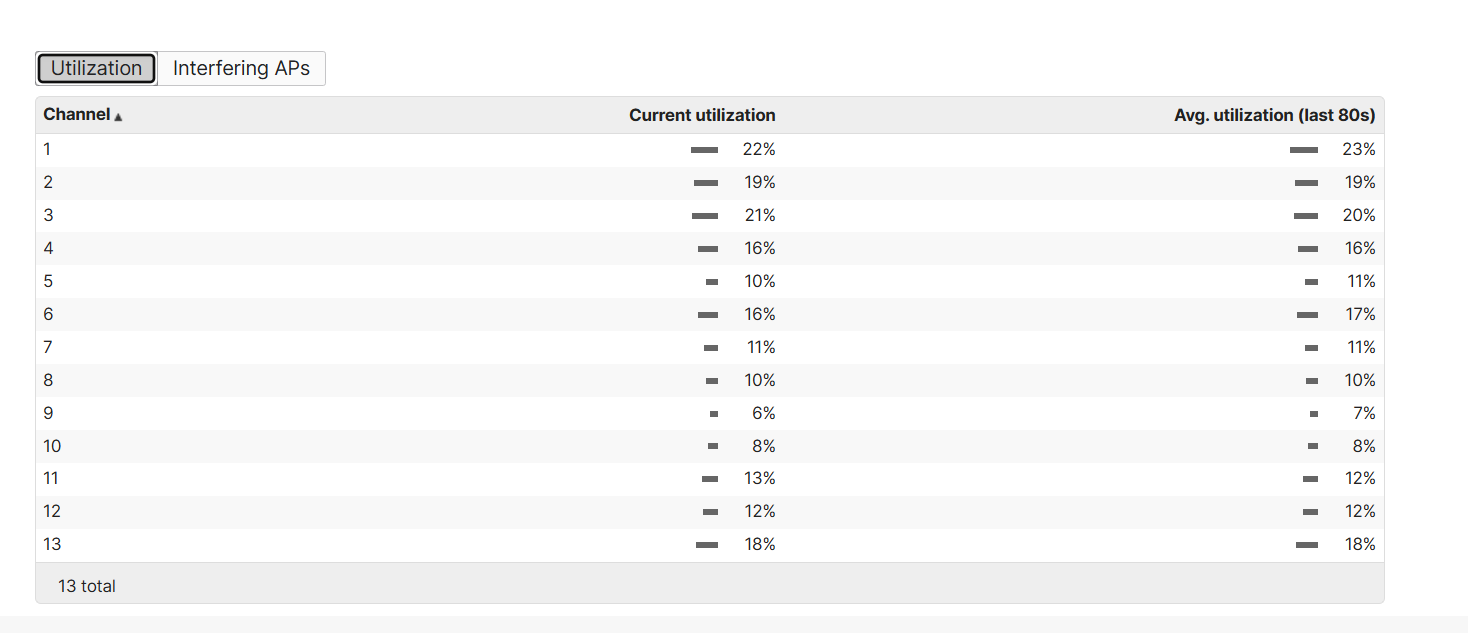
Data Tables
The bottom half of the page provides a table with two different sets of information, dependent on which option is chosen.
Utilization will provide a table of each Channel in the frequency band selected above, along with the Current utilization percent and Avg. utilization over the last 80 seconds. If at 0%, there is virtually no utilization detected on the channel. If at 100%, the channel is saturated and no additional transmissions can be made. If higher than 50%, there are likely to be performance issues, with the severity increasing as the utilization does.
This utilization % will rise as clients transmit data. Thus a high utilization % on a busy network is not unusual, but does indicate the channel is nearing capacity.
Interfering APs will list any detected wireless networks on the Channel selected, along with information about it. A higher dBm (ex. -40 is higher than -60) indicates a stronger signal.
The same physical AP may appear multiple times in this list, once for each SSID it is broadcasting. Thus multiple BSSIDs with the same SSID name. Blank SSIDs are either unreadable or the name is not being broadcast.

The average channel utilization over the last 10 samples is calculated on the AP and shown under the current utilization column on the RF spectrum details for the Access Point. The Average Channel utilization shows the average of channel utilization values reported by the AP over the last 80 seconds. The values reported by the AP are the average of the last 10 150ms samples.