
Firewall Logging
Click 日本語 for Japanese
Introduction
Firewall Log is a live tool that allows you to view the verdict of real-time traffic flows after being processed by the Layer 3 and Layer 7 firewalls. This tool can be used to help surface issues during troubleshooting and can help verify that configured rules are working as expected. This feature is available on MX firmware release 18.2 and newer.
For a quick reference of all MX appliances capable of running the current firmware version and which ones are not, please refer to the following documentation: Product Firmware Version Restrictions
Quick Start Guide
To use Firewall Logging:
-
Navigate to Security & SD-WAN > Monitor > Appliance status.
-
Click on the “Tools” tab.
-
Find “Firewall Log”

-
Enter any filters required and then click the “Start” button.
|
Verdict |
Definition |
|
✅ |
The flow has been allowed |
|
❌ |
The flow has been denied |
Filtering
For the best results with the Firewall Log tool, it is important to filter for a specific traffic flow you are targeting. The following filters can be configured:
|
Filter |
Accepted Parameters |
|
Client |
|
|
IP |
|
|
Port |
|
|
Verdict |
|
Logging Expectations
Flows are uniquely defined by five elements; Source IP, Destination IP, Source Port, Destination Port, and Protocol. Each flow is expected to be logged once for each policy it passes through (in most cases this is Layer 7 and Layer 3 FW rule policies). As an example, if you are sending continuous pings to 8.8.8.8, you should only see the flow logged once for the L3 policy and once for the L7 policy. The same applies to TCP and UDP flows. Below is an example of traffic destined for 6.6.6.6, while it is blocked in Layer 3 rules, but allowed in Layer 7:
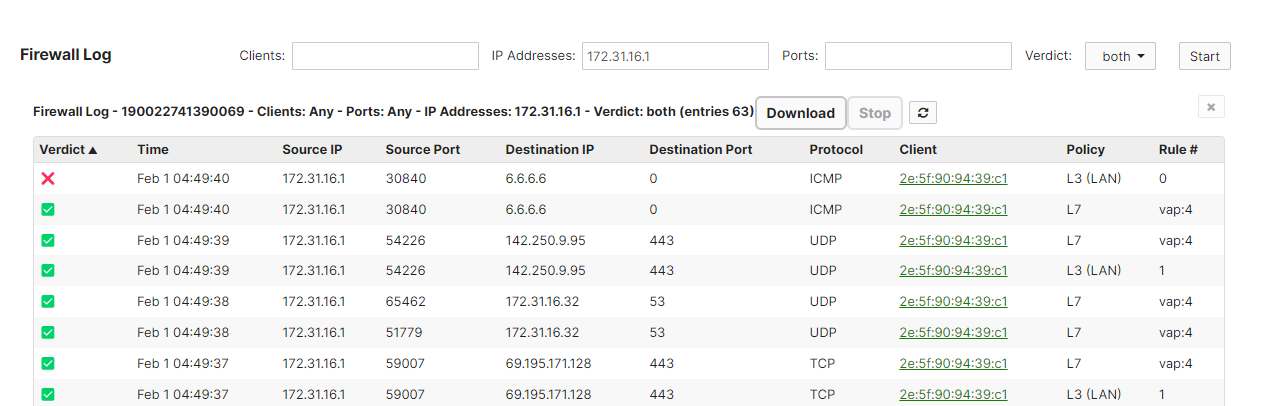
Note: To filter by ICMP, leave the Ports section of the Firewall Log empty, it does not accept "any" or "0" as a parameter.
Definitions
|
Column |
Definition |
|
Verdict |
Firewall decision (allowed or denied) based on configured Layer 3 and Layer 7 policy |
|
Timestamp |
Time of the event using the network configured time in the following format: Month Day HH:MM:SS |
|
Source IP |
IP address of the sender |
|
Source Port |
Port used by the sender |
|
Destination IP |
IP address of the receiver |
|
Protocol |
IP protocol used |
|
Client |
Identifier of the client as shown in Dashboard (Network-wide > Monitor > Clients) |
| Policy (by Firewall) | Description |
| Cellular | Outbound firewall for the Cellular interface. |
| L3 (Client VPN) | Layer 3 Outbound Firewall specific to Client VPN traffic |
| L3 (LAN) | Layer 3 Outbound Firewall. This applies to traffic that is routed on the LAN or from LAN to WAN. |
| L3 (VPN) | Layer 3 Outbound Firewall specific to AutoVPN & IPSEC VPN (Non-Meraki VPN) |
| L7 | Layer 7 Outbound Firewall |
| Stateful (cell) | Inbound firewall for the Cellular interface. |
| Stateful (v4) | IPv4 inbound firewall for the Internet interfaces. This is automatically configured in NAT mode when services like port-forwarding, 1:1 NAT, etc are enabled. |
| Stateful (v6) | IPv6 inbound firewall for the Internet interfaces. |