
Security Center
Click 日本語 for Japanese
Overview
The Security Center provides a centralized view of security filtering events. This includes both IDS/IPS and Advanced Malware Protection (AMP) events. Information and insights to a network administrator are provided through a variety of different components, each focusing on different analytics and uses. This document outlines each of those components and the information they present.
Learn more with these free online training courses on the Meraki Learning Hub:
Navigation and Control
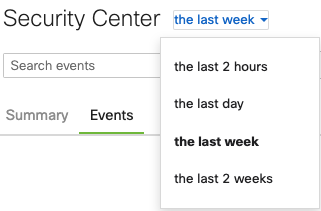
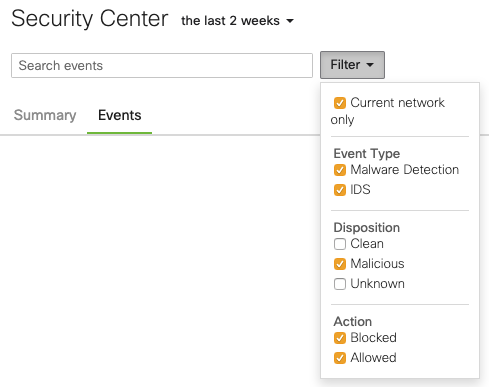
The top of the Security Center page allows control over the data being viewed. From this section of the page, it is possible to:
- Change the time range of events displayed:
- Filter events by scope, type, disposition, and action:
- Search through events by client identifier, URI, SHA256 file hash, or IDS/IPS rule ID:

- Toggle between the Summary and Events view:

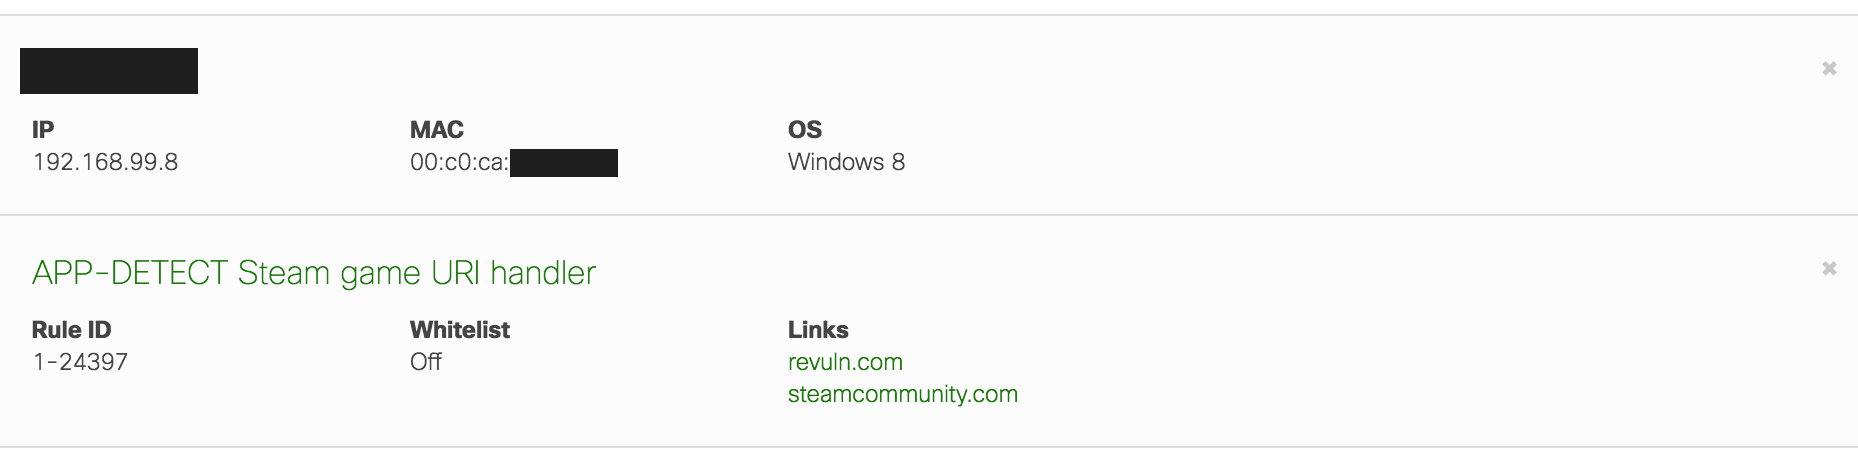
It is also possible to filter event data down to a single client or event. Clicking on a client, IP, or threat will pop up an info card that provides more information and links, including the ability to filter the Security Center view based on the item selected.
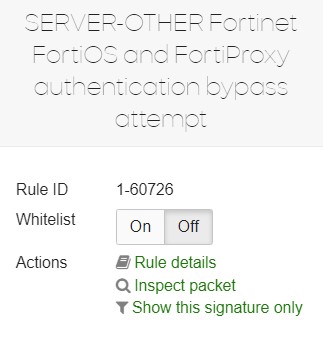
You can toggle a rule to be Whitelisted here. This will apply to all Networks in the Organization.
An example info card for an IDS/IPS signature is included below. Selecting Show only this signature will only show events related to that signature. These filters will be displayed below the navigation and control panel and can be dismissed by clicking the X on the right-hand side:
It is possible to apply multiple filters. In the example above, events will be filtered by the IDS/IPS signature and the client device. Only events matching both filters are displayed in this case.
Information can also be found in Inspect packet view. After clicking, this option allows you to download the specific packet in .pcap format an analyze it.

Summary View
The summary view of the Security Center provides a variety of visual components to understand the security events on the network.
Retrospective Malware Detections
This component provides alerts about downloaded files that have changed to a malicious disposition.

Please see this article for more information about AMP dispositions and retrospection.
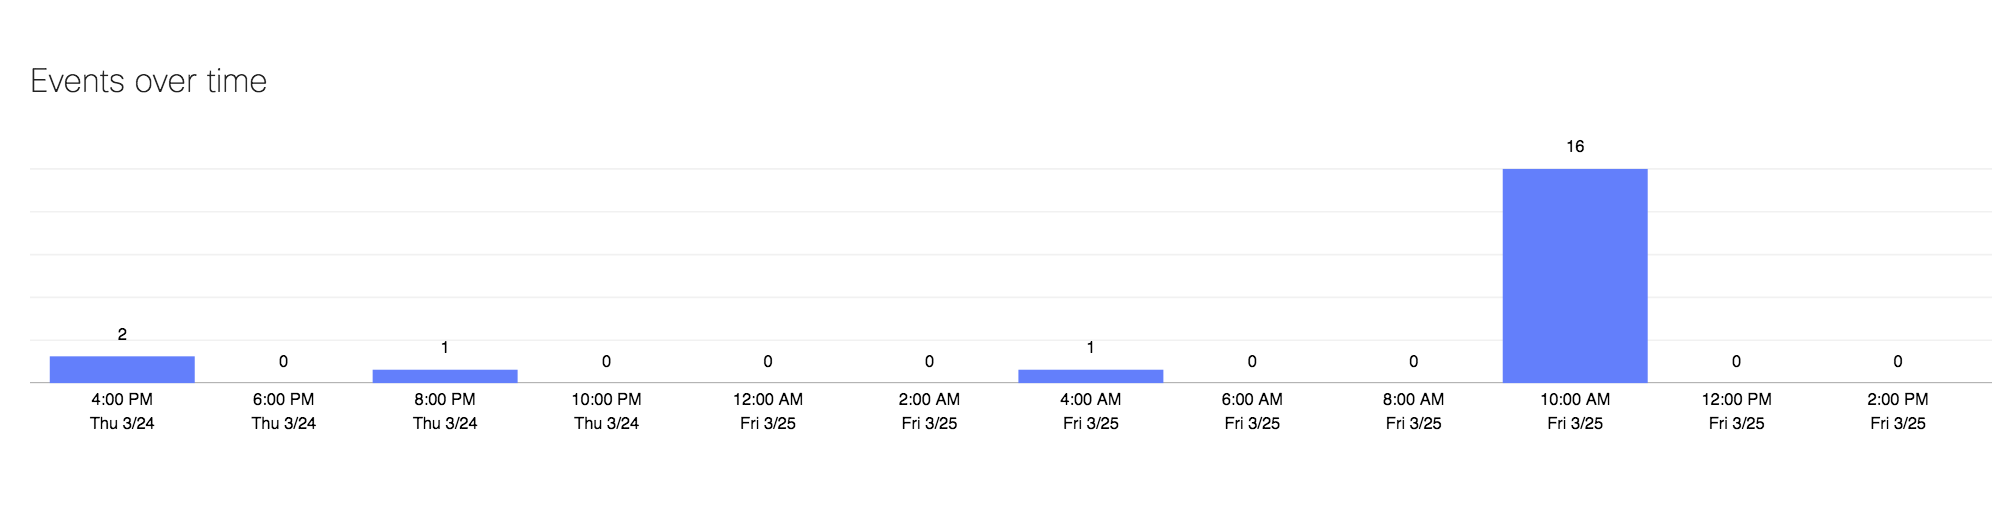
Events over time
The Events over time component shows the number of events matching configured filters, over a specified interval of time, ranging from two hours to two weeks:

Clicking on a day will filter the data within the Security Center to display only events for the selected day.
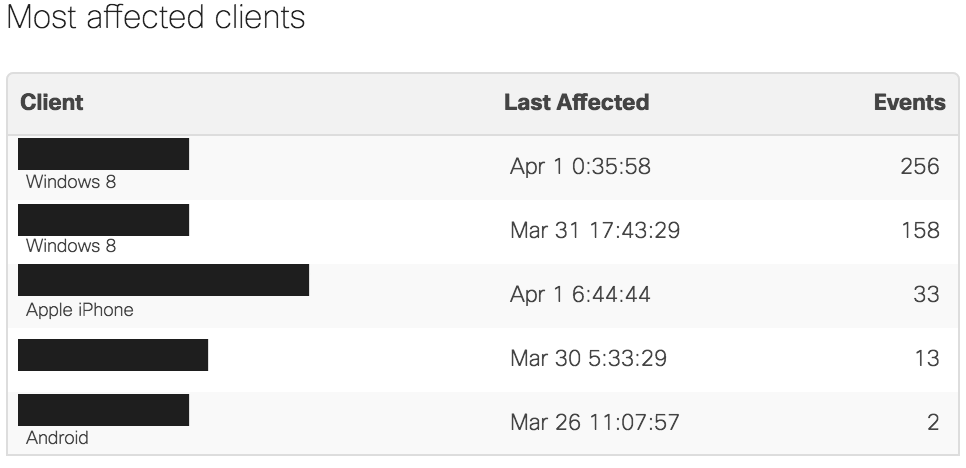
Most affected clients
This section provides a breakdown of the subset of clients that have generated the most events for the selected filters.
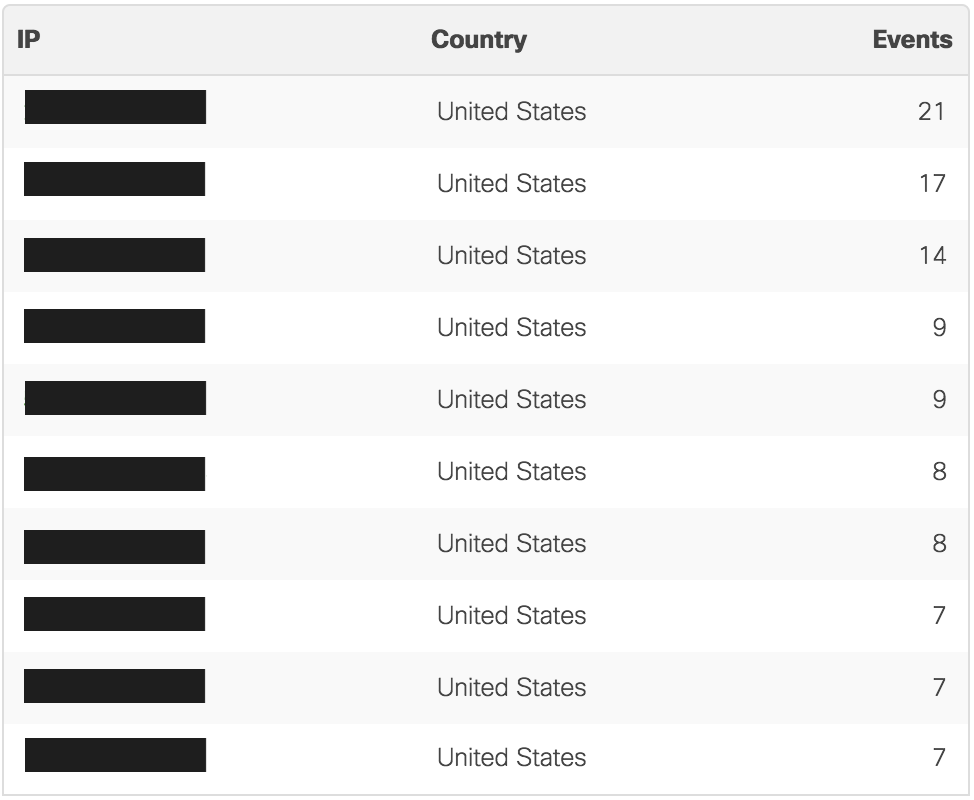
Top sources of threats
This section provides both a map and a table summary of the most common IP addresses associated with threats matching the configured filters.
The map provides a visual view into the trajectory of these threats, from the network location to the geo-located source of the IP address associated with the threat.
The location of the MX must be configured for the map to display properly. This can be done by navigating to Security & SD-WAN > Monitor > Appliance status or Network-wide > Monitor > Map & floor plans.

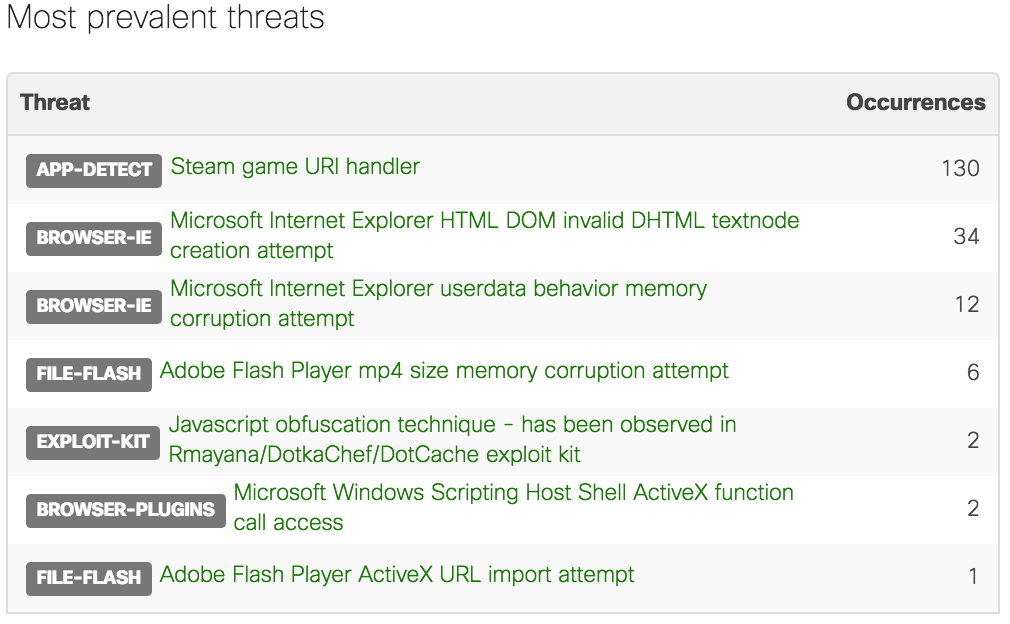
Most prevalent threats
This component provides a list of the most frequent threats matching the selected filters. These can be the most common IDS/IPS signatures that have been detected, the most frequently scanned or blocked file through the AMP engine, or a combination of both.
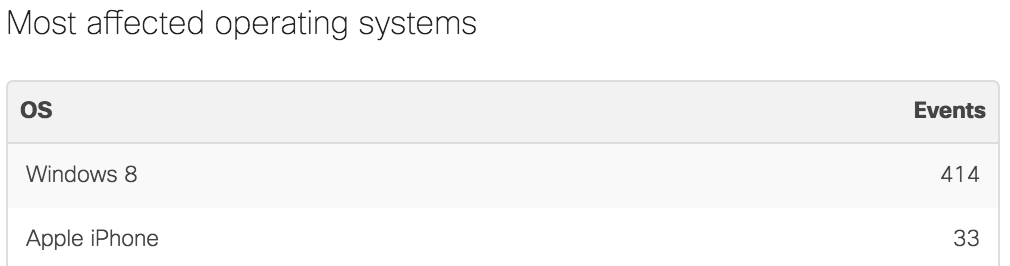
Most affected operating systems
This table summarizes the events matching the selected filters by the client operating system. The events are aggregated based on the operating system of the client devices in the security events and are displayed in the table by the number of events associated with that operating system.
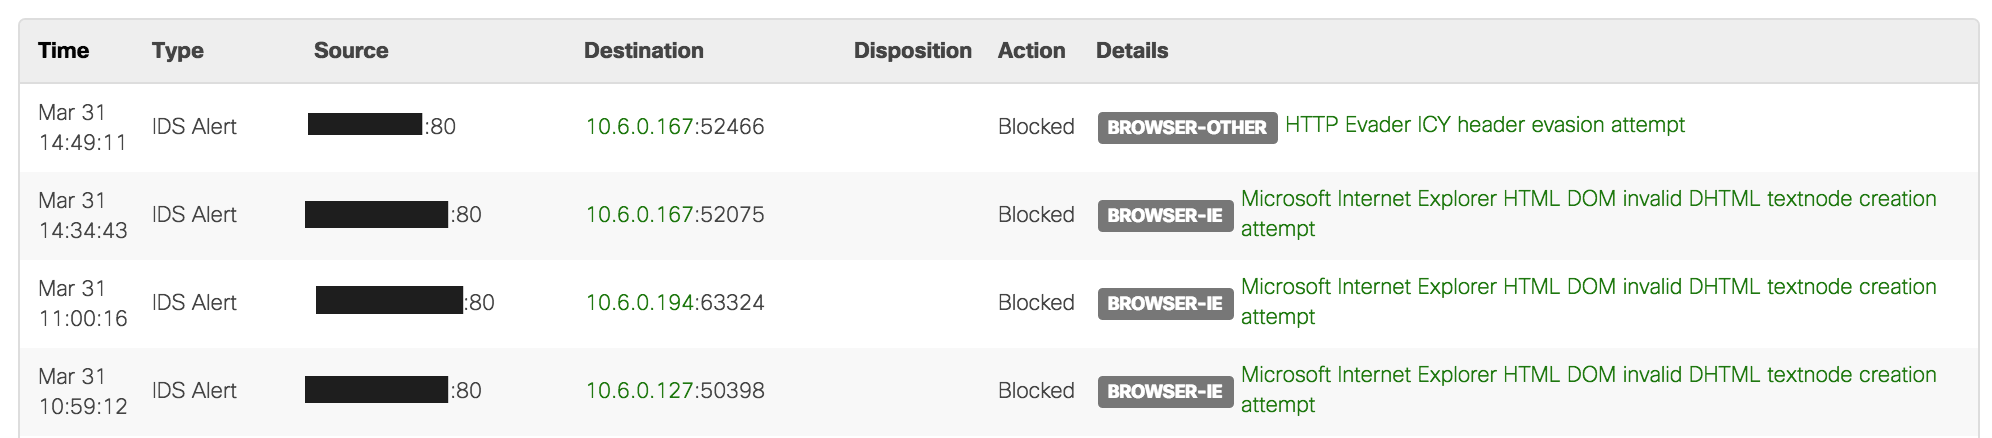
Events View
The Events view provides the same data as the summary view in a text-based log. It is still possible to filter this data in the same ways as the summary view:
Reporting
Data collected in the Security Center can be reported via e-mail to specified recipients by clicking the e-mail icon on the top-right corner of the Dashboard page. The frequency and format of such reports may also be defined.

Reports are not generated when there are no events logged in the Security Center
Alternatively, the Security Center's data can be exported via a .csv file.
Organization-wide
The Organization > Security Center Dashboard page allows you to inspect events from across all of your networks at once, and drill down into them as needed. From here you may access the Summary Report page for the selected network, or filter the result by only showing the selected network.