

How to Monitor SD-WAN AutoVPN Tunnel Performance
Overview
Software-defined WAN (SD-WAN) is a suite of features designed to provide robust connectivity to optimize quality and availability of critical network services like VoIP.
To understand Dynamic Path Selection decisions, and to create and tune performance rules, you need to understand the connectivity metrics of the AutoVPN tunnels. Monitoring is available from the VPN Status page
An SD-WAN-enabled WAN appliance forms concurrently active AutoVPN tunnels across both of its uplinks to each of its individual AutoVPN peers' uplinks. The per-peer AutoVPN monitoring information provides data on each tunnel formed between the two WAN appliances. This can be:
- Two tunnels from a branch location, such as dual WAN uplinks to a one-armed VPN concentrator in the datacenter.
- Four tunnels, when two WAN appliance VPN peers each have dual WAN uplinks.
The AutoVPN tunnel statistics presented in the per-peer SD-WAN monitoring page are calculated based on performance probes that are consistently sent across each established VPN tunnel.
The per-peer-pair AutoVPN tunnel monitoring page contains 3 main components: the navigation pane, the view summary, and the statistics.
Prerequisites
- An SD-WAN-enabled WAN appliance with AutoVPN established to at least one VPN peer.
- Dual WAN uplinks on the WAN appliance. Per-peer-pair AutoVPN tunnel monitoring information is currently only available for WAN appliances with dual WAN uplinks.
- In a hub-and-spoke deployment that uses a WAN appliance as a one-armed VPN concentrator for the VPN hub, perform monitoring from the perspective of the spoke sites.
- Custom performance classes and VPN flow preferences configured on the Security & SD-WAN > Configure > Traffic shaping page, if you want the view summary to display them.
- Dashboard access to the Organization > Monitor > VPN status page or the Security & SD-WAN > Monitor > VPN status tab.
To enable visibility for networks with single uplinks for troubleshooting purposes, engage Support to review organization scale prior.
Step-by-step instructions
Open the VPN status page
- To view AutoVPN tunnel metrics between two AutoVPN peers, navigate to Organization > Monitor > VPN status, or to the Security & SD-WAN > Monitor > VPN status tab.
- The organization-level VPN status page displays all sites configured for AutoVPN in the organization. From this page, select the network you wish to view.
- The link from the Security & SD-WAN tab provides VPN status information for the current network.
-
From an individual network, select the row entry for a site-to-site VPN peer. Dashboard displays VPN statistics between the current network and that remote VPN peer.

Alternatively, view the per-peer-pair AutoVPN tunnel monitoring statistics from the Uplink Decision entry in the Uplink decisions table.

Set the scope with the navigation pane
The navigation pane changes the scope of the tunnel statistics you are viewing.
-
Toggle the data displayed between Uplink 1 (the Internet 1 port) only, Uplink 2 (the Internet 2 port) only, and All uplinks.
-
Select the time range that the data displays for: the past 2 hours, the past day, the past week, or the past month.

Read the view summary
The view summary provides context about the VPN statistics you are viewing.
-
Check the top of the view summary panel to confirm which pair of WAN appliance VPN peers the data covers. The first WAN appliance listed represents the site reporting the data in the statistics panel. The second indicates the WAN appliance VPN peer the statistics are relative to.
In this example, the WAN appliance in the San Francisco dashboard network gathers the VPN performance statistics. The statistics display all VPN connections from the San Francisco appliance to the Sydney appliance.

-
Review any custom performance classes listed in the view summary. Define these on the Security & SD-WAN > Configure > Traffic shaping page.
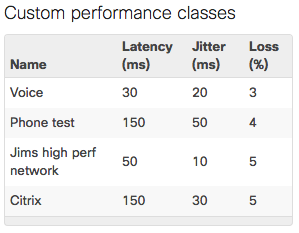
-
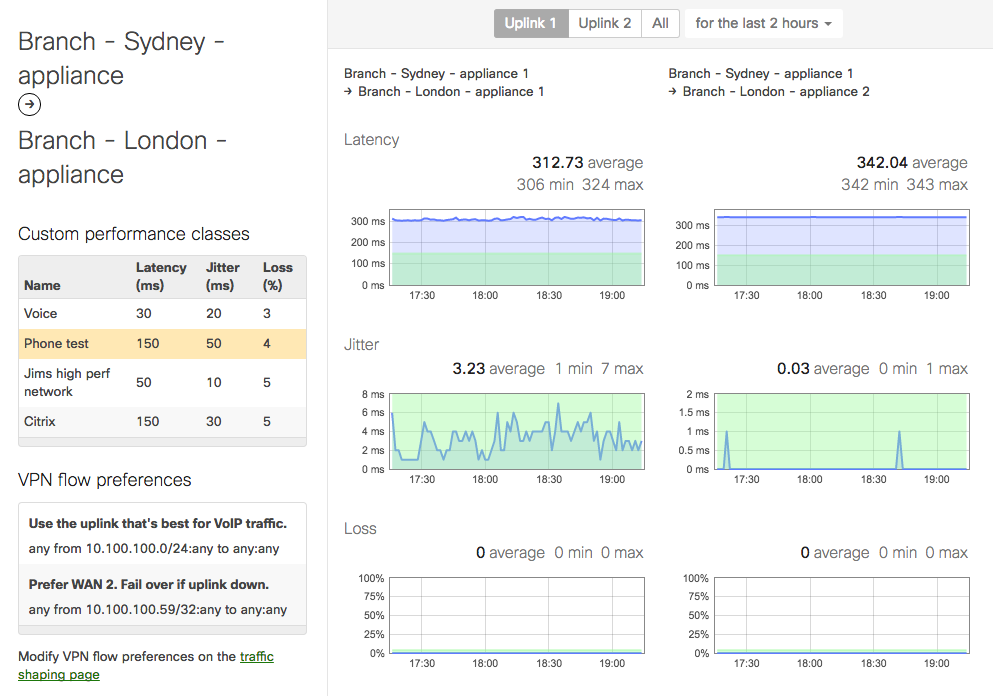
Hover over a particular custom performance class to apply color highlighting over the graphs. This provides an at-a-glance indication of how the VPN tunnels performed in relation to the performance classes defined on the WAN appliance.
-
Review the configured VPN flow preferences, also listed in the view summary for reference. Configure and modify preferences from the Security & SD-WAN > Configure > Traffic shaping page.

Review the statistics
-
For the selected uplink and time summary specified in the navigation pane, review the latency, jitter, loss, and MOS score metrics.
-
For each metric, review the average, minimum detected value, and maximum detected value. Dashboard calculates these values using data in the specified time threshold.

-
Read each column as an uplink pairing. In the example below, the first column displays the VPN tunnel performance information for VPN connections using the Branch - Sydney appliance's uplink 2 (WAN 2) and the Branch - London appliance's uplink 1 (WAN 1). The second column shows performance information for VPN connections using the Branch - Sydney appliance's uplink 2 (WAN 2) and the Branch - London appliance's uplink 2 (WAN 2).

-
Hover over a point on one of the graphs to display the timestamp and value for each tracked metric at that point in time. This allows a quick assessment of all tracked metrics for a point in time.
Verification
Confirm the following results:
- The statistics panel plots latency, jitter, loss, and MOS score for the selected uplink and time range, and displays the average, minimum, and maximum value for each metric.
- Each statistics column maps to one uplink pairing between the reporting appliance and its VPN peer, so every active tunnel between the two appliances is represented.
- Hovering over a point on a graph returns the timestamp and value for each tracked metric.
- Hovering over a custom performance class casts a light green overlay on the statistics, with VPN peer statistics graphed in blue. Use the overlay to confirm whether the tunnels met the performance class thresholds.
In the example used above, no VPN connections over the Branch - Sydney WAN appliance's uplink 1 satisfied the "Phone test" performance class in the past two hours. Jitter and loss stayed within the configured thresholds, but the plots for latency exceeded the performance threshold specified.
Troubleshooting
Graphs do not appear for a network: Per-peer-pair AutoVPN tunnel monitoring information is currently only available for WAN appliances with dual WAN uplinks. In a hub-and-spoke deployment that uses a WAN appliance as a one-armed VPN concentrator for the VPN hub, monitor from the perspective of the spoke sites. To enable visibility for networks with single uplinks for troubleshooting purposes, engage Support to review organization scale prior.
Metrics differ between peers or between uplinks: The amount of loss, latency, and jitter an appliance observes will likely vary based on the geographical location and quality of WAN connection of its VPN peer. For the San Francisco appliance used in the earlier example, the VPN performance statistics would likely differ between a site-to-site VPN peer local to San Francisco, an appliance deployed in Sydney, and another deployed elsewhere. Statistics are therefore available per VPN peer pairing.
Statistics may also vary based on the remote VPN peer's uplink, sometimes because of differences in service provided for the uplinks or other WAN conditions. In the example above, the Branch - Sydney appliance has a better overall VPN connection using its second uplink to the Branch - London appliance's first uplink.
How are these metrics calculated?: The AutoVPN tunnel statistics presented in the per-peer SD-WAN monitoring page are calculated based on performance probes that are consistently sent across each established VPN tunnel.
Additional resources
Cisco Meraki has a variety of resources available for learning more about AutoVPN and SD-WAN: