Cisco SD-WAN Interconnects

Introduction
Cisco SD-WAN Interconnects is an automated workflow which enables administrators to easily configure, deploy, and monitor an interconnect between Cisco Catalyst SD-WAN and Cisco Meraki SD-WAN topologies.
Cisco SD-WAN Interconnects solves the complexity of managing multiple SD-WAN deployments by providing a central pane of glass within the Meraki Dashboard to manage and monitor interconnects.
Each interconnect will deploy up to 2 IPsec VPN tunnels which supports an eBGP peering session. Further, each interconnect has built in redundancy at the protocol and device level – thus allowing not just ease of use but confidence in a variety of scenarios.
Key Highlights -
-
Interconnecting Cisco Catalyst and Cisco SD-WAN VPN Fabrics
-
Redundancy built in with eBGP over IPsec
-
Monitoring from within the Meraki dashboard
-
An automated workflow allows for a seamless configuration within the Meraki dashboard
-
Created and managed entirely within the Meraki Dashboard
Supplemental Information -
This article references many elements which exist within the Catalyst SD-WAN Manager. For further information, please review the following knowledge article:
Cisco Catalyst SD-WAN Configuration Groups
Prerequisites
Devices must be collocated within an environment where reachability between MX and Catalyst WAN Edge devices does not cross the NAT Boundary.

For Meraki MX Network -
-
A MX Device operating in Concentrator mode
-
High Availability mode is also supported
-
If leveraging High Availability mode, the uplink configuration for the devices must be Virtual IP (VIP)
-
MX Firmware Version: 19.1+
For Catalyst SD-WAN Manager -
-
Cloud Hosted SD-WAN Manager
-
Catalyst SD-WAN Manager Version: 20.15+
Note: There is a 2 device per site limit. Supporting 3 or more devices per site within the Catalyst SD-WAN Manager is not possible currently. The interconnect site must only have 1 configuration group associated.
For Catalyst SD-WAN Devices -
-
IOS-XE Firmware Version: 17.15.x+
Functionality and Configuration
Meraki Dashboard and CDCS Manager Integration
By integrating the Meraki Dashboard with the Cisco delivered Catalyst SD-WAN Manager you are enabling the Meraki Dashboard to:
-
Push configuration via API to the Catalyst SD-WAN manager
-
Pull configuration via the API Catalyst SD-WAN Manager
-
Pull device information (monitoring) from the Catalyst SD-WAN Manager
This is done by an authorization process that generates a token within the Catalyst SD-WAN Manager. This token is then provided to the Meraki Dashboard allowing/authorizing configuration and monitoring push/pull actions.
Configuration
SD-WAN Manager Integration
From the Organization menu, select ‘Integrations’

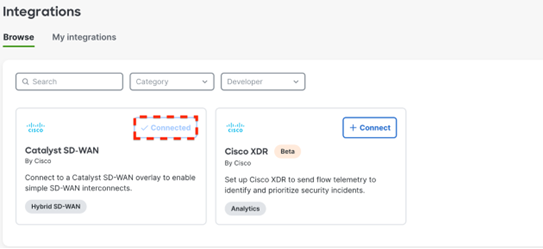
After reaching the integrations page, select ‘Connect’ for the Catalyst SD-WAN Option

Once you’ve select the ‘Connect’ option you will be redirected to id.cisco.com for sign in. Enter your credentials for the desired SD-WAN Manager to be connected.

After signing in you will be greeted by a page which shows your available overlays. Select the desired overlay and provide a name for the integration.

After completing your integration, validate that the Catalyst SD-WAN Option within the integrations page now shows as ‘Connected’

An integration can be removed by navigating to the following:
Organizations > Configure > Integrations > My Integrations > 'Your Integration Name' > Remove
Interconnect Configuration and Overview
Cisco SD-WAN Interconnects creates up to 2 route-based IPsec VPN Tunnels between up to 2 pairs of Cisco Meraki MX and Cisco Catalyst SD-WAN appliances. eBGP peering is then deployed over the IPsec tunnel to support dynamic routing capabilities between the autonomous systems. BGP Attributes are then leveraged to create deterministic and symmetrical routing.
Configuration
After performing the integration with Catalyst SD-WAN select the ‘Interconnects’ option from within the Organization overview page.

Once on the Interconnects page, select ‘Add Interconnect’

Provide a name for your Interconnect and select the Catalyst SD-WAN and Meraki SD-WAN Sites/networks to be interconnected.


Once you have selected the Catalyst SD-WAN Site to be interconnected some additional information will be required. Select the desired VPN (VRF) to be shared, which interface will be leveraged, and provide a BGP ASN if not already populated.
Note: The BGP ASN is automatically populated from the Catalyst SD-WAN Appliance if a BGP configuration already exists.

Finally, validate the populated information and select the ‘Next’ button to overview the deployment.

After selecting ‘Add interconnect’ the Meraki Dashboard will deploy the following configuration to the devices:
-
IPsec VPN Interfaces and tunnel configuration
-
EBGP router configuration
-
Route redistribution and BGP attributes
Once complete, you will be able to monitor the Interconnect from the ‘Interconnects’ page as well.
Automated Deployment Action(s) Breakdown:
Catalyst
The following configurations are deployed to the configuration group of the devices selected for interconnection. (Note: This must be a unique configuration group with no shared underlying features):
-
Up to 2x IPsec Tunnels
-
1x IPsec tunnel per Catalyst WAN Edge present at the Catalyst site selected to the Meraki network selected
-
Up to 2x eBGP Peering Sessions
-
1x eBGP session per Catalyst WAN Edge present at the Catalyst site selected to the Meraki network selected
-
BGP to OMP Dynamic Routing Translation
-
Propagate AS_PATH into OMP: Enabled
-
Auto-Translation of BGP AS_PATH to OMP Preference: Enabled
Meraki
The following configurations are deployed to the appliance(s) present in the network selected for interconnection:
-
Up to 2x IPsec Tunnels
-
1x IPsec tunnel to each Catalyst WAN Edge present in the Catalyst site selected
-
Up to 2x eBGP Peering Sessions
-
1x eBGP session for each Catalyst WAN Edge present in the Catalyst site selected
-
Creation of a ‘Primary’ and ‘Secondary’ tunnel via ‘Weight’ and ‘AS_PATH’ attributes. See below for weight.
-
AS_PATH – Tunnels configured to be ‘Secondary’ or ‘Standby’ shall receive a 1x AS_PATH Prepend for routes advertised from MX devices to Catalyst SD-WAN Devices. Prepending occurs at the MX.
-
eBGP Weight Attributes
-
Weight of 20 for Catalyst WAN Edge selected as Primary
-
Weight of 10 for Catalyst WAN Edge selected as Secondary
-
AS_PATH Prepending
-
1x Prepend for routes advertised to the Catalyst WAN Edge selected as Secondary
Monitoring
Monitoring of the following items is capable from within the Interconnects page of the Meraki dashboard
-
IPsec tunnel status
-
Current status
-
eBGP Session status
-
Historical status
-
Current status
-
Routes exported
-
Routes received
-
VPN Tunnel statistics
-
Bytes in/out
These items are represented in the screenshot below below:

Workflow Diagram

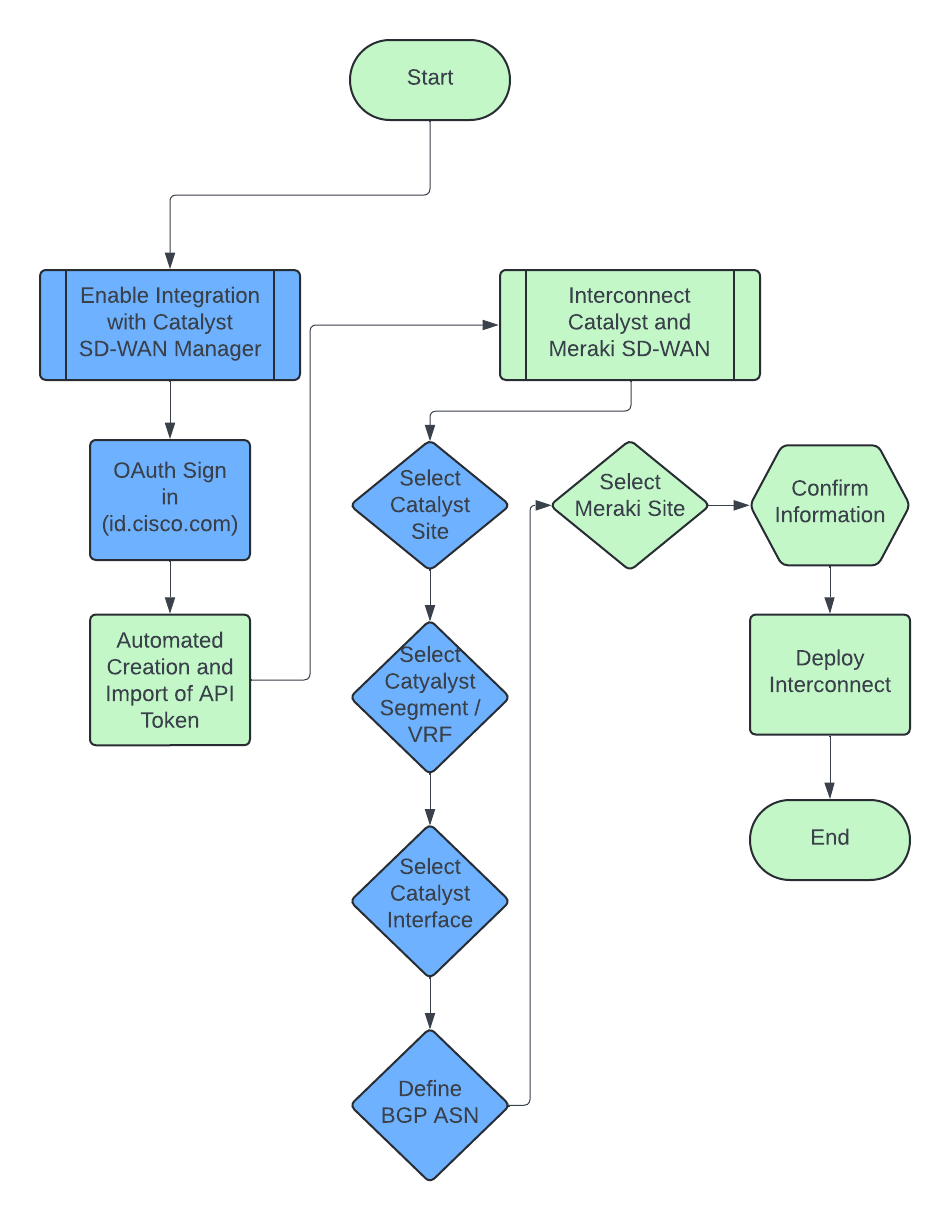
The above flowchart steps are recorded here -
1. Enable Integration with Catalyst SD-WAN Manager
- Navigate to the Meraki dashboard and from the Organization menu, select ‘Integrations’
- Then proceed to step 2
2. OAuth Sign in to id.cisco.com
- Enter your credentials for the desired SD-WAN Manager to be connected
- Then proceed to Step 3
3. Automated Creation and Import of API Token
- Select the desired overlay from the list and provide a name for the integration.
- Then proceed to Step 4
4. Interconnect Catalyst and Meraki SD-WAN
- Click on the “Add Interconnect” button from the Organization > Configure > Interconnects page
- Then proceed to Step 5
5. Select Catalyst Site
- Select the catalyst site you wish to interconnect
- Then proceed to Step 6
6. Select Catalyst Segment/VRF
- Select the desired VPN (VRF) to be shared
- Then proceed to Step 7
7. Select Catalyst Interface
- Select which interface will be leveraged
- Then proceed to Step 8
8. Define BGP ASN
- Provide a BGP ASN if not already populated
- Then proceed to Step 9
9. Select Meraki Site
- Select the Meraki Site you wish to interconnect
- Then proceed to Step 10
10. Confirm Information
- Validate the populated information is correct and select the ‘Next’ button to overview the deployment.
- Then proceed to Step 11
11. Deploy Interconnect
- Click on the “Add interconnect” button to deploy the interconnect
- End of integration workflow
Troubleshooting
Integrating Catalyst SD-WAN Manager to Dashboard
Engage Cisco Meraki technical support for further review. Upon doing so, please be prepared to provide the following information to ensure accurate and effective troubleshooting:
-
X-Request-Id header supplied of the failing request or of the POST /api/v1/organizations/<orgId>/extensions/jupiter/interconnects call.
-
Please include a timestamp when obtaining logs.
-
-
This can be found in the Developer console of your web browser
-
Error messages identified within the developer console of your web browser
-
Typically, these will be presented in red as 403, 502, or others.
-
To view this information, right click and “Inspect” the page, and navigate to the “Network” tab. The process will need to be reinitiated to capture the failed call.
On the Meraki dashboard, X-Request-Id will be present in two places:
- Organization > Integrations (Browse and My integrations)
- Organization > Interconnects
The examples below show how to obtain the X-Request-Id alongside other useful details present in HTTP calls.
1. Organization > Integrations (Browse and My integrations)
Start developer tools in your browser before performing any operation. Navigate to the Network section in developer tools and confirm that activities are being recorded.
For the Organization > Integrations page, the administrator can use the below filter in the URL search bar to focus on the important exchanges:
regexp:overlays|registration|deployedIntegrations
This regex example is provided for Firefox. If troubleshooting is performed in Chrome, the individual URL parts can be used instead.

The example below demonstrates the initial integration step when the list of overlays is returned to the Meraki dashboard. The overlay keyword has been used to filter the network activity.

Individual requests can be opened to collect X-Request-Id like shown in the below example:

2. Organization > Interconnects
For the Organization > Interconnects page, the administrator can use the below filter in the URL search bar to focus on the important exchanges:
regexp:/extensions/jupiter/|/dataservice/device|/dataservice/health|/dataservice/sites|configGroups|/dataservice/featureProfiles/
This regex example is provided for Firefox. If troubleshooting is performed in Chrome, the individual URL parts can be used instead.

Interconnect Deployment
Invalid InterconnectCreateJob: Interconnect already queued for this network
Cause: Active Deployment is currently ongoing
Remediation: Allow active deployments to complete. Validate within the Catalyst SD-WAN manager that deployments are not ongoing.
Remediation: Clear stuck tasks by retrieving the process ID from here:
https://<YourvmanageIP>/dataservice/device/action/status/tasks
and clear the task using this:
https://<YourvmanageIP>/dataservice/device/action/status/tasks/clean?processId=<process-id>
Service profile is not unique to the config group: <id>
Cause: The given catalyst sites’ config group’s service feature profile is being used by more than one config group. “Shared” Config Groups is greater than 1.
Remediation: Either remove the other config group, associate a different service feature profile to the config group, or create a new service feature profile for the config group before retrying.
Config group is not unique to the site
Cause: The catalyst site has multiple devices, and some devices are on different config groups.
Remediation: Both devices should leverage one config group.
More than two devices on Catalyst Site
Cause: More than 2 devices are present within the selected Catalyst SD-WAN Site
Remediation: Up to 2 devices may be present within the selected site. Adjust site as necessary.
<Device.uuid> failed to deploy: <reason>
Catalyst device deployment failed. Inspect latest logs on Catalyst SD-WAN Manager to begin debugging. Leverage Cisco TAC to identify remediation path.
Failing job due to deployment check timeout
A deployment will remain active/attempted for up to 30 minutes. If a deployment does not complete within that time it will be cancelled.
Remediation: Request the SD-WAN Manager task logs from the customer for the failed deployment to determine failure cause.
WAN Ethernet does not use device variables
Cause: WAN Ethernet parcel selected has global IPv4 settings defined or uses DHCP.
Remediation: Configure for static and/or device specific variables.
Other
Engage Cisco Meraki technical support for further review. Upon doing so, please be prepared to provide the following information to ensure accurate and effective troubleshooting:
-
X-Request-Id header supplied of the failing request or of the POST /api/v1/organizations/<orgId>/extensions/jupiter/interconnects call.
-
This can be found in the Developer console of your web browser
-
Error messages identified within the developer console of your web browser
-
Typically, these will be presented in red as 403, 502, or others.

