

How to Capture Wireless Traffic from a Client Machine
Overview
Wireless packet captures are useful when troubleshooting specific events on a wireless LAN (WLAN). The most common use case is to view all communication data, management, and control frames between a station (STA) and a Cisco Meraki MR access point (AP).
Capturing wireless traffic without dedicated hardware requires a Mac or a PC running Linux. If neither is available but additional Meraki MR access points exist on the network, collect wireless captures using the method described in Collect wireless captures when only Meraki Access Points are available.
Viewing wireless traffic is a two-step process:
- Put the wireless adapter in monitor or promiscuous mode.
- View the traffic using Wireshark in monitor mode.
Keep the following in mind before starting a capture:
- When capturing traffic in the 5 GHz band, configure the AP to use a 20 MHz channel width.
- When capturing wireless traffic on an SSID with encryption enabled (such as WPA2-PSK), start the monitor mode capture before associating the client to the SSID. Starting the capture first allows you to properly decrypt client traffic during later analysis.
- Where possible, create an open test SSID to simplify capture analysis.
- When capturing traffic on an end device, you can see Layer 3 (L3) packets because wireless network interface controller (wNIC) cards can map them. MR access points perform a monitor mode packet capture (PCAP), which does not include L3 packets. Dashboard monitor mode PCAP is passive and is better suited for observing authentication and association frames.
The following free online training courses are available on the Meraki Learning Hub:
Step-by-step instructions
Monitoring on macOS (Sierra and High Sierra – 10.12.x and 10.13.x)
- Disconnect from all networks, including wired connections
- Hold the Option key and click the wireless icon in the upper-right corner of the screen. Holding the Option key reveals a hidden menu option.

- Select Open Wireless Diagnostics…
- In the Wireless Diagnostics window, go to Window in the upper-left menu bar and select Sniffer.

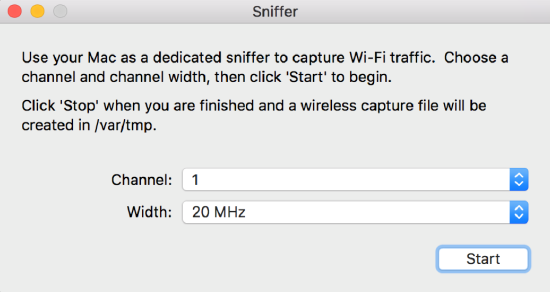
- Select the appropriate channel and channel width for the capture.
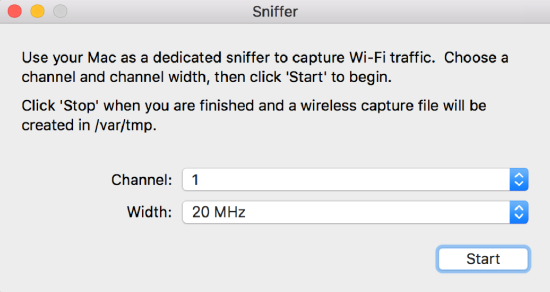
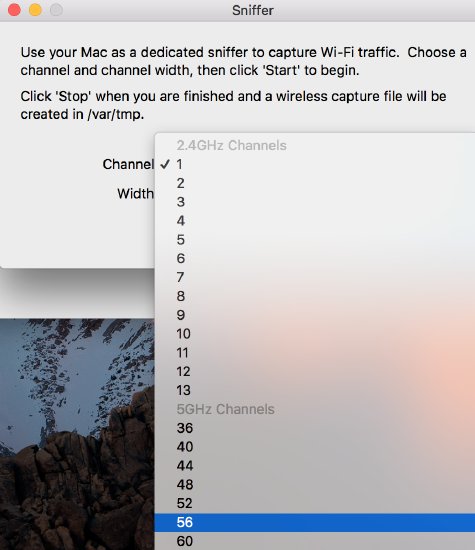
Use 20 MHz channel width to capture all traffic from the AP and avoid frame drops due to channel bonding.
- Click Start. The capture saves to /var/tmp.
- Stop the capture after you have recorded the target event.
- To locate the capture file, open Finder and select Go > Go to Folder.

- Enter /var/tmp and click Go.

- Open the monitor mode capture file from the folder.

Monitoring on macOS (Yosemite – 10.10.x)
- Open Wireless Diagnostics from Spotlight (Command + Spacebar, then search for "Wireless Diagnostics").

- On the Introduction page, press Command + 6 to open the Sniffer. On macOS 10.9 Mavericks, press Command + 2, then go to the Frame Capture tab.

- Select the channel and channel width that match the channel used by the client and AP you want to monitor, then click Start.
- Confirm the AP is using 20 MHz channel width and select 20 MHz in the Sniffer menu. Using a wider channel width can result in incomplete capture data.
- While the capture is running, the eye icon appears over the wireless icon in the menu bar, indicating the interface is in monitor mode.

- You can view the capture live in Wireshark running in monitor mode. The capture is also automatically saved as a temporary .wcap file on the desktop.
- To open the capture file in Wireshark, rename the file extension from .wcap to .pcap, then open the file in Wireshark.
- To end the capture, click Stop.
Monitoring on Linux
Installing and identifying interfaces
- Install the aircrack-ng package. Once installed, aircrack-ng provides the airmon-ng and airodump-ng utilities. If you are using Kali Linux, aircrack-ng is likely already installed.
- Identify your wireless interface by running airmon-ng without any arguments. Other methods to identify interfaces include:
- Run ip link or iw dev on modern Linux distributions.
- Run iwconfig on older Linux distributions.

Starting monitor mode
- Run the following command, replacing [interface] with your wireless interface name and [channel] with the channel you want to capture: airmon-ng start [interface] [channel]. The channel argument is optional, but specifying it helps ensure you capture traffic on the correct channel from the start.
- If airmon-ng alerts you that processes need to be stopped before monitor mode can start, run: airmon-ng check kill. Then attempt to start monitor mode again. You can also stop individual processes using their process identifier (PID) with the command kill [PID].
- When monitor mode is enabled, airmon-ng creates a new interface with -mon appended to the original interface name (for example, wlan0mon).
![Screenshot of a linux terminal after entering the command airmon-ng start [interface] [channel]](https://documentation.meraki.com/@api/deki/files/29810/airmon-ng_start_interface_channel.png?revision=1)
- If airmon-ng states that some services could cause a problem, you'll need to stop them. Stop the capture by running airmon-ng stop [interface].
- If airmon-ng indicates that there are interfering processes, find the processes and kill them with the command kill [PID]:
.![Screenshot of a linux terminal after entering the command airmon-ng stop [interface].](https://documentation.meraki.com/@api/deki/files/29812/airmon-ng_stop_interface.png?revision=1&size=bestfit&width=620&height=155)
- Run airmon-ng check kill to check for processes then kill them automatically.

Stopping monitor mode
- Run airmon-ng without arguments to list current interfaces and identify the monitor mode interface name (it will have -mon appended).
- Run the following command to stop monitor mode, replacing [interface] with the monitor interface name: airmon-ng stop [interface]
- If you have difficulty reconnecting to a network after stopping monitor mode, restart NetworkManager and any other processes that were stopped.
For example systemctl restart NetworkManager
Using Wireshark in monitor mode
Once the wireless card is in monitor or promiscuous mode, you can view captured traffic live using Wireshark in monitor mode.
The screenshots in the current draft were taken using a pre-v2.0 version of Wireshark. To enable monitor mode in newer versions of Wireshark, refer to the Wireshark Wiki.

To start a live capture in Wireshark:
- Open Wireshark.
- Select the appropriate interface — en0 on Mac or mon0 on Linux.
- Enable monitor mode for the selected interface.
- Start the capture.
Once the capture starts, 802.11 frames begin populating the screen. Because Wireshark does not apply coloring rules to 802.11 traffic by default, these frames appear white.

Additional resources
For information about decrypting 802.11 traffic in Wireshark, refer to How to Decrypt 802.11.