
Client360 - Cloud
Overview
The primary responsibility of a network administrator is to ensure users have an excellent and seamless network experience, whether connected wirelessly or via a wired connection. This includes ensuring users can connect to the network, maintain connectivity, access their applications, and experience optimal performance end-to-end.
The goal is to enhance the client details page for wireless, wired, and remote clients to provide a clear, comprehensive view of their experience across onboarding, connectivity, and performance. This includes improved workflows that offer context over time, identify recurring issues, show if other clients face similar problems, and guide users to the correct dashboard tools with precise filtering for the issue’s timeframe.
Key issues with the current page:
- Lack of context makes it hard to identify recurring issues or root causes.
- Users are forced to navigate multiple tabs, complicating troubleshooting.
- Context is lost when transitioning between pages (e.g., from Assurance Overview to client details).
Vision for Improvement:
- Provide an at-a-glance view of the client's current state, including onboarding issues and root cause pathways.
- Onboarding issues are: Association, Authentication, DHCP and DNS problems.
- We also include Application performance from our existing ThousandEyes integration via the Active Application Monitoring feature.
- Consolidate key metrics (e.g., onboarding status, IP, application reachability, performance) into a clear, actionable format.
- Seamlessly integrate workflows (top-down and bottom-up) to maintain context across pages.
Licensing
Meraki: None
ThousandEyes : Subject to the licensing requirements for the Active Application Monitoring feature.
Features
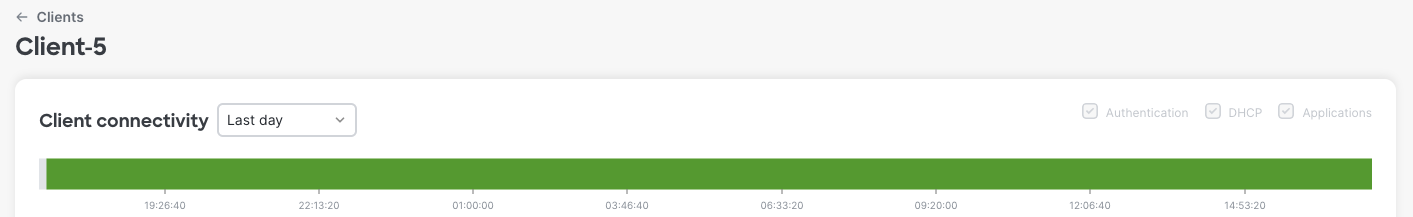
Client Connectivity Timeline
The new client connectivity timeline captures the client connection to the network over the timeframe selected on the page. Our current lookback time is up to a week. For wireless clients, if it has been seen for the last 5 minutes, we consider it to be connected, otherwise disconnected. For historical data, we use the Client Timeline events and if there’s an entry for a disconnection, it will be reflected on the timeline as well.
For wired clients, the current and historical status is captured by its usage data, so if there’s no usage as detected by Dashboard, we consider the client disconnected.
The client timeline also includes status pills that reflect the status of the data and the client being looked at. The pills are:
- Client data type: It can be either “Historical” or “Current” depending on whether the information is the current client data or from a historical event.
- Client Status: “Online” or “Offline” as determined based on the client connectivity timeline.
- Client Type: “Wireless”, “Wired” or “Remote”, based on the type of client selected.
- Wired clients are those connected via a cable to an switch or appliances
- Remote clients are ClientVPN/Anyconnect clients.
Main and Correlated Events
To display onboarding issues, Client360 – Cloud use the concept of Main and correlated events:

Main Events: They will populate the Client Timeline, and they reflect every onboarding issue experienced by the client when trying to connect to the network. The source for Main Events are:
- Network Alerts
- Event Logs
- Wireless Client Timeline, only for Wireless clients

Main Events are designed to filter out identical client events, helping to reduce timeline "noise" and improve clarity. Identical events are defined as if they are of the same type, associated with the same device, belong to the same category, and occur within 10 minutes (inclusive) of the first matching event.
Main events can be clicked on to bring correlated events into view
Correlated Events: They will NOT populate the Client Timeline. They will only be shown as a sub event under the main events timeline. Correlated events aim to represent plausible sources or triggers that can cause the main events. They are also sourced from Network Alerts and Event Logs.

Events are determined based on the devices involved in the client’s connection path at the time of the selected main event. For example, if a main event is selected with a timestamp of 12:10 PM, the connection path is calculated at that time, and those devices are used to query related events.
By default, events span a 10-minute window:
- Start Time: 8 minutes before the event timestamp
- End Time: 2 minutes after the event timestamp.
Correlated events are clickable, and they can redirect to either the Event Log page or the Alert side drawer depending on the type of event selected.
Client Topology
The new client topology section captures both live and historical connection information. The historical data is automatically accessed and shown once a past Main event is selected on the Client Connectivity timeline.

The devices on the new topology view are clickable, and they provide specific information depending on the type of device selected. Please note that the amount of data shown for each device varies as not all their live metrics are stored for historical view.
The Application icon is only available if the Meraki + ThousandEyes integration is activated for the client network.
When clicking on the Application icon, we show information about application outages and whether they impact the current client and other.
