
Clients Usage Page Overview
Click 日本語 for Japanese
Introduction
The Clients usage page tracks clients connected to your Cisco Meraki network across Cisco Meraki MR access points, MX security and SD-WAN appliances, and MS switches. The page provides a customizable interface for filtering specific device types and traffic, showing how the network is being used and by which client devices.
To view the Clients usage page, go to Network-wide > Monitor > Clients in the Meraki dashboard.
Learn more with this free online training course on the Meraki Learning Hub:
Prerequisites
Before using the Clients usage page, confirm the following:
-
Your network includes at least one MR access point, MX security and SD-WAN appliance, or MS switch.
-
Client devices have passed traffic on the network — devices that have not passed traffic do not appear in the clients list.
-
To add clients manually, you must have Organization Administrator permissions in a wireless or combined network.
-
To export client data in XML or Comma-Separated Values (CSV) format, the client must have an Internet Protocol version 6 (IPv6) address.
For full Apple analytics visibility on iOS/macOS 26+ devices, your MR access point must be running firmware version MR 33.1.1 and the client must be connected to 802.1X Service Set Identifier (SSID).
Step-by-step instructions
The following sections cover individual configuration tasks — complete only the task relevant to your needs.
Navigating the clients list
To get started navigating the Clients usage page, follow these steps:
-
Status: Review the status column and verify if clients are currently active, as illustrated in this screenshot below.
-
Icon colors: Green icon indicates status is online. Grey icon indicates that status is offline.
-
Icon connection type: If using the combined dashboard view, the client will display the type of connection (wired or wireless).
-
Activity threshold: if a client does not pass traffic for longer than one minute, the client is no longer considered active.

-
Last seen: Review this column for the most recent client activity.
-
The column displays the date and time when the client was last seen on the network.
-
IP address and MAC address: review these columns if SSIDs are using Meraki DHCP.
-
Clients are identified by IP address rather than MAC address. Multiple entries for a single client will have the same MAC address with different IP addresses.

Filtering clients
-
Navigate to Network-wide > Clients.
-
Use the drop-down menus at the top of the page to customize the client list.
-
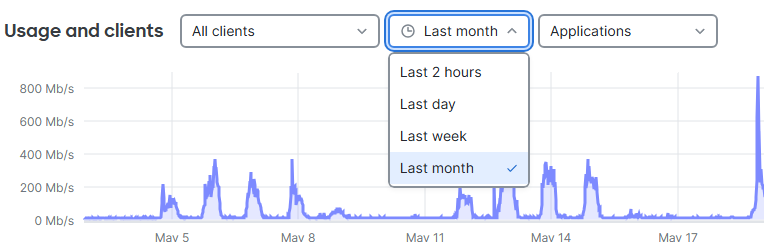
To filter clients by time interval, select one of the following options from the Time interval drop-down menu:
-
Last 2 hours
-
Last day
-
Last week
-
Last month
-
-
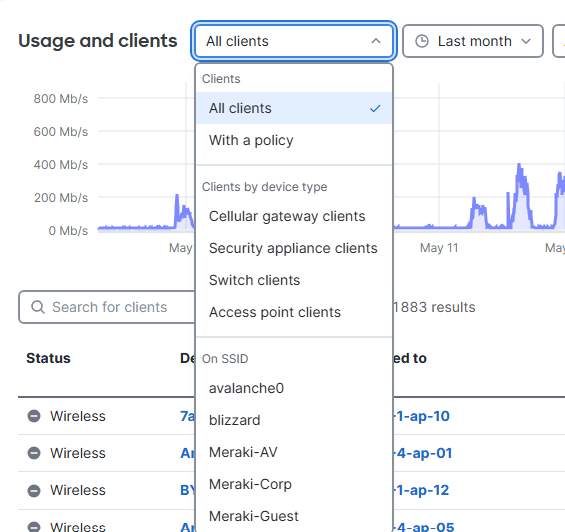
To filter clients by access type, select the appropriate option from the All Clients drop-down menu.
-
To filter clients by SSID, select the desired SSID from the All Clients drop-down menu.
-
To further refine the results, select a traffic classification from the Applications drop-down menu.
You can also filter the clients list by:
-
A specific device type, such as wireless or switches
-
A specific SSID (wireless only)
-
A policy applied to clients, such as (allow listed, blocked, or group policy)
Searching for clients
Use the search tool to find a client in the current client list. The search tool attempts to match your query across all fields.
- Navigate to Network-wide > Clients.
- In the Search for clients field, enter a search term to find a client in the current client list.
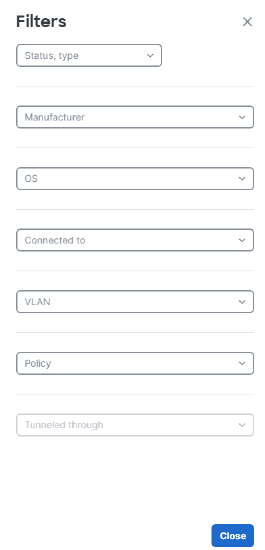
- To refine the search, click Filters.
- Select one or more search parameters, such as:
- Status, type
- Manufacturer
- OS
- Connected to
- VLAN
- Policy
- Tunneled through
- Specify the desired filter values.
Modifying columns
-
Navigate to Network-wide > Clients.
-
Click the gear icon in the client list table.
-
In the Column settings pane, select or clear the check box next to a column to show or hide it.
-
To reorder columns, drag a column to the desired position.
-
To pin or unpin a column, use the pin icon next to the column name.
-
Click Apply to save the changes.
Optional:
-
Click Reset to default to restore the default column configuration.
-
Click Cancel to discard the changes.

Client details
Click a device in the client device list to view additional information, including network usage, MAC address, IP address, and hostname. For more information, refer to Client Details Page Overview Documentation.

Managing clients
The Clients page offers several options to manage your clients, individually or in bulk, as outlined below:
Changing the policies applied to a client
You can change the policy applied to a client or group of clients from Network-wide > Monitor > Clients in the dashboard. Clients can be assigned normal, allow listed, or blocked access. You can also apply Group Policies and apply different policies based on the SSID the client is connected to. For more information, go to the Block Listing and Allow Listing Clients documentation documentation.
Group Policies apply to MR access point, and MX clients only. MS switches cannot apply group policies to a client.
To change the policies applied to a client:
-
Check one or more clients in the client list.
-
Click the Policy button.
-
Select your desired policies.

4. Click Apply.
Adding a client
The following steps below explain how to add a client. These steps are only available for Organization Administrator in wireless and combined networks.
To add a client to the client list:
- Select the Add client button.
- Fill in the client's name, MAC address, and access policy. The image below shows the Add new devices tab:
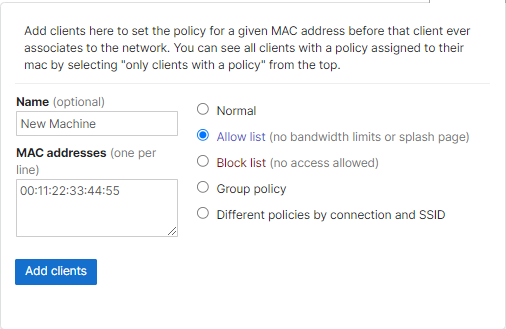
- Click Add clients.
When adding a client, note the following:
-
If the Normal policy is applied, the client does not appear in all clients view until it has connected to the network.
-
If any non-Normal policy is applied, use the All clients with a policy view to see a client that has been manually added but has not yet joined the network.
Exporting client information
To export client data from the Clients page:
-
Go to Network-wide > Monitor > Clients in the dashboard.
-
Click Download as.
-
Select either XML or CSV as the export format.
The export feature is only available for IPv6 logs and is only active if the client has an IPv6 address.
Verification
After completing a task on the Clients usage page, confirm the following to verify the action was successful:
-
Client visibility: Confirm that client devices appear in the clients list after passing traffic. Devices that have not passed traffic do not appear.
-
Active status: Confirm that active clients display "now" in the Last seen column. Inactive clients display a grey status icon.
-
Policy changes: Confirm that policy changes applied to a client are reflected in the clients list. Allow listed or blocked clients will display the updated policy in the list.
-
Manually added clients: Confirm that a manually added client with a non-Normal policy appears in the All clients with a policy view.
-
Exported data: Confirm that the downloaded XML or CSV file opens correctly in a spreadsheet program such as Microsoft Excel and contains the expected client data.
-
Apple analytics (MR 33.1.1): Confirm that Apple devices running iOS/macOS 26+ and connected to an 802.1X SSID display client details in the dashboard after upgrading to MR 33.1.1 firmware.
Troubleshooting
Only one client device appears in the clients list
If a Layer 3 switch or router is present on the LAN side of an MX, only one device appears on the Clients page, even if multiple computers or devices are connected through that device.
The MX tracks client devices based on their MAC addresses, making client devices discoverable at a Layer 2 level. To address this behavior, review the available client tracking options in the Client Tracking Options document.
Client is offline but shows as active with an online status
Clients list data is aggregated over time and is not live, so there is a slight delay in a client's online or offline status. The data refreshes automatically every few minutes.
-
Wired and Client VPN clients that transferred data in the past 5 minutes should appear online — verify that the Last seen timestamp is within the last 5 minutes to confirm the client reflects the correct status.
-
Wireless clients' online or offline status depends on their association to a Meraki wireless network.
Clients list displays zero usage for a client passing traffic
To ensure useful data usage and traffic analysis, certain types of client traffic are filtered and not counted toward network usage. Usage information is recorded differently depending on the network layer the client is operating at.
Traffic types that are not counted include:
-
Unauthorized clients (for example, clients unauthorized by Remote Authentication Dial-In User Service (RADIUS), or clients operating behind a Splash or Captive Portal)
-
Domain Name System (DNS)
-
Dynamic Host Configuration Protocol (DHCP)
-
Address Resolution Protocol (ARP)
Wireless clients will display as “connected” with zero usage if the access point confirms they are associated, but the traffic type is not counted. This behavior does not apply to switch clients.
Network usage does not match usage on the clients page
The network usage shown on the device details page may not always match the usage shown on the Clients page:
-
The device details page includes only outgoing traffic from that particular device, such as internet traffic from an MX.
-
The Clients page may also include internal traffic that does not leave the network, such as inter-VLAN traffic or local camera streaming.
Additional information
Clients usage page features
The Clients usage page includes the following features:
-
A summary graph displaying network bandwidth usage and how it has fluctuated over a given time span
-
A list of connected clients
-
A search function for clients by MAC address, operating system, device type, or NetBIOS/Bonjour name (see Section 5.4, Searching for clients)
-
Zoom control to view only clients connected within a specified time span, adjustable by selecting 2 hours, Day, Week, or Month
-
A customizable client device list with a variety of available information columns — sort columns by clicking a column header, and add or remove columns by clicking Columns and shifting options in or out of the Displayed columns window
-
A usage graph line that appears when you mouse over a row in the device list, depicting the fraction of total bandwidth that the highlighted device used
-
An option to export list data in Extensible Markup Language (XML) format by clicking Download as XML — most spreadsheet programs such as Microsoft Excel can open an XML file
(MR 33.1.1) Apple analytics and WPA3 in solicited beacon
Overview
MR access point (AP) firmware version MR 33.1.1 introduces updates to address changes in how Apple devices share analytics and client details on wireless networks. With the release of iOS/macOS 26+, Apple has tightened privacy controls, requiring a shift in how the infrastructure requests telemetry data.
The challenge
Apple devices previously provided unsolicited beacon reports. With iOS/macOS 26+, Apple has introduced the following changes:
-
Solicitation required: Apple devices now only send device analytics when they receive a solicited beacon request from an access point (AP) broadcasting an 802.1x SSID.
-
Network restrictions: Devices running iOS/macOS 26+ no longer send device information on non-enterprise (non-802.1X) networks.
-
Visibility gap: Without these firmware updates, network administrators face significant limitations in monitoring and managing Apple hardware connected to 802.1X SSIDs.
Technical changes and implementation
To maintain visibility and support for Apple analytics — specifically for Wi-Fi Protected Access 3 (WPA3) and iOS/macOS 26+ — the following firmware adjustments have been made:
-
802.11k behavior update: The 802.11k beacon measurement request behavior has been modified so the infrastructure actively solicits reports from devices that no longer provide them automatically.
-
802.1X enhancement: MR 33.1.1 firmware enables connected Apple devices on an 802.1X SSID to securely share client details through these solicited channels.

Additional resources
For more information about the Clients usage page, review the following resources: