
Organization Alerts and Alert Hub
Overview
This article describes the alert hub and organization alert page use case, different functionalities, and its use for monitoring and troubleshooting.
There are several different features or functionalities that make the monitoring and troubleshooting Cisco Meraki full-stack solution simple. Dashboard alerts, event logs, and the ability to quickly sort event logs based on device types, event types, and timestamp are among those features. And the number of these alerts or event logs will continue to grow as we continue to add new features or bring more visibility into overall network health. However, it is challenging to keep track of all of them and know which one to check first under certain circumstances. It can also be time-consuming to find and learn more about these alerts and event logs.
The alert hub and the organization alert page bring more convenience by accumulating dashboard alerts in a single place. By linking relative documentation that can help users find alert triggers and troubleshooting steps, it reduces time to resolution.
Learn more with these free online training courses on the Meraki Learning Hub:
Alert Hub
Alert hub consolidates all the alerts from a single dashboard network.
Location
The alert hub is located in the top right corner of the dashboard. It is a network-wide feature, so this feature is not available on any pages under “Organization".
![]()
Clicking on the icon will show a popover summary of network alerts.
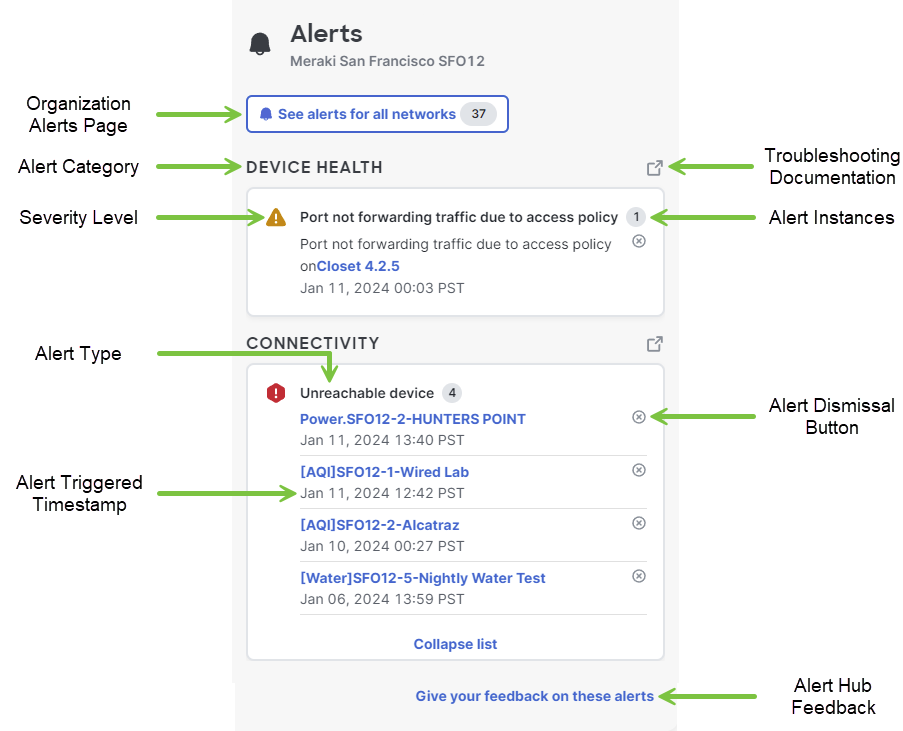
- Organization Alerts Page: Lists summary of alerts across all networks within your given organization.
- Alert Category: Organizes alerts by category, such as device health, connectivity, insights, etc.
- Troubleshooting Documentation: Allows for easy access to documentation on dashboard alerts.
- Severity Level: Displays the severity level of the alert.
- Alert Instances: Displays the number of times the given alert has been triggered.
- Alert Type: Displays the type of alert triggered.
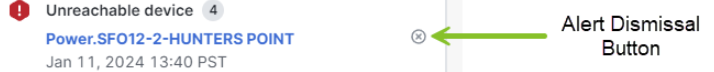
- Alert Dismissal Button: Dismisses the alert from Alerts hub.
- Alert Triggered Timestamp: Displays the time and date the alert was triggered.
- Alert Hub Feedback: Provides an opportunity for user feedback to be reported directly to our software team.
Organization Alerts Page
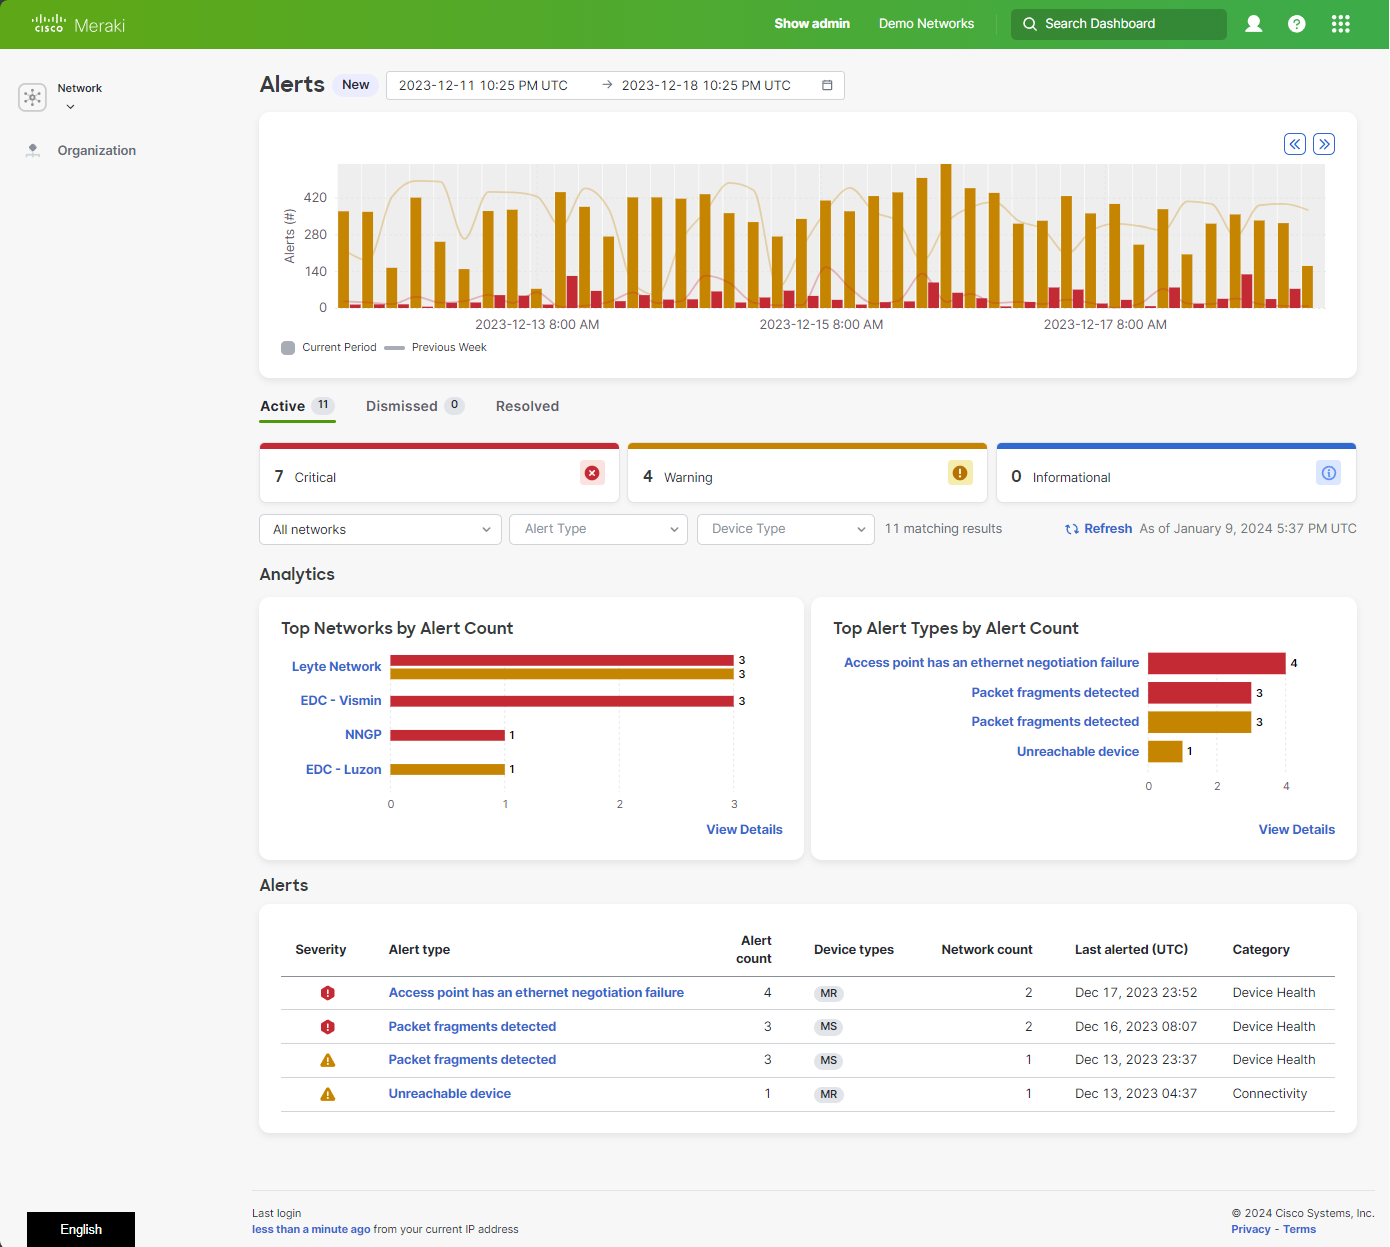
The organization alert page displays a timeline/trend line, analytics graphs, and all dashboard alerts of an organization in a single place.
Location
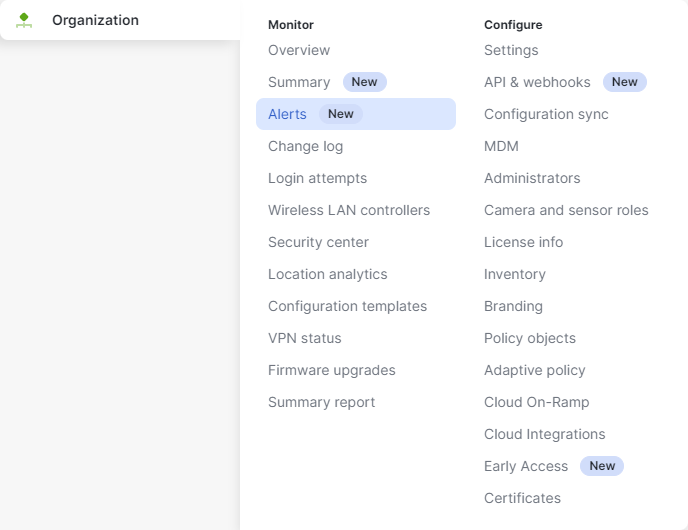
The organization alert page is located under Organization > Monitor > Alerts.
Alert Categories
The alert hub categorizes alert types into four different categories based on the nature of the issue that triggers them. Direct cross links allows for quicker research in the Knowledge Base for details about the alerts.


Configuration Issues - These issues are triggered if the current setting or configuration differs from Cisco Meraki recommendation. (e.g: VLAN mismatch, Stack misconfigured, etc)
Connectivity Issues - These issues are triggered if there are problems in connectivity between devices/services. (e.g: Device unreachable, 802.1X failure, etc)
Device Health Issues - These issues are triggered if a device detects problems with its primary or auxiliary systems. (e.g: fan failure, power supply offline, etc)
Insights - These issues are triggered if Cisco Meraki detects problems with LAN/WAN services. (e.g: Sticky client on APs, ISP outage, etc)
Cisco Meraki might add more categories if needed to accommodate more alerts in the future.
Alert Severity
There are several alert types under each category. All the devices with the same alert type will be listed together in their respective alert type card.
Different colors are used for visual indication of severity levels as following:
-
 Warning : Yellow - alerts that need attention, but are not imminently critical to network performance/communication.
 -
 Critical : Red - alerts that indicate a critical failure has occurred or imminent failure is likely soon.
 -
 Dual : Yellow/Red alerts that posses variable severity, alert has 2 (two) thresholds and will trigger appropriate severity as thresholds are crossed
 -
 Informational : Blue - a non-critical alert that provides information about an event or status change without requiring immediate action.
Instances: This is only applicable to the alert hub. A single occurrence of an alert is considered as one instance. For example, an unreachable device under “Unreachable Device(s)” alert type is regarded as one instance. If there is more than one device unreachable then the list of devices/instances will show up under the same alert type. Count of devices/instances are shown next to the alert type.
Bundled Alerts
Bundled alerts are contextually linked to the time range filter at the top of the page, for more information see Alert Filters section below
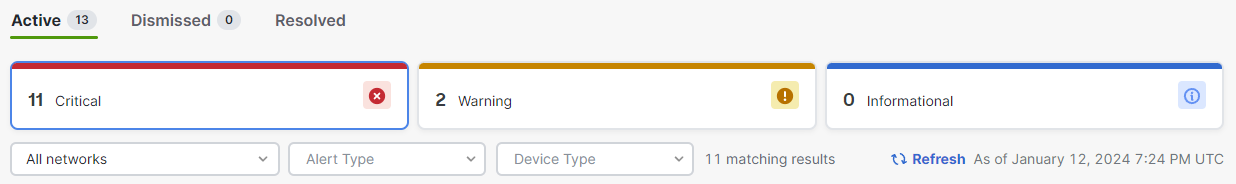
Active Alerts
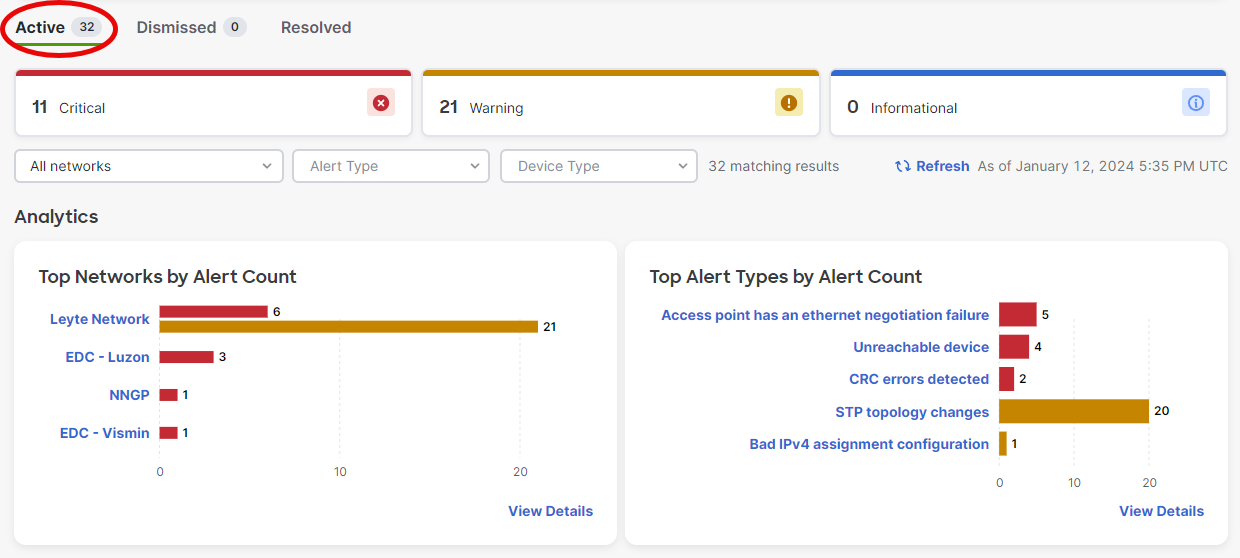
The “Active” tab lists active (initiated within time range) dashboard alerts in an organization
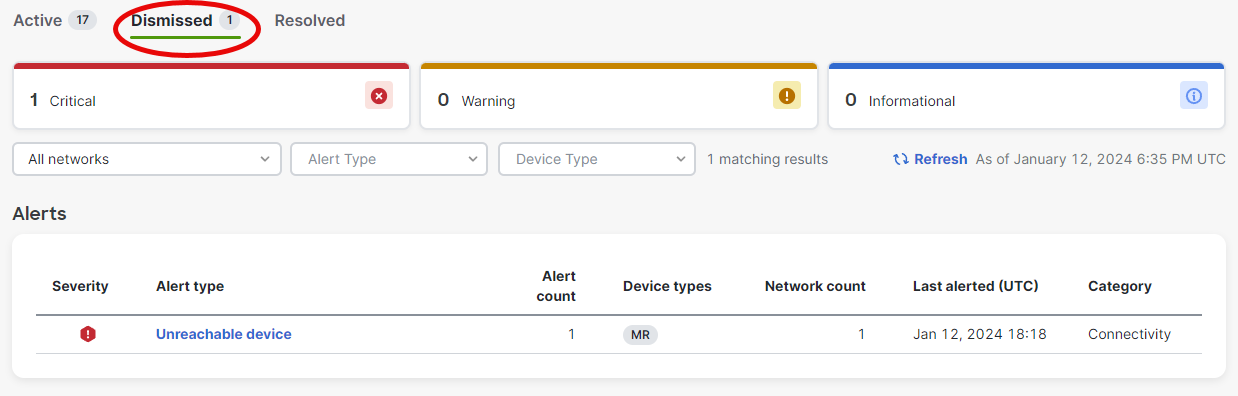
Dismissed Alerts
When alerts are dismissed either in the Alert Hub or in Organization Alert Page, they will be bundled and displayed in the Dismissed bundle tab
Dismissing an Alert
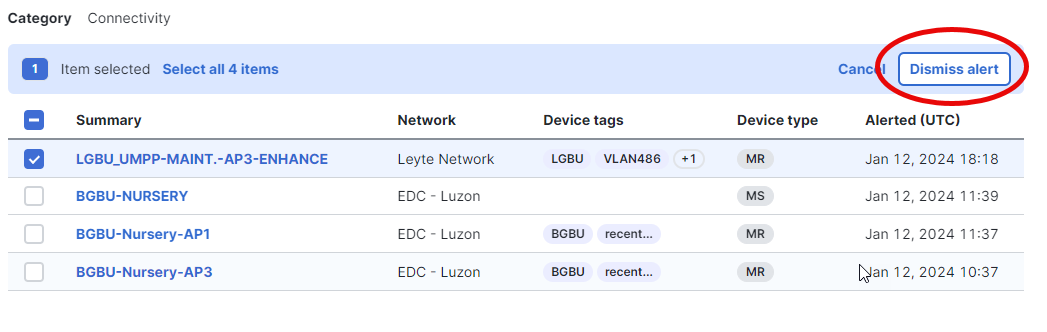
There are two (2) methods for dismissing an alert from the Dashboard, depending on your administrative rights. At the network level from the Alert Hub (as previously shown above) and from the the side drawer in the Organization Alert Page itself.
Alert Hub:
Organization Alert Page - Side Drawer:
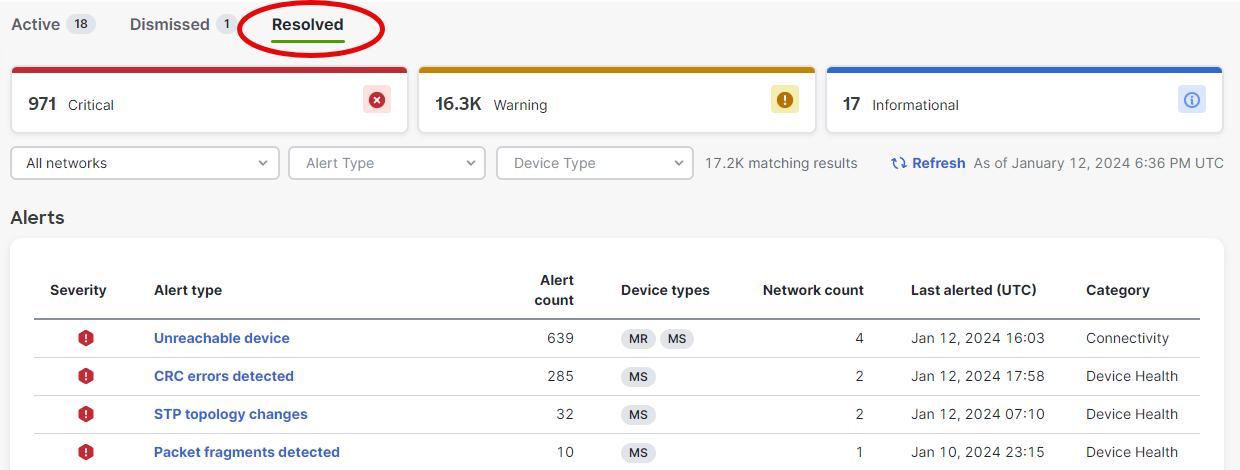
Resolved Alerts
When alerts are resolved they will be moved to the Resolved tab
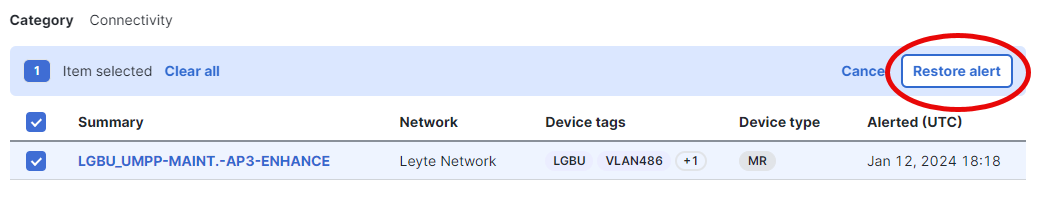
Restoring (Dismissed) Alerts
With Administrative rights, alerts can be restored to the active alert tab, from the Dismissed Alert side drawer. This can be useful if an alert is dismissed by accident.
Alert Filters
Filters are only available for the organization alert page. The time range filter is at the top of the page next to the Alert page title. This filter modifies the context of the entire page for the time range selected.

Important note: All selections, with the exception of All time, show alerts that were initiated within that time frame. All time shows all active alerts regardless of when they were initiated. This is the expected behavior. Last 2 hours is the default selection.
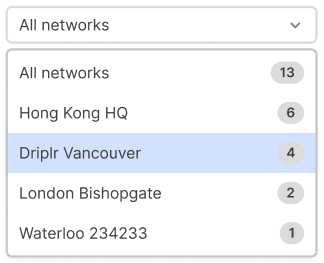
Network filters
This dropdown filter allows administrators to view alerts of a single network or all networks.
Alert and Device Type filters
The alert type filter allows administrators to filter by certain alert types. The device type filter allows administrators to filter by a certain device type (MX, MR, MS, etc.)

No Alerts Indicator
Depending on the filters selected, no alerts may be seen from this page. Ensure to utilize the Time Range filter when viewing alerts from the Alert Hub as an active alert may have originated before the Time Range filter currently selected.
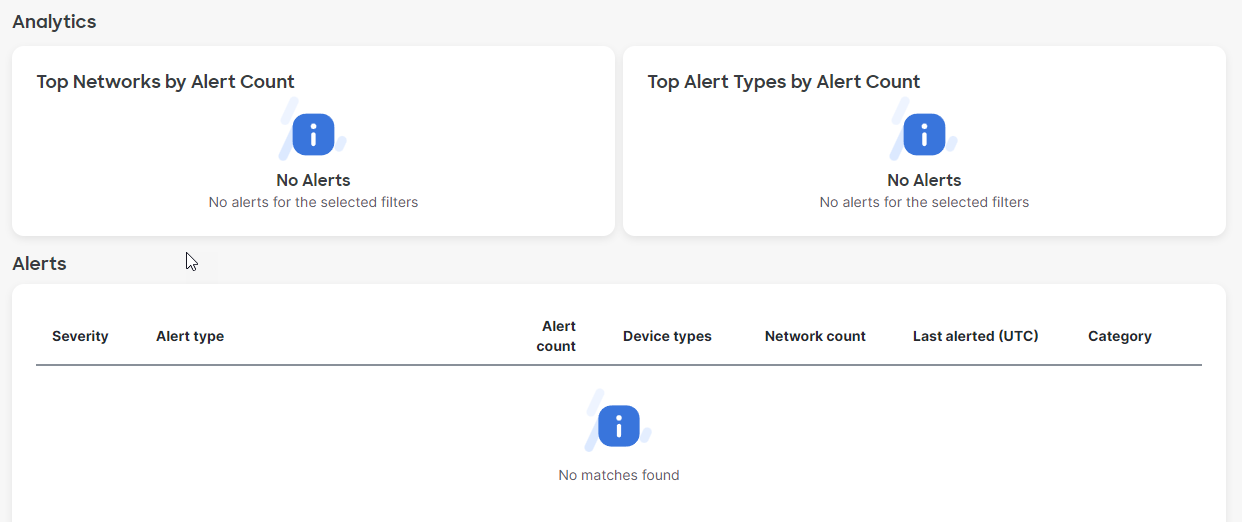
If the organization alert page and the alert hub are not showing any alerts that does not mean that there are no active alerts in the network. Please note that not all the alerts or event logs are available in the alert hub. For the list of available alerts, please refer to the individual alert category documentation hyperlinked in the alert category section of this document.
Feedback
There is a "Give your Feedback" and "Give feedback about these alerts" buttons on the organization alert page and the alert hub respectively which administrators can use to provide feedback on the feature.

Give your feedback button might not work with a few select ad blockers. If you would like to provide feedback please disable ad blocker temporarily.