
Dashboard Alerts - Device Health
Overview
This document list all the alerts available under "Device Health" alert category and their triggers and troubleshooting steps. Please refer to network alert hub documentation to learn more.
Power Supply Offline
Triggers
If one of the power supplies of the switch is connected, but it is offline or not powered on.
Troubleshooting Steps
- Make sure both power supplies are receiving power. Check the power outlet to make sure it is providing power.
- Reset the power supply and reboot the device.
- If the issue persists, contact Meraki support for further troubleshooting steps.
Redundant Power System Down
Triggers
If the redundant power system is connected but offline or powered off.
Troubleshooting Steps
- Make sure the redundant power supply is receiving power. Check the power outlet to make sure it is providing power.
- Reset the connection between the redundant power supply and the switch. Reboot the switch.
- If the issue persists, contact Meraki support for further troubleshooting steps.
Switch Using Backup Power
Triggers
When the switch is not using the connected redundant power supply.
Troubleshooting Steps
- Make sure the redundant power supply is receiving power. Check the power outlet to make sure it is providing power.
- Reset the connection between the redundant power supply and the switch. Reboot the switch.
- If the issue persists, contact Meraki support for further troubleshooting steps.
Fan Failure
Triggers
If one or more fans are connected but not functioning properly.
Troubleshooting Steps
- MS250 and below models typically operate without a fan. However, if the switch supports PoE, it may have an internal, non-replaceable fan. MS350 and above models have Hot Swappable fans.
- Ensure the fan's ventilation is not obstructed
- For models that support Hot Swappable fans -
- Check if the Fan LED light on the switch shows an orange light. An orange light means there is a problem with the fan operation
- Try reseating the fan to ensure it is properly connected.
- If reseating does not resolve the issue, insert the fan into a different slot within the same switch. This helps determine if the problem lies with the fan itself or the original slot.
- Attempt to reboot or factory reset the switch.
- If all previous steps fail, please contact Meraki Support for further assistance
STP Topology Changes
Triggers
STP change alerts are created whenever a high or very high rate of STP topology change notifications (TCNs) are detected or received on a switch port. TCNs are triggered when a switch detects changes in the topology.
Troubleshooting Steps
Historical STP topology changes can be found on the port connectivity bar.

It is important to know that a Cisco Meraki switch port alerts for STP topology change only when it receives TCN BPDUs.
Some of the common root causes of STP topology changes are as follows:
- Port flaps between 2 switches. It can happen if the cable is faulty.
- Delay in sending or receiving BPDUs due to high CPU usage or packet loss.
- STP BPDU conflicts when multiple BPDUs are received within a small window that identifies different sending ports.
This section mentions only a few events as the root cause of the topology change notification, but there can be other root causes. Please work with Cisco Meraki support if you cannot determine the root cause.
CRC Errors Detected
Learn more with this free online training course on the Meraki Learning Hub:
Triggers
There are 2 types of CRC errors:
- High CRC errors: A port is sending or receiving a high amount (greater than 100 hits/hour or greater than 1% of traffic) of CRC align errors.
- Very high CRC errors: A port is sending or receiving a high amount (greater than 1000 hits/hour or greater than 10% of traffic) of CRC align errors.
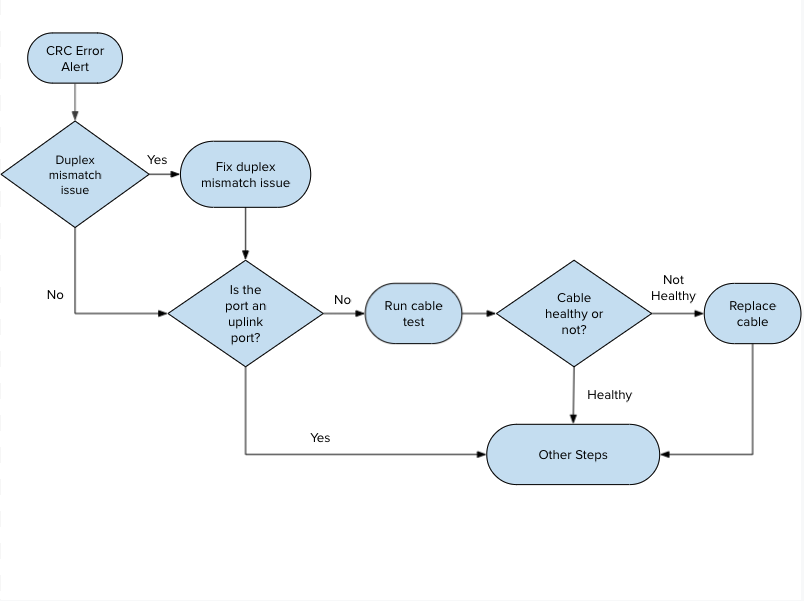
Guided Troubleshooting Flow
This feature is designed to reduce troubleshooting effort, make issue resolution more intuitive, and save more time for our customers. Guided CRC troubleshooting flow automates and outlines suggested action items (refer to flow diagram and the short video below) to be performed to resolve CRC error alerts. This tool is designed to help network administrators efficiently and effectively identify the root cause of the CRC error on switch ports and resolve it.
|
|
|
| Configuration Mismatch issue | Cable and other issues |
 |
 |
Note:
-
This feature is in BETA so to report any issues please use the “Give feedback about this alert” located inside the troubleshooting side panel.

Troubleshooting Steps
- Verify there is no duplex configuration mismatch between two neighboring ports.
- Run cable test to verify the cable is healthy or not.
- Verify the switch port is healthy by connecting the end device with the same cable to a known working port. If the issue does not persist then the original switch port is possibly faulty, please contact Meraki support, if persists, move to the next troubleshooting step.
- Verify the end device is healthy by connecting it to the original port using a known working cable bypassing any patch panels. If the issue persists then the end device's NIC card is possibly faulty, if not, move to the next troubleshooting step.
- Verify the copper/fiber transceiver is healthy by installing a known working transceiver on the port. If the issue does not persist then the original copper/fiber transceiver is possibly faulty, if the issue persists, move to the next troubleshooting step.
- If the issue persists after attempting the above steps, then the patch panel is possibly faulty or there is electromagnetic interference near the cable.
Beacon Miss
Triggers
A beacon is a wireless LAN packet that signals the availability and presence of the wireless device. Clients may disassociate or roam to another AP when they miss eight consecutive beacons.
Troubleshooting Steps
- Check AP functionality and wiring.
- Check client wifi device operating correctly.
- Check client wireless drivers.
- Check for environment radio interference.
Unplanned Low Power Mode
Triggers
AP did not negotiate sufficient PoE parameters for full power operation.
Troubleshooting Steps
- Check AP PoE needs and switch specs to make sure switch is providing required PoE level.
- Check cabling to make sure the AP is not running beyond PoE length standards for the protocol.
Ethernet Uplink Speed Degraded
Triggers
AP did not negotiate full capability of local LAN port. Any AP running with half-duplex or with negotiated link speeds of less than 1000Base-T are flagged for this error.
Troubleshooting Steps
- Check port settings (speed and duplex) on switch.
- Check cabling to make sure using CAT spec cable matching desired ethernet speeds.
Ethernet Collisions Detected
Triggers
If the port is detecting a high amount (greater than 10% of transmitted traffic) of collisions.
Troubleshooting Steps
Check for anomalies:
- Physically inspect the layer 1 cable.
- Check speed/duplex.
- Assess path from the switch to the client.
Packet Fragments Detected
Triggers
If the port is sending or receiving a high amount (greater than 1000 hits/hour or greater than 10% of traffic) of fragments.
Troubleshooting Steps
Check for anomalies:
- Physically inspect the layer 1 cable.
- Assess path from the switch to the client.
Jabbers Errors Detected
Triggers
If the port is sending or receiving a high amount (greater than 1000 hits/hour) of jabbers.
Troubleshooting Steps
Check for anomalies:
- Physically inspect the layer 1 cable.
- Assess path from the switch to the client.
Oversized or Undersized Packets Detected
Triggers
If the port is sending or receiving a high amount (greater than 10% of traffic) of oversized or undersized packets.
Troubleshooting Steps
Check network MTU settings to make sure it is consistent throughout path.
SecurePort Authentication (Failure, In Progress Timeout)
Triggers
Various stages of SecurePort Authentication.
Troubleshooting Steps
Troubleshoot based on stage of alert, check that LLDP is enabled on network and the MR/MS is running the minimum required firmware.
BPDU Guard Activated, STP Discarding Packets
Triggers
When a BPDU guard enabled port receives a BPDU from the connected device, the port is disabled and its state is changed to errdisable state. The switch will also start discarding packets received on the port.
Troubleshooting Steps
Remove the offending device sending the BPDU and check the topology configuration.
Stopped Receiving BPDUs with Loop Guard Enabled
Triggers
If a non-designated port with loop guard enabled stops receiving BPDUs, it will transition into a loop-inconsistent blocking state. In this state, the port will still process BPDUs but will not learn MAC addresses or forward traffic, thereby preventing a loop from forming.
Troubleshooting Steps
Check switch topology and STP configuration.
Root Guard Activated, STP Discarding Packets
Triggers
Root guard is a feature in Spanning Tree Protocol (STP) that prevents a switch port from becoming a root port if it receives superior Bridge Protocol Data Units (BPDUs) from another switch. When root guard is enabled on a port, it discards incoming BPDUs from switches that claim to be the root bridge.
Troubleshooting Steps
Check switch topology, STP configuration, specifically root bridge settings.
Cloud Archive Upload Failure
Triggers
MV devices are having issues uploading to the cloud.
Troubleshooting Steps
- Check network settings for MV.
- Check firewall settings.
Potential Hardware Problem
Triggers
When the camera cannot mount its storage.
Troubleshooting Steps
Open a support case.
Potential NTP Problem
Triggers
Issues reaching/talking to NTP servers.
Troubleshooting Steps
- Check network settings, DHCP options, and ping NTP servers.
- Confirm an NTP server is configured on the switch in the running configuration (ntp server {address}).
- Confirm the NTP server is accessible.
- Additional troubleshooting steps are available in NTP Troubleshooting and Debugging Guide.
One or More Members of This Stack Are Unhealthy
Triggers
A member of a switch stack has experienced an anomaly that indicates an unhealthy status.
Troubleshooting Steps
Determine which stack member is alerting and troubleshoot deeper or replace the device.
Port Not Forwarding Traffic Due to Access Policy
Triggers
A configured access policy is limiting or denying traffic.
Troubleshooting Steps
Check access policies and configure as needed.
Sensor Tampering
Triggers
When an MT20 detects a tamper state.
Troubleshooting Steps
Check that:
- You are using the included magnet bar.
- The gap between the MT20 and the magnet bar does not fall below 5 millimeters (0.5 cm).
Note that this can also trigger when an unknown magnet strength is detected, potentially indicating physical tampering.
NETCONF Process is in an Abnormal State
Triggers
Netconf-yang process has experienced an anomaly.
Troubleshooting Steps
- Netconf is a protocol used within the encrypted tunnel to communicate between the switch and cloud.
- If this error appears, additional information may be provided in the syslog (show log) of the switch regarding resolution steps.
- After resolving based on any log information shown, the netconf process should be restarted (no netconf-yang; netconf-yang in the running configuration).
- Any other processes requiring netconf will be unavailable while netconf restarts.
- The error may take up to an hour to resolve in dashboard following the process restart.
PoE Overload
Triggers
When a connected device is consuming more power than the maximum limit configured or specified in the 802.3at/af standards.
Troubleshooting Steps
Check support PoE standards of switch and over PoE budget in use.
PoE Port Was Denied Power
Triggers
If the port is waiting for power.
Troubleshooting Steps
This may indicate that there is currently not enough available power for the port and connected device.
Detected an Unsupported Cable Type
Triggers
Incorrect probe connected to sensor.
Troubleshooting Steps
Check probe and replace, if necessary, with the correct probe.
Device Reboots
Triggers
Dashboard detected large number of uninitiated reboots.
Troubleshooting Steps
Check for power issues, possibly making sure a UPS or power conditioner is present.
Device Rebooted Due to no_xmit_mon
Triggers
Can’t transmit packets for a 1 minute. mon0, mon1, and mon2 are specific interfaces on a device. These interfaces relate to radios on the device. For example, no_xmit_mon0 means that we rebooted because we could not transmit on the "mon" (monitor) interface of radio 0. We reboot in this case, because it is likely that the virtual AP interfaces (such as apr0v0, apr0v1,for SSIDs 1 and 2) were also unable to transmit.
Troubleshooting Steps
Check the AP health and troubleshoot the monitoring interfaces on the radios as necessary.
Device Panic Reboots
Triggers
Device reboots have reached a level that is extremely critical to the operation of the platform.
Troubleshooting Steps
This could be due to a failing power supply or a configuration issue on the network, like a loop with an unmanaged switch.
1 Gigabit Link Failed, Speed Downshifted
Triggers
Ethernet negotiation failed for 1000Base-T.
Troubleshooting Steps
Check the cable and auto negotiation settings.
Received BPDUs From Multiple Senders
Triggers
When the following conditions are met for a switch port:
- The port is in RSTP (not legacy STP) mode.
- The port is full duplex.
- Multiple BPDUs are received within a small window that identify different sending ports.
- The port link state has not changed between receiving such BPDUs.
Probe Disconnected
Triggers
Temperature probe from MT11 is disconnected.
Troubleshooting Steps
- Ensure the probe connection is secure and remains dry.
- Reconnect the cable to clear the alert.
- If the alert persists, contact Meraki Support.
UDLD TX/RX Loop Detection
Triggers
This error state usually only exists if one fiber of the pair no longer transmits due to optics error or cable error.
Troubleshooting Steps
Check replace fiber interconnect and or SFP.
UDLD Neighbor Mismatch Detection
Triggers
When Port-A on Switch-A receives a frame from a port other than that with which it already formed a UDLD bi-directional relationship.
Troubleshooting Steps
Since UDLD errors indicate physical layer faults, it is appropriate to troubleshoot at the physical layer. When UDLD error messages are encountered, consider these questions:
- Does the error persist if the Small Form-Factor Pluggable Transceiver (SFP) is replaced?
- Does the error persist if the cable is replaced?
- Does the error persist if the connection is moved to a different physical port on the switch?
UDLD Unidirectional Link Detection
Triggers
A port should receive its own device and port ID information from its neighbor if the link is bi-directional. If a port does not receive information about its own device and port ID from its neighbor, the link is considered to be unidirectional. This can occur when the link is up on both sides but one side is not receiving packets, or when wiring mistakes occur, causing the transmit and receive wires to not be connected to the same ports on both ends of a link.
Troubleshooting Steps
UDLD frames can be confirmed by taking a packet capture on each end of the link to ensure that they’re being sent/received:
- Dashboard Capture Filter - ether host 01:00:0c:cc:cc:cc
- Wireshark Display Filter - udld
Water Leak Cable Disconnected
Triggers
Water leak cable from MT12 is disconnected.
Troubleshooting Steps
- Ensure the probe connection is secure and remains dry.
- Reconnect the cable to clear the alert.
- If the alert persists, contact Meraki Support.
Water Leak Cable Connected
Triggers
Water leak cable from MT12 is connected.
Troubleshooting Steps
This is an informational alert only. No troubleshooting required.
WLC Redundancy Has Member in Active Recovery
Triggers
If an HA SSO wireless controller chassis is in recovery mode.
Troubleshooting Steps
Refer to Monitoring Catalyst Wireless 9800 Controllers to learn how to remediate this error.
WLC Redundancy Has Member in Standby Recovery
Triggers
If an HA SSO wireless controller chassis is in recovery mode.
Troubleshooting Steps
Refer to Monitoring Catalyst Wireless 9800 Controllers to learn how to remediate this error.
WLC Redundancy Standby Member Offline
Triggers
If the standby HA SSO wireless controller chassis is NOT in STANDBY HOT state.
Troubleshooting Steps
Refer to Monitoring Catalyst Wireless 9800 Controllers to learn how to remediate this error.
WLC Redundancy Failover Occurred in Past Day
Triggers
When the an HA SSO wireless controller chassis failover has occurred in the last 24 hours.
Troubleshooting Steps
Refer to Monitoring Catalyst Wireless 9800 Controllers to learn how to remediate this error.
Not Enough Space on Device
Triggers
IOS XE flash storage does not have enough space to perform some dashboard management features.
Troubleshooting
Please clear flash space on your IOS XE device.
Netconf Abnormal
Triggers
If netconf-yang status is not in enabled or in an unconfirmed status state, the dashboard will be unable to complete the provisioning processes.
Troubleshooting
-
Restart netconf-yang process with the following commands:
-
no netconf-yang
-
netconf-yang
-
-
For more information on netconf-yang see https://www.cisco.com/c/en/us/td/docs/ios-xml/ios/prog/configuration/1712/b_1712_programmability_cg/m_1712_prog_yang_netconf.html
-
If netconf-yang status does not return to normal, contact TAC
WLC AP Limit
Triggers
WLC associated access point threshold exceeded 2,000 access points. Telemetry collection from the WLC will suspended.
Troubleshooting
Lower the associated access points on the WLC to below 2,000.
WLC Interface Errors
Triggers
WLC has detected issues interfacing with an AP
Troubleshooting
- Test reachability - Verify physical and and logical path integrity between AP and WLC
- Check logs for relevant error messages
- Check this document for additional advanced troubleshooting Troubleshooting Dashboard Connectivity to Catalyst 9800 Wireless Controllers
AP Became Repeater
Triggers
AP was not able to communicate to the Dashboard via Ethernet
Troubleshooting
- Check the subnet/VLAN the AP is configured on can reach the internet.
- Check that the patch cable is still good. Use Dashboard cable test from switch to verify
- Check that the switch port is operating properly.
DOM Stats Alert
Triggers
One or more monitored statistics for a Digital Optical module have reported abnormal condition
Troubleshooting
- Identify which module is reporting abnormal condition
- Check/replace fiber patch cable
- Check/replace optical module
- Verify Interface on switch is operating correctly
Secure Connect Auth Failure
Triggers
The Secure Connect server could not authenticate the provided credentials
Troubleshooting
- Verify credentials being used
- Verify that you are connecting to the correct server
- Verify that the server is online and accepting connections
- Verify path integrity to the server being queried
Secure Connect Auth Timeout
Triggers
The Secure Connect server did not respond in time to the authorization request
Troubleshooting
- Verify that you are connecting to the correct server
- Verify that the server is online and accepting connections
- Verify path integrity to the server being queried
- Check for any policy or firewall rules that would affect bidirectional communication
POE Power Error
Triggers
Lower power detected. Gen 3 cameras require at minimum 802.3at, if the power source is detected to be 802.3af or lower all analytics are turned off and alert is generated
Troubleshooting
Ensure power soruce can support 802.3at power requirements and can negotiate this according to the protocol
High CPU MX
Triggers
Detected CPU Utilization on an MX was higher than expected
Troubleshooting
- Run a ping test to the device and a web-based speed test from Appliance Status > Tools
- Confirm the number of active devices, throughput, number of routes, and number of tunnels are within safe operating limits.
- Adjust content filtering, group policies, and security service settings if they are set to maximum levels.
Additional Information to understand MX Device Utilization or reach out to Cisco Meraki Support for assistance.
High Memory MX
Triggers
Detected Memory Utilization on an MX was higher than expected
Alert Details
The detected memory utilization was higher than expected for the device.

Guided Troubleshooting Flow
-
Test network performance using a ping test

-
Test network performance using the Dashboard throughput test

-
Assessing and optimizing network performance and security

-
Contact support

Additional Information
The presence of a high memory alert on networking equipment does not necessarily indicate an issue. Networking devices are often designed to optimize performance by utilizing available memory resources efficiently. High memory usage can be typical during peak operational times or when handling specific data-intensive tasks. It's crucial to evaluate the overall performance and functionality of the device to determine if any corrective action is needed. If the network is operating smoothly without any noticeable performance degradation, the high memory alert may simply reflect normal operational behavior. Regular monitoring and familiarity with the device's memory usage patterns can help distinguish between expected and problematic scenarios.
High Temperature MX
Triggers
Temperature of a critical component of the MX was reported higher than recommended
Troubleshooting
- If the device has an external fan, please verify that it is operational
- Improving your device’s airflow and surroundings should reduce overheating and prevent hardware damage.
- If this does not solve the issue, consider updating to the latest firmware which may include performance optimizations and address any active alerts