
Smart Threshold in Meraki Insight
Overview
Smart Threshold is a tool built into Web App Health that intelligently sets the thresholds for application performance. This sophisticated machine-learning algorithm will learn over time what a healthy network looks like for a given organization. Past workloads across networks and applications will be analyzed on a per-customer basis to autonomously identify anomalies that fall outside their norm.
Why Smart Threshold?
Existing Meraki Insight customers can see “false positives” for application performance due to normal network circumstances for a site. At present, the benchmark of the SAAS application’s performance is determined by manually configuring the thresholds. If these values are not provided by the application vendor, this configuration is generally “best effort.”
Normally, a single threshold is applied to all networks within the organization. No matter how close each site is geographically located to the application server or how far apart, all of the networks in the organization follow one static threshold. This has the potential of becoming a problem when the performance varies, with not only network behaviors like the distance and latency of the site to the application server, but also the type of Uplink. If the site has broadband vs. 4G, the threshold values would still read the same.
Smart Thresholds, when enabled, will automatically adjust thresholds to web applications based on past behavioral patterns. These patterns include the performance of that application and the network it’s been running on. These thresholds will be available per app, per network. This takes into account network behavior over a certain time and globally looks at the application’s performance to calculate the threshold of the specific application for the given network.
Note: Customers do not need to purchase an additional license to enable Smart Threshold. It is included as a feature by default in Web App Health.
UI Components
Main page
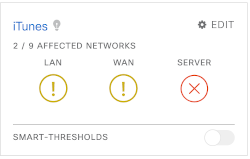
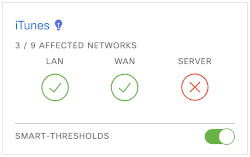
In the past, an admin had to manually set thresholds for both Goodput and Response times using the “Edit” button. However, the different applications on the landing page of Web App Health now have a “Smart Threshold” Toggle button. When you select the toggle to the right, it enables the machine-learning algorithm on the back end that calculates the “Goodput” and “Response Time” thresholds per-app and per-network.
Notice that the “Edit” button will disappear once the toggle has been enabled. It indicates that the user will no longer be able to manually set thresholds for any networks as a one-off. Hence, there are no workarounds to have both manual and automatic thresholds enabled at the same time across different networks for the SAME application.
The light bulb icon signifies that Smart Threshold values are enabled on a per-app per-network basis.
Note: Smart Threshold values are calculated regardless of whether you have the Smart Threshold toggle button enabled. If you decide to switch from manual to Smart Thresholds for any app, these values are already available and will be reflected on the UI.
Note: Currently, there is no way to have some networks on Smart Threshold and some on manual thresholds. Once Smart Threshold is enabled, it will be available for ALL networks monitoring the particular application.
Troubleshooting page
Once you have identified the problematic domain (e.g. LAN, WAN, or server) on the network of interest, you can navigate to the troubleshooting page of the app in question. The thresholds for “Goodput” under WAN and LAN along with “Response times” under the application tab will now have the new thresholds determined by the machine-learning algorithm on the back end.
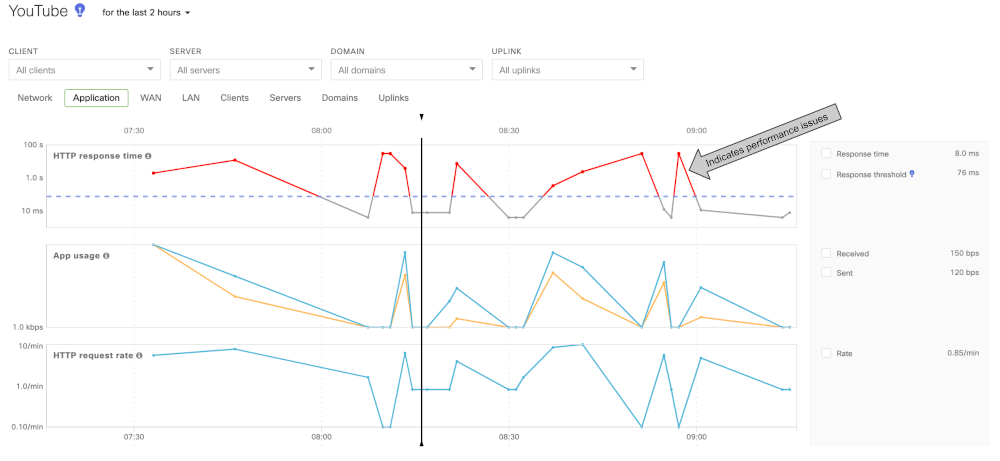
Previously, the values reflected were manually entered under the “Edit” button for each app. As mentioned before, these values were the same for all networks monitoring the app. Now you can easily see that networks under the same application can have different thresholds from each other. The adaptation to specific network and app behaviors for different sites helps administrators to be alerted more accurately than the broadly defined manual thresholds.
When the “Goodput” or “Response time” crosses the threshold marks, the lines will be marked in red, indicating a potential issue. This allows administrators to clearly view time periods and values that experience problems and take any necessary action to resolve them.
Best Practices for Smart Thresholds
Configure alerts under the Manage Alerts section of Meraki Insight to identify sites that will now start/stop alerting due to changes in thresholds. You can now easily determine the expected behavior of an application on a per-site basis and be alerted of sites that are showing behavior out of the norm for that location.
FAQs on Smart Thresholds
How are the thresholds determined?
The Smart Threshold model runs a complex algorithm that looks at patterns and trends across each day, taking into account various factors such as network behavior, workload, and global application performance to determine the threshold value.
What happens if a new application is added that did not exist before?
If it's an application that is commonly tracked by other networks/sites, such as 0365, Google Drive, Gmail, etc, and your network has seen traffic flow in the past, then such thresholds will already have been calculated and are available to use.
If it's a custom-built application or the network has not seen flows for it in the past, then it will fall back to default values until the network sees enough flows to determine the Smart Threshold.
Can the sensitivity be changed for how you want to receive alerts?
No, this ability is currently not available.
Does this mean I’ll be receiving fewer alerts?
Smart Threshold is more directed toward alerting you when an anomaly occurs in your network. If you’re receiving more alerts than usual, that means that the network has been suffering from application performance and you’re now being alerted diligently.
For the alerts to be accurate, we measure the patterns of the active flow against strict criteria to determine if it's a true outage before sending out the alert.