
Wireless Roaming Health/Analytics
Click 日本語 for Japanese
Overview
Wireless roaming is a feature that allows you to maintain connectivity to the network as you move from one place to another. This technology allows your device to switch between different wireless networks, ensuring that you stay connected even if you're not in one place for an extended period of time.
Learn more with these free online training courses on the Meraki Learning Hub:
Roaming behavior is often complex and difficult to troubleshoot. More often than not, users are forced to rely on timelines or connection logs, manually filtering and tracking entries for the client device(s) they’re interested in. This is what the current interaction might look like on the timeline:

In order to assist with troubleshooting and understanding roaming patterns, Roaming Health and Roaming Analytics can be leveraged in networks with APs running firmware version 29.4 or newer. Firmware updates can be scheduled on the General Configuration page under the "Firmware upgrades" section. For more information, see: Managing Firmware Upgrades.
Roaming Health
We have added a Roaming Health metric, that let's you visualize how your clients are doing when they roam at a network level. This page is accessed via the Assurance > Overview > Clients Wireless > Roaming

Event Categories
-
Good roams
-
Any roam where the roam time is <250ms and RSSI is better or no worse than 5 dBm than the originating AP
-
-
Bad roams
-
any roam where the roam time is >= 3000ms (3 seconds); or
-
any roam where the RSSI on the arriving AP is >10dBm worse than the originating AP
-
-
Suboptimal roams
-
any roam where the roam time is between 250ms and 3s; or
-
any roam where the RSSI on the arriving AP is 6-10dBm worse than the originating AP
-
-
Ping pong clients
-
Any roam where the client is only roaming between two APs; and
-
A minimum of four roams occur between these two APs; and
-
Roams are, at most, 10 seconds apart
-
-
Sticky clients
-
Any client where its current SNR is <15 dB while there is an alternative at least 10 dB better; and
-
The transmit (Tx) power of the alternative is within 5 dBm of the current connection; and
-
The above is true for at least 10 minutes
-
-
Client disconnects
-
Client device left the network, and no roaming behavior was detected
-
Features
The Roaming Health page is designed to give you an overview of how your clients are roaming on a per network basis. From this page you can easily see if there are specific clients, Access Points, or floors that are having issues with roaming.
The lower portion of this page will show you your Impacted Clients. In this section, you can see:
- Name: Name of the client device as seen by dashboard.
- Device Info: Which clients device types are having issues with roaming
- Bad or Suboptimal roams: The types of roaming issues the client encountered, the number of each, and a comparison against the previous time span.
- Most Recent AP: Which AP they last roamed to
- This is only indicating that the client was last seen on a particular AP and not indicating that it had a bad roaming event with that AP.
- Most Recent Location: Which floor the clients were/are on
- If your floor is "Unassigned" this indicates that the AP is not currently placed on the map in dashboard.
In all views you are able to sort by the column headers listed above.
You are able to search for a particular client or common element in the name.
i.e. If you search for iPhone, all devices that have iPhone in their name will be shown and all other devices will be filtered out.
You able to filter the list by Origin AP, Destination AP and Floor.
- Origin AP - The AP the client roamed from
- Destination AP - The AP the client roamed too.
- Floor - Which floor the AP is assigned to on the map
By using these filters they can help identify commonalities between devices with bad and suboptimal roams and help to identify root cause by allowing you to easily answer the below questions.
- Are they on the same floor?
- Are they roaming to the same AP?
- Are they roaming from the same AP?
- Do they have the same OS/driver?
Tracked Metrics
We have three main Event Category metrics that we track and represent in this section, Good, Bad and Suboptimal Roams, as well as the Impacted Clients.
There are two additional metrics that can be seen in the Client Roaming Analytics page discussed below in Roaming Analytics:
When you first access the page you will see the graph below, showing the percentage of each Event Category.

For the Roaming Impact Visualization to represent metrics per floor it is required that the floor plans be added to the dashboard network and APs be placed on their respective floor plan. This can be achieved by following instructions in the Placing Devices on the Map in Dashboard or AP Auto Locate articles.
Roaming Impact Visualizations
As the color gets darker, this indicates that there are more issues on the floor during the selected time slot.
Bad Roams
When you click on the Bad Roams heading, the view changes to a Roaming Impact Visualization that tracks the bad roams on a per floor basis.
- The Wireless roams chart displays the percentage of bad roams out of the total number of roams within the selected timeframe in Assurance Overview.
- Top Access Point pairs with bad roams shows the Access Point combinations with the highest number of bad roams between them and the percentage they represent out of the total bad roams during the selected timeframe in Assurance Overview.

Suboptimal Roams
When you click on the Suboptimal Roams heading, the view changes to a Roaming Impact Visualization that tracks the suboptimal roams on a per floor basis.
- The Wireless roams chart displays the percentage of suboptimal roams out of the total number of roams within the selected timeframe in Assurance Overview.
- Top Access Point pairs with Suboptimal roams shows the Access Point combinations with the highest number of suboptimal roams between them and the percentage they represent out of the total suboptimal roams during the selected timeframe in Assurance Overview.

Map view for Bad and Suboptimal Roams
If maps with AP placements either from manual configuration or from AP Auto Locate have been uploaded to dashboard there is an alternate view for Bad and Suboptimal roams.
To access this, click on the floor name in the Bad or Suboptimal roams infographic.

In the view that opens there is a visual representation of the roaming data. While the information provided isn't specific to a particular client, it is a representation of the roams between the Access Points.
In the upper right of the page, you'll see a percentage, which is the percentage of Bad/Suboptimal roams for the floor, and a color graphic to denote the amounts. The darker the line, the more Bad or Suboptimal roams have happened between the two AP that are connected.

You are able to click on the line between the AP and see more detailed information on how many Bad/Suboptimal roams have occurred between them.

Impacted Clients
In Wireless Roaming analytics, an impacted client is considered a client who has experienced at least one bad roam.
Bad roams and suboptimal roams will display the current count for the selected timestamp and a comparison against the previous same timestamp.

When you click on the client name you will be taken to the Roaming tab in the Client Details, at the same timeframe as the Assurance Overview.
Client Roaming Analytics
With Roaming Analytics, Meraki Health transforms a static log of network events into a highly engaging, interactive, visualization of roaming behavior.
While the Roaming Health (discussed above) provides an overview of roaming metrics at a network level, Roaming Analytics is further broken down at a client level as well.

Features
Available as a tab for all wireless clients, Roaming Analytics offers a variety of features designed to make troubleshooting roaming events easier than ever.
Event Categories

Using the time range selector, users can visualize roaming events during the last 6 hours, 12 hours, 24 hours, or last week. All roaming events during the selected period are automatically categorized into five event types. When hovering over event type tiles, the descriptions in Event Categories are displayed.
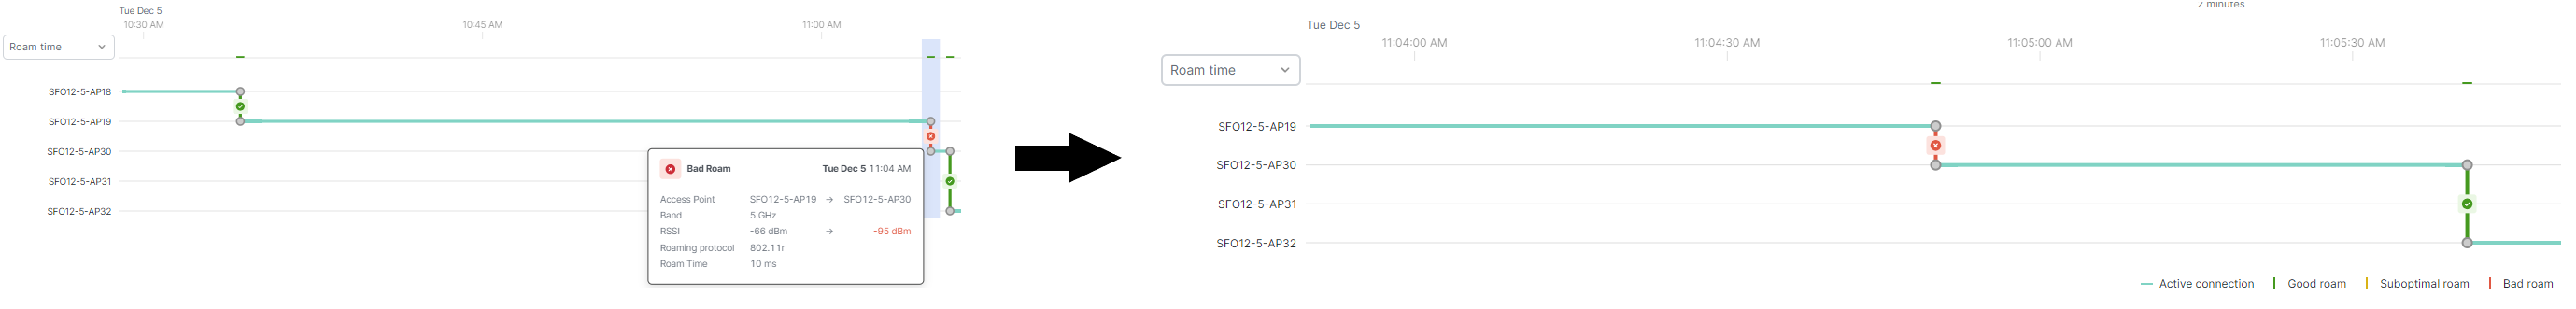
Roaming Events Timeline

All roaming behavior during the selected time period is presented as a chronological ribbon of roaming events. Each event is color-coordinated to its event category. By dragging the blue range selector, users can visualize the specific times or events that are most relevant to them. As the range selector moves, the below visual automatically adjusts to display roaming events during that time period.
When hovering over specific roaming events, users are presented with a popover that details that particular event: date, time, APs, bands, RSSI, roaming protocol, and roam time.
Users can use their cursor to zoom into the timeline at any time. Clicking on an event changes the view from a 1-hour interval to a 2-minute interval.
The Roaming Event Timeline captures roaming events when there is an AP to AP handoff, indicating a roam from one AP to another. Certain SSID security types such as; Open SSID, VPN tunnel to concentrator, Ethernet over GRE mode, Open + Splash, or when CoA is enabled will result in a series of disconnection and connection events instead of the roaming events seen for other SSID types.
Roaming Event Log
In addition to the visualized events, the user is presented with a log of all roaming activity for the client device. Note the blue focus state indicator. This indicator tracks the position of your cursor in the visualization to intelligently draw your attention to the corresponding event in the table. This also works in reverse; your cursor position in the table will intelligently focus the visualization.
The combination of an event log with visualization, along with intelligent focusing, presents roaming events in context. This enables users to quickly determine whether their roaming issues are isolated or will require additional troubleshooting.
