
MT MQTT Setup Guide
Overview

While MT sensors provide a rich user experience on the Dashboard, we’re introducing a new paradigm for consuming the MT sensor data using an MQTT Telemetry stream. This guide is intended to help the user set up and enable MQTT brokers on the Dashboard for MT sensors and consume the telemetry data from the broker.
How MQTT works for MT

MQTT uses a server/client, publish/subscribe architecture where a client can publish specifically formatted data to a defined topic path in the server. Another client can then consume this data by subscribing to the said topic.
Roles for each device are as below:
-
MT sensors - collects telemetry data and sends it to a gateway (MV/MR). Sensors do not directly communicate with the broker.
-
Gateway (MV/MR) - Acts as a publisher client. All MVs and MRs in the network will publish the telemetry data it collected to the broker.
-
Broker - On-site/Cloud-based broker on the user’s environment that ingests the data and stores it in the database.
-
Subscriber - Another third party device that reads the data from the broker database.
Requirements
Since MT data is sent via the gateway, both MV and MR need to be running the required firmware with MQTT support for MT telemetry.
Minimum firmware requirement:
-
MR - 28.6+
-
MV - 4.16+
For users who have MT sensors in a combined network with MV and MR, it is critical that both the Cameras and APs be upgraded to the firmware listed above.
This is because the gateways do not have a control over where the sensors are connecting; in case an MT connects to a gateway that does not support MQTT, the telemetry data will not be published, resulting in a gap of data in the broker database. Note that this does not affect Dashboard data in any scenario and is strictly exclusive to MQTT telemetry stream.
Caveats
Keeping the roles in mind, there are some caveats. MT sensors still follow the same wake up mechanism to collect and report the data
-
MT10/MT11 samples temperature/humidity every 2 minutes and reports it to the gateway every 20 minutes.
-
This means that the gateway will publish a total of 20 messages (10 from MT10, and 10 from MT11) for temperature and humidity every 20 minutes. The payload will include a timestamp (ISO 8601) stating when the sample was taken.
-
The cycle continues, unless an alert is triggered, in which case the sensor will interrupt its cycle and immediately report the data.
-
-
MT12/MT20 samples the current state constantly, but only reports every 20 minutes, or if there is a state change
-
This means the gateway will publish the current state every 20 minutes.
-
Or when the state changes (like a door being opened/closed, or water being detected).
-
Getting Started
Configuring the Dashboard
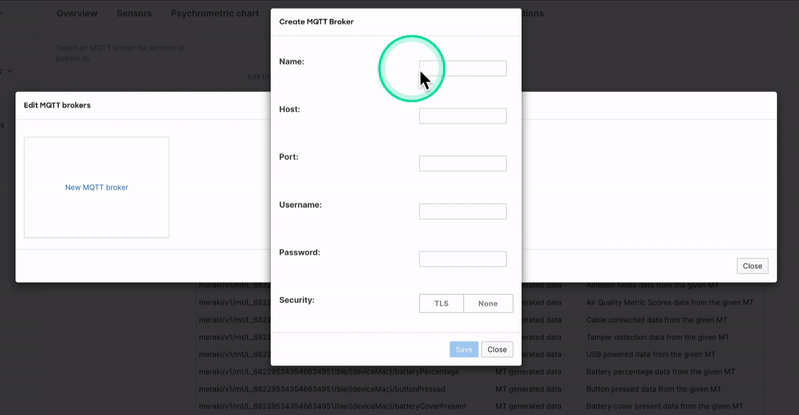
The MQTT broker for MT sensors can be configured under Environmental > Overview > MQTT Brokers
MQTT Brokers tab is only visible if the Minimum Firmware Requirements are met.
Add the broker by selecting Edit MQTT Brokers and then selecting New MQTT broker. Configuration options are:
-
Broker Name: An identifier for the user.
-
Host: IP address of the broker the user will be configuring.
-
Port: Port used by MQTT server. By default, servers use TCP port 1883.
-
Username, Password: Configured username and password for the broker (this is required if not using certificate-based TLS security).
-
Security: Can be None or TLS security. If TLS security is selected, a new option will appear, where the user should upload the certificate to be used (this is required if not using username and password authentication).
Once all the fields are configured, click Save and make sure to Select the broker that was just configured.
As soon as the configuration is saved and pushed to the gateways, they will connect to the broker and start publishing the telemetry data.
MT MQTT Telemetry Data structure
Topic and Data Format
To create a consistent experience, the user should use the topic format as shown below.
meraki/v1/mt/{locale_id}/ble/{sensor_mac}/{metric}
Example:
meraki/v1/mt/L_643451796760561416/ble/54:6C:0E:8A:9E:81/temperature
The topic structure is defined based on a specific sensor perspective and its metric.
Regarding the data payload returned, the aim is to have a readable format that can be exported to other platforms. Here is the v1 format:
Per Sensor Metrics
Sensor telemetry data for different metrics, sorted by device:
MT10
|
Topic |
Payload |
Notes |
|
temperature |
{ "ts":"2023-08-12T17:44:46Z", "fahrenheit":72.6, "celsius":22.6 } |
Includes timestamp (of reading) and temperature readings in °C and °F. Data reported every 20 minutes (unless threshold set in dashboard is violated). Temperature data is collected every 2 minutes but reported in 20 minute intervals, so expect up to 10 messages per connection.
|
|
humidity |
{ "ts":"2023-08-12T17:44:46Z", "humidity":62 } |
Timestamp (of reading) and Humidity in %RH. Data reported every 20 minutes (unless threshold set in dashboard is violated). Humidity data is collected every 2 minutes but reported in 20 minute intervals, so expect up to 10 messages per connection. |
MT11
|
Topic |
Payload |
Notes |
|
temperature |
{ "ts":"2023-08-12T17:44:46Z", "fahrenheit":72.6, "celsius":22.6 } |
Includes timestamp (of reading) and temperature readings in °C and °F. Data reported every 20 minutes (unless threshold set in dashboard is violated). Temperature data is collected every 2 minutes but reported in 20 minute intervals, so expect up to 10 messages per connection.
|
MT12
|
Topic |
Payload |
Notes |
|
waterDetection |
{ "ts":"2023-08-12T17:59:38Z", "wet":false } |
Timestamp (of reading) and wet status as a true/false boolean. Current state reported every 20 minutes or if there is a change in state |
MT14 (Standard Operating Mode)
|
Topic |
Payload |
Notes |
|
temperature |
{ "ts":"2023-08-12T17:44:46Z", "fahrenheit":72.6, "celsius":22.6 } |
Includes timestamp (of reading) and temperature readings in °C and °F. Data reported every 20 minutes (unless threshold set in dashboard is violated). Temperature data is collected every 2 minutes but reported in 20 minute intervals, so expect up to 10 messages per connection.
|
|
humidity |
{ "ts":"2023-08-12T17:44:46Z", "humidity":62 } |
Timestamp (of reading) and Humidity in %RH. Data reported every 20 minutes (unless threshold set in dashboard is violated). Humidity data is collected every 2 minutes but reported in 20 min intervals, so expect up to 10 messages per connection. |
|
iaqIndex |
{ "ts":"2023-10-13T22:57:20Z", "iaqIndex":85 } |
Includes timestamp (of reading) and IAQ Index based on all other environmental metrics (more info is available in the Air Quality Metrics Explained documentation). Data reported every 20 minutes (unless threshold set in dashboard is violated). IAQ data is collected every 2 minutes but reported in 20 minute intervals, so expect up to 10 messages per connection.
|
|
tvoc |
{ "ts":"2023-10-13T23:13:44Z", "tvoc":32, "units":"ug/m^3" } |
Includes timestamp (of reading) and readings in the specified units. Data reported every 20 minutes (unless threshold set in dashboard is violated). TVOC data is collected every 90 seconds but reported in 20 minute intervals, so expect up to 14 messages per connection.
|
|
ambientNoise |
{ "ts":"2023-10-13T23:14:14Z", "ambientNoise":47, "units":"dBA" } |
Timestamp (of reading) and readings in the specified units. Data reported every 20 minutes (unless threshold set in dashboard is violated). Ambient Noise data is collected every 5 minutes but reported in 20 minute intervals, so expect up to 4 messages per connection. |
MT14 (High Sampling Mode)
|
Topic |
Payload |
Notes |
|
PM2_5MassConcentration |
{ "ts":"2023-08-12T17:44:46Z", "PM2_5MassConcentration":62 } |
Timestamp (of reading) and Humidity in %RH. Data reported every 20 minutes (unless threshold set in dashboard is violated). PM2.5 data is collected every 1 second but reported in 20 minute intervals, so expect up to 1200 messages per connection. |
|
tvoc |
{ "ts":"2023-10-13T23:13:44Z", "tvoc":32, "units":"ug/m^3" } |
Includes timestamp (of reading) and readings in the specified units. Data reported every 20 minutes (unless threshold set in dashboard is violated). TVOC data is collected every 90 seconds but reported in 20 minute intervals, so expect up to 14 messages per connection.
|
|
ambientNoise |
{ "ts":"2023-10-13T23:14:14Z", "ambientNoise":47, "units":"dBA" } |
Timestamp (of reading) and readings in the specified units. Data reported every 20 minutes (unless threshold set in dashboard is violated). Ambient Noise data is collected every 5 seconds but reported in 20 minute intervals, so expect up to 240 messages per connection. |
MT15
|
Topic |
Payload |
Notes |
|
temperature |
{ "ts":"2023-08-12T17:44:46Z", "fahrenheit":72.6, "celsius":22.6 } |
Includes timestamp (of reading) and temperature readings in °C and °F. Data reported every 20 minutes (unless threshold set in dashboard is violated). Temperature data is collected every 30 seconds but reported in 20 minute intervals, so expect up to 40 messages per connection.
|
|
humidity |
{ "ts":"2023-08-12T17:44:46Z", "humidity":62 } |
Timestamp (of reading) and Humidity in %RH. Data reported every 20 minutes (unless threshold set in dashboard is violated). Humidity data is collected every 30 seconds but reported in 20 min intervals, so expect up to 40 messages per connection. |
|
iaqIndex |
{ "ts":"2023-10-13T22:57:20Z", "iaqIndex":85 } |
Includes timestamp (of reading) and IAQ Index based on all other environmental metrics (more info is available in the Air Quality Metrics Explained documentation). Data reported every 20 minutes (unless threshold set in dashboard is violated). IAQ data is collected every 2 minutes but reported in 20 minute intervals, so expect up to 10 messages per connection.
|
|
tvoc |
{ "ts":"2023-10-13T23:13:44Z", "tvoc":32, "units":"ug/m^3" } |
Includes timestamp (of reading) and readings in the specified units. Data reported every 20 minutes (unless threshold set in dashboard is violated). TVOC data is collected every 3 seconds but reported in 20 minute intervals, so expect up to 400 messages per connection.
|
|
ambientNoise |
{ "ts":"2023-10-13T23:14:14Z", "ambientNoise":47, "units":"dBA" } |
Timestamp (of reading) and readings in the specified units. Data reported every 20 minutes (unless threshold set in dashboard is violated). Ambient Noise data is collected every 5 minutes but reported in 20 minute intervals, so expect up to 4 messages per connection. |
|
PM2_5MassConcentration |
{ "ts":"2023-08-12T17:44:46Z", "PM2_5MassConcentration":62 } |
Timestamp (of reading) and Humidity in %RH. Data reported every 20 minutes (unless threshold set in dashboard is violated). PM2.5 data is collected every 1 second but reported in 20 minute intervals, so expect up to 1200 messages per connection. |
| CO2 |
{ "ts":"2024-02-22T19:39:27Z", "CO2":1003, "units":"ppm" } |
Timestamp (of reading) and CO2 in ppm. Data reported every 20 minutes (unless threshold set in dashboard is violated). CO2 data is collected every 30 second but reported in 20 minute intervals, so expect up to 40 messages per connection. |
| aqmScores |
{ "ts":"2024-02-22T19:39:21Z", "temperature":"Excellent", "humidity":"Good","tvoc":"Excellent", "PM2_5MassConcentration":"Excellent", "ambientNoise":"Fair", "CO2":"Fair" } |
Includes timestamp (of reading) and AQM metrics (more info is available in the Air Quality Metrics Explained documentation). Data reported every 20 minutes (unless threshold set in dashboard is violated). AQM data is collected every 2 minutes but reported in 20 minute intervals, so expect up to 10 messages per connection. |
MT20
|
Topic |
Payload |
Notes |
|
door |
{ "ts":"2023-08-12T18:00:54Z", "open":false } |
Timestamp (of reading) and door open status as a true/false boolean. Current state reported every 20 minutes or if there is a change in state |
MT30
|
Topic |
Payload |
Notes |
|
buttonReleased |
{ "ts":"2023-10-13T23:22:20Z", "id":0, "action":"shortPress", "pressDuration":0.2, "units":"s", "sequenceNumber":28 } |
Timestamp (of reading) and the type of action (longPress or shortPress), the length of the press in seconds and sequence number (maximum of 255 before reset). Current state reported every 20 minutes or if there is a change in state |
MT40
|
Topic |
Payload |
Notes |
| downstreamPowerStatus |
{ "ts":"2023-10-13T23:11:53Z", "downstreamPower":"off", "remotePowerControl":"enabled", "powerCycleState":"notRunning" } |
Timestamp (of reading), the current downstream power status (on or off), the current remote power control status (enabled or disabled depending on physical lockout switch) and current Power cycle state (running or notRunning) Current state reported every 20 minutes or if there is a change in state |
|
mainsVolts |
{ "ts":"2023-10-13T23:11:50Z", "mainsVolts":122.6, "units":"V" } |
Timestamp (of reading) and readings in the specified units. Data reported every 20 minutes (unless threshold set in dashboard is violated). MT40 data is collected every 15 seconds but reported in 20 minute intervals, so expect up to 80 messages per connection.
|
|
mainsCurrent |
{ "ts":"2023-10-13T23:11:50Z", "mainsCurrent":0.0, "units":"A" } |
Timestamp (of reading) and readings in the specified units. Data reported every 20 minutes (unless threshold set in dashboard is violated). MT40 data is collected every 15 seconds but reported in 20 min intervals, so expect up to 80 messages per connection. |
|
mainsRealPower |
{ "ts":"2023-10-13T23:11:50Z", "mainsRealPower":0.0, "units":"W" } |
Timestamp (of reading) and readings in the specified units. Data reported every 20 minutes (unless threshold set in dashboard is violated). MT40 data is collected every 15 seconds but reported in 20 minute intervals, so expect up to 80 messages per connection. |
|
mainsApparentPower |
{ "ts":"2023-10-13T23:11:50Z", "mainsApparentPower":0.0, "units":"VA" } |
Timestamp (of reading) and readings in the specified units. Data reported every 20 minutes (unless threshold set in dashboard is violated). MT40 data is collected every 15 seconds but reported in 20 min intervals, so expect up to 80 messages per connection.
|
| mainsPowerFactor |
{ "ts":"2023-10-13T23:11:50Z", "mainsPowerFactor":0, "units":"%" } |
Timestamp (of reading) and readings in the specified units. Data reported every 20 minutes (unless threshold set in dashboard is violated). MT40 data is collected every 15 seconds but reported in 20 min intervals, so expect up to 80 messages per connection. |
| mainsDeltaEnergy |
{ "ts":"2023-10-13T23:11:50Z", "mainsDeltaEnergy":0, "units":"Wh" } |
Timestamp (of reading) and readings in the specified units. Data reported every 20 minutes (unless threshold set in dashboard is violated). MT40 data is collected every 15 seconds but reported in 20 min intervals, so expect up to 80 messages per connection. |
| mainsFrequency |
{ "ts":"2023-10-13T23:11:50Z", "mainsFrequency":60.0, "units":"Hz" } |
Timestamp (of reading) and readings in the specified units. Data reported every 20 minutes (unless threshold set in dashboard is violated). MT40 data is collected every 15 seconds but reported in 20 minute intervals, so expect up to 80 messages per connection. |
Sensor Health
These are the Device level metrics that provide status information about the device
|
Topic |
Payload |
Notes |
|
batteryPercentage |
{ "ts":"2021-08-12T21:30:48Z", "battery percentage":100 } |
Includes timestamp(of reading) and battery level in %. Data reported every 20 minutes (unless threshold set in dashboard is violated)
|
|
usbPowered |
{ "ts":"2021-08-12T21:35:49Z", "usb powered":false } |
Ts(of reading) and USB connection status as a true/false boolean. Data reported every 20 minutes (unless threshold set in dashboard is violated). Only applies to devices with external power supply |
|
buttonPressed |
{ "ts":"2021-08-12T21:46:55Z", "button pressed":true } |
Ts(of reading) and General Purpose button press as a true/false boolean. Only reported when physically pressed |
|
cableConnected |
{ "ts":"2021-08-12T18:00:54Z", "cable connected":false } |
Ts(of reading) and water leak cable connection status as a true/false boolean. Current state reported every 20 minutes or if there is a change in state. Only applies to MT12 Water Leak Sensor |
|
probeType |
{ "ts":"2021-10-14T18:41:41Z", "probe type":"Bare Metal Temperature Probe" } { "ts":"2021-08-12T21:48:27Z", "cable type":"Glycol Temperature Probe" } |
Ts(of reading) and probe cable type. Current state reported every 20 minutes or if there is a change in state. Only applies to MT11 Probe Sensor |
Exceptions
Since the topic structure is designed by keeping the sensor metrics in mind, the above format does not accommodate RSSI values as those values are recorded from the perspective of a gateway.
To accurately organize the topics, the RSSI values can be retrieved using a slightly different topic structure:
|
meraki/v1/mt/{locale_id}/ble/{sensor_mac}/gateway/{gateway_mac}/rssi
|
||
|
meraki/v1/mt/L_647955396388043043/ble/2C:3F:0B:FF:F7:18/gateway/34:56:FE:A2:D4:FA/rssi
|
{ "ts":"2021-08-12T21:55:38Z", "rssi":-69, "units":"dBm" } |
Ts(of reading) and RSSI value in dBm. |
As noted in the example topic above, the RSSI value for Sensor(2C:3F:0B:FF:F7:18) from the perspective of a specific Gateway(34:56:FE:A2:D4:FA) is reported.
Note that the RSSI value of a single sensor can be reported by multiple gateways if they are in the immediate vicinity of the sensor. However, each sensor can only connect to one gateway at a time. All subsequent telemetry data is reported from the connected gateway.
General MQTT features
Retained Message
The current MQTT implementation for MT data also includes Retained Messages.
Since the MT sensors only report data every 20 minutes, the last data retrieved by a gateway is buffered and published when a broker subscribes to a specific topic. This way, the user does not have to wait for the next time the MT sensor connects to the gateway.
Wildcards
Using wildcards is also allowed in the current implementation. While it is always recommended to use specific individual topics to get more accuracy and optimize database entries, the user may also want to use regex wildcards to consume multiple data points using a single topic.
Single Level: +
As the name suggests, a single-level wildcard replaces one topic level. The plus symbol represents a single-level wildcard in a topic.
Example: meraki/v1/mt/{network_id}/ble/+/temperature
In the example above, the plus symbol will act as a wildcard and match all sensors that provide temperature metrics.
Multi-Level: #
The multi-level wildcard covers many topic levels. The hash symbol represents the multi-level wild card in the topic. For the broker to determine which topics match, the multi-level wildcard must be placed as the last character in the topic and preceded by a forward slash.
Example: meraki/v1/mt/{network_id}/ble/#
In the example above, when a client subscribes to a topic with a multi-level wildcard, it receives all messages of a topic that begins with the pattern before the wildcard character, no matter how long or deep the topic is. If only the multi-level wildcard is specified as a topic (#), all messages that are sent to the MQTT broker will be received by the user. Note that the higher the wildcard is on the topic, the higher the throughput of messages as the volume will significantly increase.
QoS
No QoS is enabled (i.e. level 0 is being used implicitly). This means there is no guarantee of data delivery to the broker. At the moment, this cannot be modified.