MT Psychrometric Chart
Overview
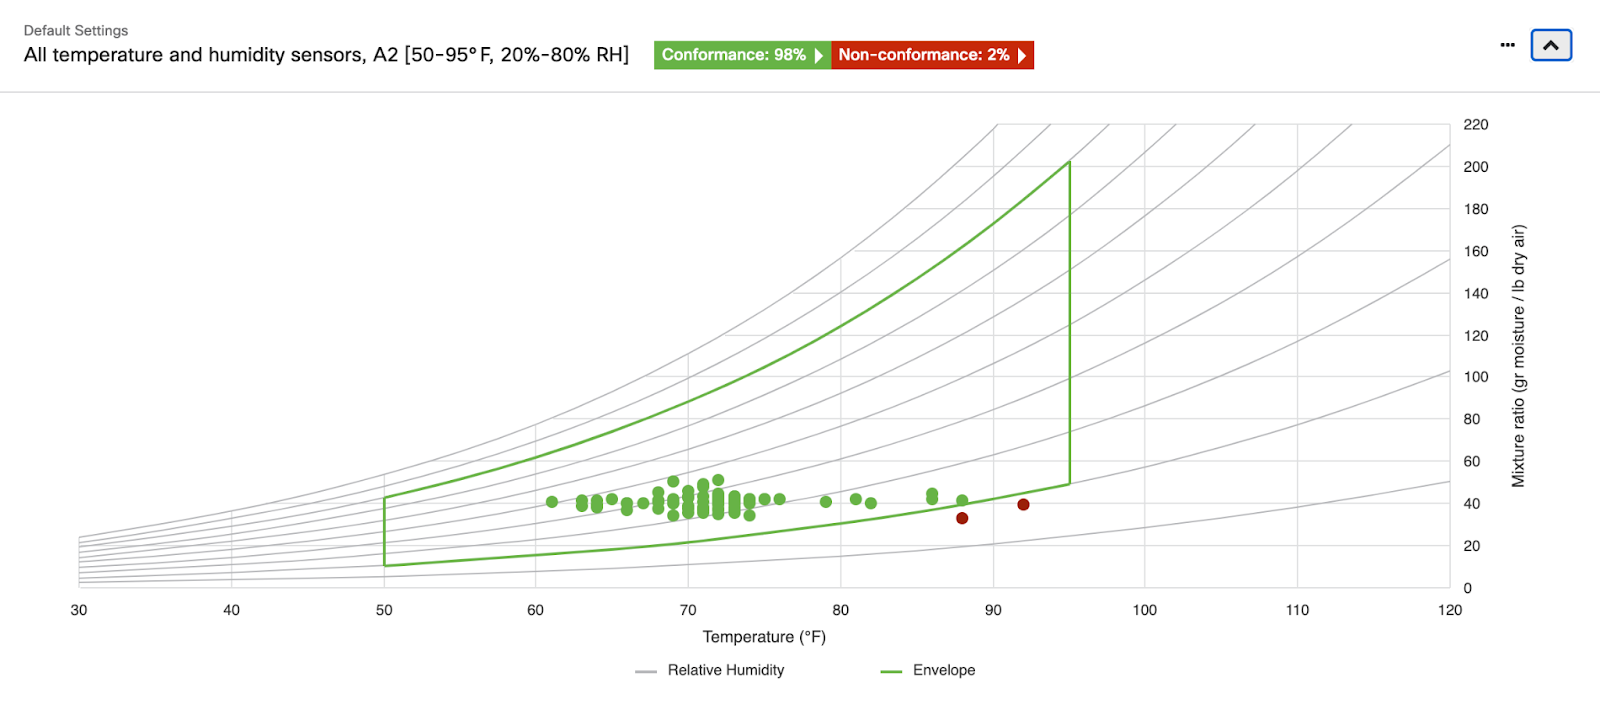
MT Psychrometric Readings Charts introduce a new way for a user to understand the current temperature/humidity status on an aggregate view for across all sensors in a particular network.
Psychrometric Readings Chart is compatible with the MT environmental sensors, including MT10, MT11, MT14, MT15.
There are 2 places where a user can see an Psychrometric Readings Chart.
-
Environmental Overview Page - Shows collected data of the current metrics across all MT devices (MT10, MT11, MT14, MT15)
-
Sensor Details Page - Plots the data point of the latest metric on an individual basis
Basics of Psychrometric Readings Chart
The Psychrometric Readings Chart is based off of a psychrometric chart. Psychrometric charts plot wet bulb and dry bulb data for air-water vapor mixtures at atmospheric pressure.
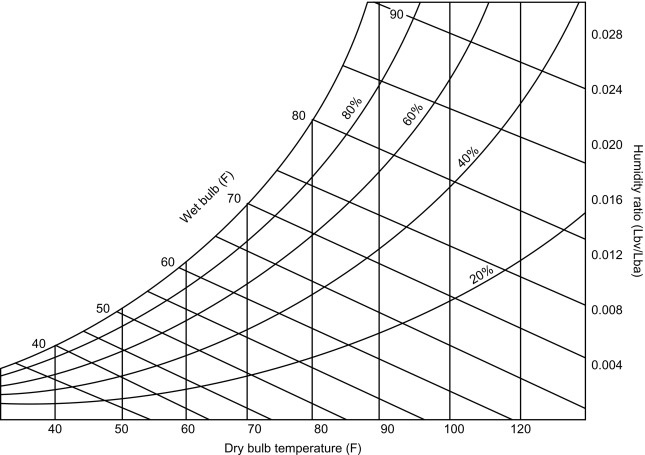
Here’s an example of a simple psychrometric chart with the assumption of standard air pressure at sea level.

Explaining the Chart
-
The x-axis is dry bulb temperature (in °C or °F ).
-
The y-axis is the humidity ratio(in gram moisture/kg dry air or grain* moisture/lb dry air)
-
The curved line is a relationship between dry bulb temperature and humidity ratio is plotted for air at various relative humidity levels: 20%, 40%, 60%, 80%, and 100%.
-
For the purpose of the Psychrometric Readings chart. The Wet Bulb temperature will be excluded, as it doesn’t affect the energy envelope.
*Grain is an imperial unit and 1 pound = 7000 grain. This unit is chosen for better scalability of the chart.
Definitions
-
Dry Bulb temperature - the temperature of air measured by a thermometer freely exposed to the air, but shielded from radiation and moisture. MT10 records dry bulb temperature
-
Wet Bulb Temperature - the temperature of a parcel of air cooled to saturation (100% relative humidity) by the evaporation of water into it, with the latent heat supplied by the parcel. For the purpose of this feature, wet-bulb temperature is ignored for the sake of simplicity.
-
Humidity Ratio - the ratio of weight of moisture to the weight of dry air in the air–vapor mixture. Its unit is gram vapor per kilogram of dry air.
-
Psychrometric chart - this chart plots wet bulb and dry bulb data for air-water vapor mixtures at a constant atmospheric pressure.
Reading the Chart
With the MT10 Temperature/Humidity Sensor, the dashboard collects a data point for Dry Bulb temperature and the relative humidity of the area. Based on this, the mixture ratio of the air can be determined.
Example: Suppose an MT10 is reporting a temperature of 70° F or 21° C, and 40% humidity. Find the 40% relative humidity line, then follow it along to 70° F on the x-axis, and plot a point there. The y-value of that point is the mixture ratio (about 6.29 gm vapor/kg dry air).
Understanding the Envelopes
Along with the data points from all sensors across the network, the Psychrometric Readings chart also has 4 envelopes defined. These envelopes are based on the recommendation of ASHRAE standards for maintaining the temperature and humidity conditions of different types of Data Centers. Below are the 4 recommended ranges:
-
A1[15-32°C, 20-80% RH] - Typically a data center with tightly controlled environmental parameters
-
A2[10-35°C, 20-80% RH] - Typically an information technology space with some control of environmental parameters
-
A3[5-40°C, 8-85% RH] - Typically a storage room with backup drives
-
A4[4-45°C, 8-90% RH] - Least environmentally sensitive areas.
Customizing the Chart and Envelopes
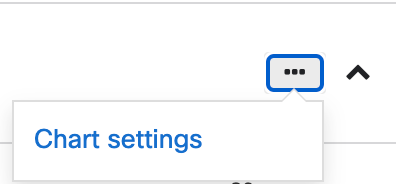
The Psychrometric Readings Chart has a default setting to show all MT10 sensors across the network and the Envelope defaults to A2 type. The dashboard also allows users to customize the chart using the Chart settings button under the 3 dot menu of the chart

The following settings can be customized by the user
![Energy Saving Chart Settings > Visible Tags section with one example tag added and Datacenter Type [Allowable Dry Bulb Temperature, Humidity Range] set to A2 (50-95° F, 20%-80% RH] (default)](https://documentation.meraki.com/@api/deki/files/26517/energy_saving_chart.png?revision=1&size=bestfit&width=624&height=448)
-
Visible Tags - The user has the ability to only show certain sets of sensors using the Tags option. For example, in a datacenter, all racks have an MT10 near the Inlet of the rack. Scoping the "Visible Tags" to only those sensors via Tags can give a user a good idea of how warm/dry the air is in the hot aisle of the racks.
-
Psychrometric Readings Envelope - Here the user can change the envelope as explained in the section above. Selecting the appropriate envelope can allow users to get an allowable range for controlling the environmental condition of the area.
Conformance
Now once a data point from an MT sensor is plotted on the Psychrometric Readings chart, the dashboard also determines a Conformance score. This score is essentially a percentage of sensors adhering to the range set by the envelope.
For example, out of 100 sensors deployed in an IDF, if 2 of the sensors are recording unusually warm or cold temperatures, the Dashboard will mark those 2 sensors as Non-conforming and the Conformance Score will drop to 98%

Clicking on the Non-conformance button will navigate to a predefined filter of the Sensors that are non conforming. Using this data, a user can determine exactly which sensors are out of the required variance at a glance.

