
Motion Heatmaps
Overview
This article explains how to use MV heatmaps to understand motion patterns in your environment.
This feature appears under the Analytics tab of each camera.
How it works
Heat maps use the camera’s existing motion metadata to display an overview of motion data from the past week. They show this data by day or by hour, providing insight into how a space is used.
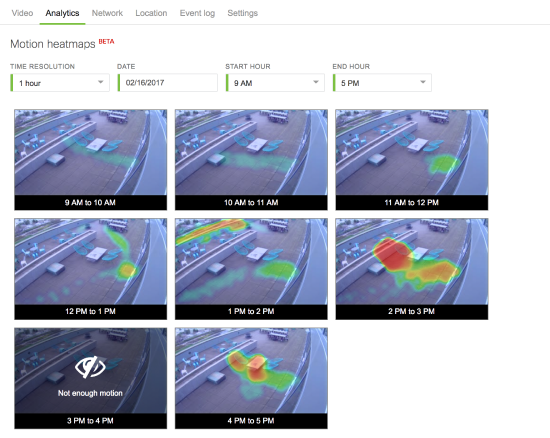
Heatmaps are shown for each selected time unit (1 hour or 1 day). Motion areas across all heatmaps are assigned an absolute value relative to total motion. Colors indicate motion levels, ranging from red for high motion to green for low motion. Areas with little or no motion are not shown, as they are insignificant compared to other areas.
This feature is not accessible to users who only have live video viewing privileges.