

Meraki Device Reporting - Syslog, SNMP, and API
Click 日本語 for Japanese
Learn more with these free online training courses on the Meraki Learning Hub:
Overview
Aside from the Meraki Event Log that is available on the dashboard, there are several methods for device reporting and information gathering. The Meraki dashboard is able to report device information and events via Syslog, API, and SNMP. This document will provide guidance on how to configure these various reporting methods for Meraki devices.
Choosing a Reporting Method
Syslog, API, and SNMP each have their own benefits for network and device reporting. Below is a list comparing each option with their possible use-cases.
| Network Event Information | Syslog | API / Webhooks | SNMP |
|---|---|---|---|
|
Device Flows |
X | ||
| Client Connectivity | X | X | |
| Configuration Changes | X | X | |
| Real-time information gathering | X | X | X |
| Real-time network statistics | X | X | X |
| Device information gathering | X | X | X |
| Detailed device statistics | X | X | |
| Network-wide information gathering | X | X | X |
| Organization-wide information gathering | X | X | |
| Proactive alerts for critical events | X | X | |
| Automation capabilities | X | X | |
| Application integration | X | ||
| Cloud-centric | X | ||
| Scalability | X |
Syslog Configuration
A syslog server can be configured to store messages for reporting purposes from MX WAN appliances, MR access points, and MS switches. The MX WAN Appliance supports sending four categories of messages/roles: Event Log, IDS Alerts, URLs, and Flows. MR access points can send the same roles with the exception of IDS alerts. MS switches currently only support Event Log messages.
To begin setting up a Syslog server on the Meraki dashboard, first, navigate to Network-Wide > Configure > General. Here you will see a section for Reporting, with the option for Syslog server configurations. Click on the Add a syslog server link to define a new server. Configure an IP address of your syslog server, the UDP port the server is listening on, and the roles you wish to be reported to the server.

In Appliance-only, Switch-only, and Wireless-only Dashboard Networks, syslog servers will be added under the "Logging" section instead of "Reporting".
Encrypted (TLS) syslog will be available for configuration at a future date.
If the Appliance Flows role is enabled for Meraki MX reporting, logging for individual firewall rules can be enabled/disabled on the Security & SD-WAN > Configure > Firewall page, under the Logging column as shown below:

Additional Considerations for Syslog
If the syslog server is across a VPN, the source IP will be 6.X.X.X provided no VLANs are in VPN mode, the MX is in passthrough mode or Routed/NAT Single LAN mode.
Storage Allocation
Syslog messages can take up a large amount of disk space, especially when collecting flows. When deciding on a host to run the syslog server, make sure to have enough storage space on the host to hold the logs. Consult the syslog-ng man page for further information on only keeping logs for a certain amount of time.
Expected Traffic Flow
Syslog traffic may flow to the syslog in one of three scenarios depending on the route type that is used to reach the syslog server. Below are example scenarios and a detailing of expected traffic behavior.
Scenario 1 - Reachable via LAN
The MX will source traffic from the VLAN interface that the server resides in if the syslog server is located on the LAN of the MX. The transit VLAN interface would be used if the device is only accessible via static route.
Scenario 2 - Reachable via Public Interface
The MX will source traffic from the public interface (WAN) if the syslog server is accessible via the WAN link.
Scenario 3 - Reachable via AutoVPN
The MX will source traffic from the interface of the highest VLAN that is participating in AutoVPN if the syslog server is accessible via AutoVPN.
If the traffic passes through the site-to-site AutoVPN connection the traffic will then be subject to the 'Site-to-site outbound firewall' rules and as such an allow rule may be required. This can be configured in Security & SD-WAN > Configure > Site-to-site VPN > Organization-wide settings > Add a rule as shown below.

API Reporting
Meraki devices also support the capability to use API calls to gather statistics and other information from your Meraki networks. The Dashboard API is a powerful, yet flexible, open-ended tool for a multitude of use cases. The following section will go into detail on the possible use cases for device and network reporting.
Configuring the Dashboard API
Cisco Meraki Dashboard API is enabled by default on all organizations. To generate an API key, go to the My Profile page accessed via the avatar icon in the top right-hand corner of dashboard. This API key will be associated with the dashboard administrator account which generates it and will inherit the same permissions as that account. You can generate, revoke, and regenerate your API key on your profile.
After clicking on the Generate new API key button, a window that contains the unique API key for your individual user will be displayed. It is critical that this API key is recorded down as once this window closes, the full key cannot be viewed on the Meraki dashboard. Once the key is copied down, check the checkbox for I have stored my new API key, and then click Done.
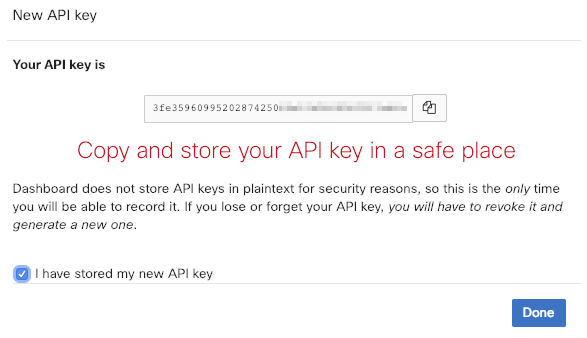
The page will refresh, and under the API access section, the API key that was just generated will display. Only the last 4 digits of the key will be displayed for security purposes.
NOTE: Only you will be able to view your unique API key. No one else that has access to the Meraki dashboard (including Meraki Support) is able to view your API key.

API Endpoints for Meraki Device and Network Reporting
| API Endpoint | API Call | Description |
| Client Security Events | Get Network Appliance Client Security Events | Gathers data on all security events for a specified dashboard network |
| Clients | Get Device Clients | Gathers data on all client devices connected to specific Meraki device, up to a maximum of one month |
| Devices | Get Network Device Loss and Latency History | Displays data on uplink loss percentage and latency (in milliseconds) for Meraki security appliance |
| Devices | Get Network Device Performance | Returns the performance score for a specified device. (Only MX security appliances are supported for this API call at this time) |
| Devices | Get Network Device Uplink | Returns the current uplink information of a specified device. |
| Devices | Get Network Devices | Lists all devices in the specified network |
| MV Sense | Get Device Camera Analytics Live | Returns live state form camera of analytics zones configured |
| MV Sense | Get Device Camera Analytics Overview | Returns overview of aggregate analytics data for timespan specified |
| MV Sense | Get Device Camera Analytics Recent | Returns the most recent record for analytics zones configured |
|
MV Sense |
Get Device Camera Analytics Zone History | Returns historical records for analytic zones configured |
| MV Sense | Get Device Camera Analytics Zones | Returns all configured analytic zones for specified camera |
| Networks | Get Network Air Marshal | Lists the Air Marshal scan results for the specified network |
| Networks | Get Network Traffic | Gathers traffic analysis data for the specified network |
| Organizations | Get Organization Device Statuses | Lists the current status is every Meraki device in the specified Organization |
| Organizations | Get Organization License State | Returns the license state for the specified Organization |
| Organizations | Get Organization Uplinks Loss and Latency | Returns the uplink loss and latency measurements for every MX in the Organization. (From 2 - 7 minutes ago) |
| Splash Login Attempts | Get Network Splash Login Attempts | Lists the number of login attempts for a splashpage on the specified network |
| Wireless Health | Get Network Clients Connection Stats | Gathers aggregated connectivity information for wireless clients in the specified network |
| Wireless Health | Get Network Clients Latency Stats | Gathers aggregated wireless latency for clients on the specified network |
| Wireless Health | Get Network Connection Stats | Gathers aggregated connectivity data for the specified network |
| Wireless Health | Get Network Devices Connection Status | Lists client connectivity data on a per-AP basis for the specified network |
| Wireless Health | Get Network Devices Latency Stats | Lists the amount of wireless latency data on a per-AP basis for the specified network |
| Wireless Health | Get Network Failed Connections | Lists all failed client connection events on the specified network based on time frame given |
| Wireless Health | Get Network Latency Stats | Lists aggregated wireless latency information for the entirety of the specified network |
To learn more about using API with the Meraki dashboard, please visit Cisco Meraki DevNet at https://developer.cisco.com/meraki/
Meraki Dashboard Webhooks
Meraki Webhooks are a powerful and lightweight way to subscribe to alerts sent from the Meraki Cloud if an event takes place that sets off a configured dashboard alert. They include a JSON formatted message and are sent to a unique URL where they can be processed, stored or used to trigger powerful automations. This solution provides you with a rapid way to setup a hosted service capable of receiving and storing any webhook alert data.
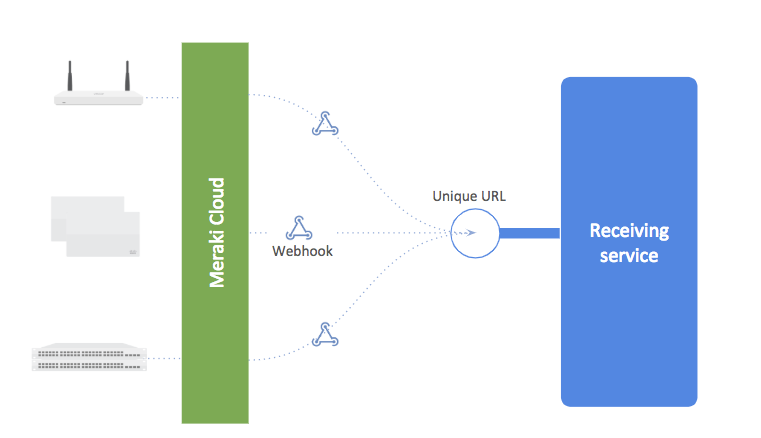
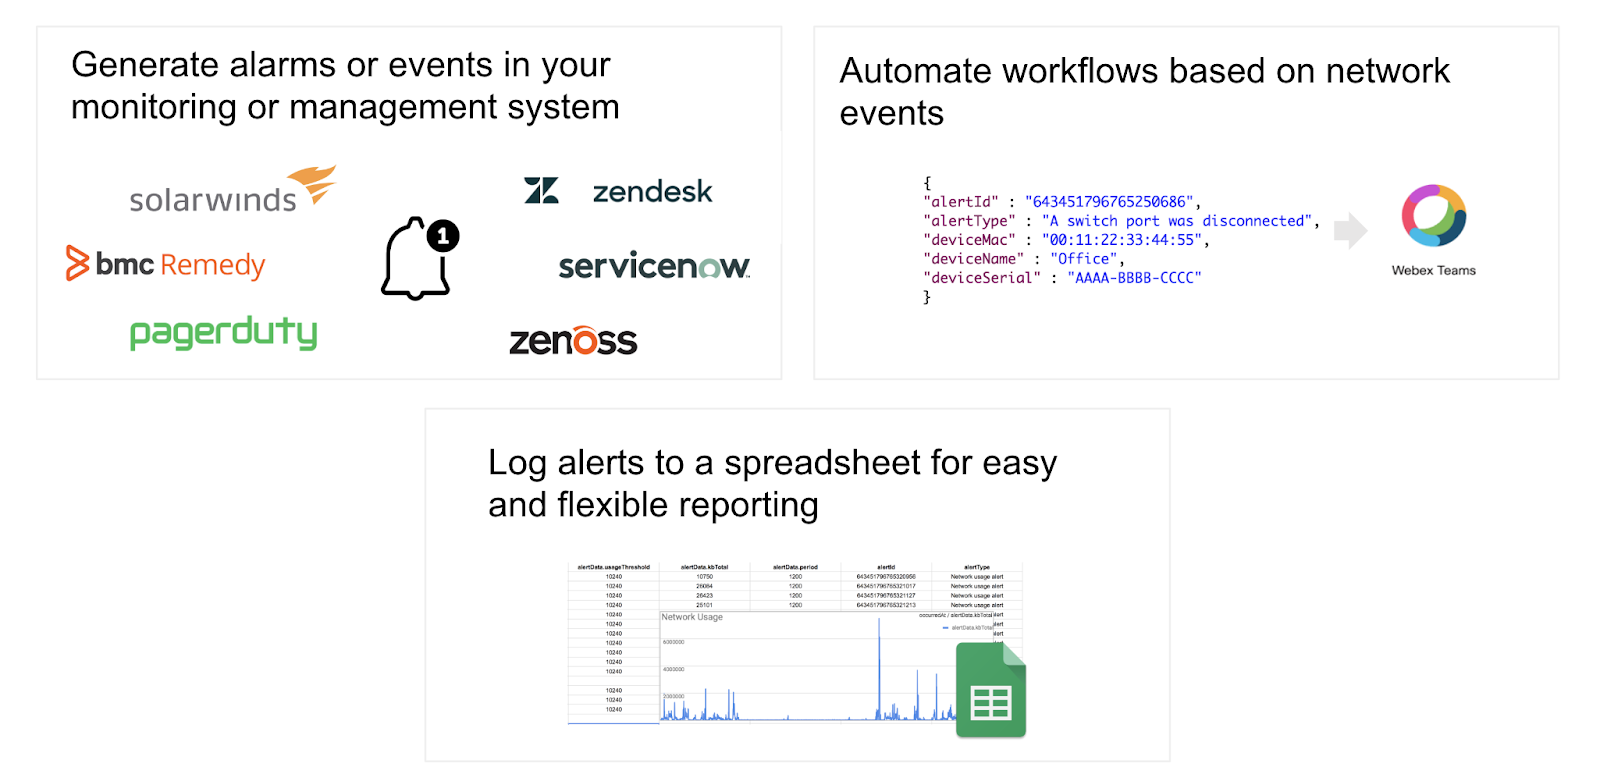
Webhooks support all configurable alert types available in the dashboard under Network-wide > Configure > Alerts. This includes a variety of alerts for all product types that you own or operate. The webhooks architecture consists of the Meraki cloud and a cloud-accessible HTTP or HTTPS receiver (server). There are a variety of standalone cloud webhook services (e.g. hook.io, Zapier, etc.) that are able to receive and/or forward webhooks.
Webhooks Dashboard Setup
To configure Webhooks on the Meraki dashboard, navigate to Network-Wide > Configure > Alerts. On the Alerts page, you will see a section for Webhooks. From here, click on Add an HTTP server, and configure the server URLs as shown below.

Now that the HTTP servers are specified for Webhooks alerts, the servers need to be specified as recipients for Dashboard alerts.

Zapier and Built.io are tools that can be used to integrate and automate API applications. Either can be used for the setup of Meraki dashboard Webhooks.
For more information about setting up and using Webhooks, please visit https://developer.cisco.com/meraki/webhooks/
Additional Webhooks Considerations
See Additional Alerting Considerations for event types which will be rate limited.
SNMP Configuration
Simple Network Management Protocol (SNMP) allows network administrators to query devices for various types of information. Meraki allows SNMP polling to gather information either from the dashboard or directly from Meraki devices themselves, including MR access points, MS switches, and MX security appliances. Third party network monitoring tools can use SNMP to monitor certain parameters on Meraki devices.
SNMP Device Information
The following information below can be polled from the Meraki dashboard
-
Device MAC address
-
Device Serial number
-
Device Name
-
Device Status (Online or Offline)
-
Device Last Contacted - Date and Time
-
Mesh Status (Gateway or Repeater)
-
Public IP Address
-
Product Code (e.g. MR18-HW)
-
Product Description (e.g. Meraki Cloud-controller 802.11n AP)
-
Name of the Network that the device resides in (Dashboard Network)
-
Packets/Bytes In/Out on each physical interface
Standard MIB support
SNMP servers use a Management Information Base, or MIB, which is a database of SNMP Object Identifiers, or OIDs. OIDs identify the managed objects that inform the SNMP server on what values to poll from the device.
The Meraki dashboard and Meraki SNMP capable devices support the following standard MIBs:
-
SNMPv2-MIB .1.3.6.1.2.1.1
-
IF-MIB .1.3.6.1.2.1
Meraki Proprietary MIB
The Meraki dashboard has its own proprietary MIB to allow SNMP servers to pull data and information from the Meraki dashboard. This MIB document can be located and downloaded from the dashboard under Organization > Configure > Settings > SNMP. The Meraki Cloud MIB cannot be used to poll information from Meraki devices directly, as it is designed strictly for Dashboard information.
Configuration Options
Dashboard SNMP Polling
The Meraki dashboard can be configured for SNMP polling under Organization > Configure > Settings > SNMP. Here you see two options for SNMP configuration which is SNMP Version 2C and Version 3. Once SNMP has been enabled you will be able to send the SNMP requests to the host that is defined directly under the enable setting. The community string and a sample command to extract information via SNMP requests are then displayed as well.
NOTE: There are three versions available for configuration for SNMP. These versions are: Version 1, Version 2c, and Version 3
- Versions 1 and 2c allow for a simple community string to be defined. This string will be used between the SNMP server and reporting devices to validate the connection
- Version 3 includes authentication and encryption for added security. Version 3 requires that a username and password be defined
Note: Cisco strongly recommends disabling SNMP V2C and only using SNMP V3 with Authentication mode SHA and Privacy mode AES128 for the highest level of security.

IP restrictions must be configured to restrict SNMP access to particular IP addresses in the customer environment when using v2c. SNMP versions 1 and 2 send the community string in clear text, so IP restrictions are required to prevent unauthorized SNMP access if the community string is intercepted or learned by another party. They are recommended for v3 but not required.
Local Device SNMP Polling
Individual Meraki devices can also be polled locally. In this scenario the SNMP traffic would stay within the local network and each device would need to be polled from the network management system. These settings can be found under Network-wide > Configure > General > SNMP:

Note: Cisco strongly recommends using SNMP V3 with Privacy mode AES128 for the highest level of security.
SNMP Traps
We recommend considering using webhooks instead of SNMP traps if your network environment allows for it, as webhooks have greater coverage.
SNMP traps are proactive SNMP messages that are sent out when specific networking events take place. SNMP traps are very useful for real-time alerting for your networking environment. SNMP traps can be configured to be sent from the Meraki cloud. SNMP traps are closely related to the possible Alerts that can be configured for your network. SNMP traps use SHA1 for authentication and AES for privacy.
SNMP Traps can be configured under Network-Wide > Configure > Alerts. The SNMP Traps section will be set to Disabled. Again, you will have the option to enable SNMP Version 2c or Version 3.
Note: Cisco strongly recommends using SNMP v3 for the highest level of security.
In the example below, the SNMP Access level is set to V3 (username/password). Specify a valid SNMP user by clicking on Add an SNMP user. Input the desired username and password that is also configured on the SNMP server. Once that is done, enter in the Receiving server IP address, which will need to be a public IP address. It is best practice to configure the receiving server ports with either UDP port 161 or 162, as these are the default ports SNMP servers. listen on.

If the SNMP server is behind a NAT device, a port forwarding rule will need to be configured to allow the SNMP traffic through. This due to the nature of the SNMP traps being sent from the Meraki cloud controller. Be sure to specify the correct LAN IP address of the SNMP server, as well as the UDP ports it is listening on.
Defining SNMP Traps to be Sent
SNMP traps are closely tied to the alerts that can be configured under Network-Wide > Configure > Alerts. In order for SNMP traps to be generated, SNMP must be configured as a recipient for the alert to generate the SNMP trap. Either SNMP can be input as a default recipient so all enabled alerts generate a trap, or SNMP can be configured on a per alert basis.
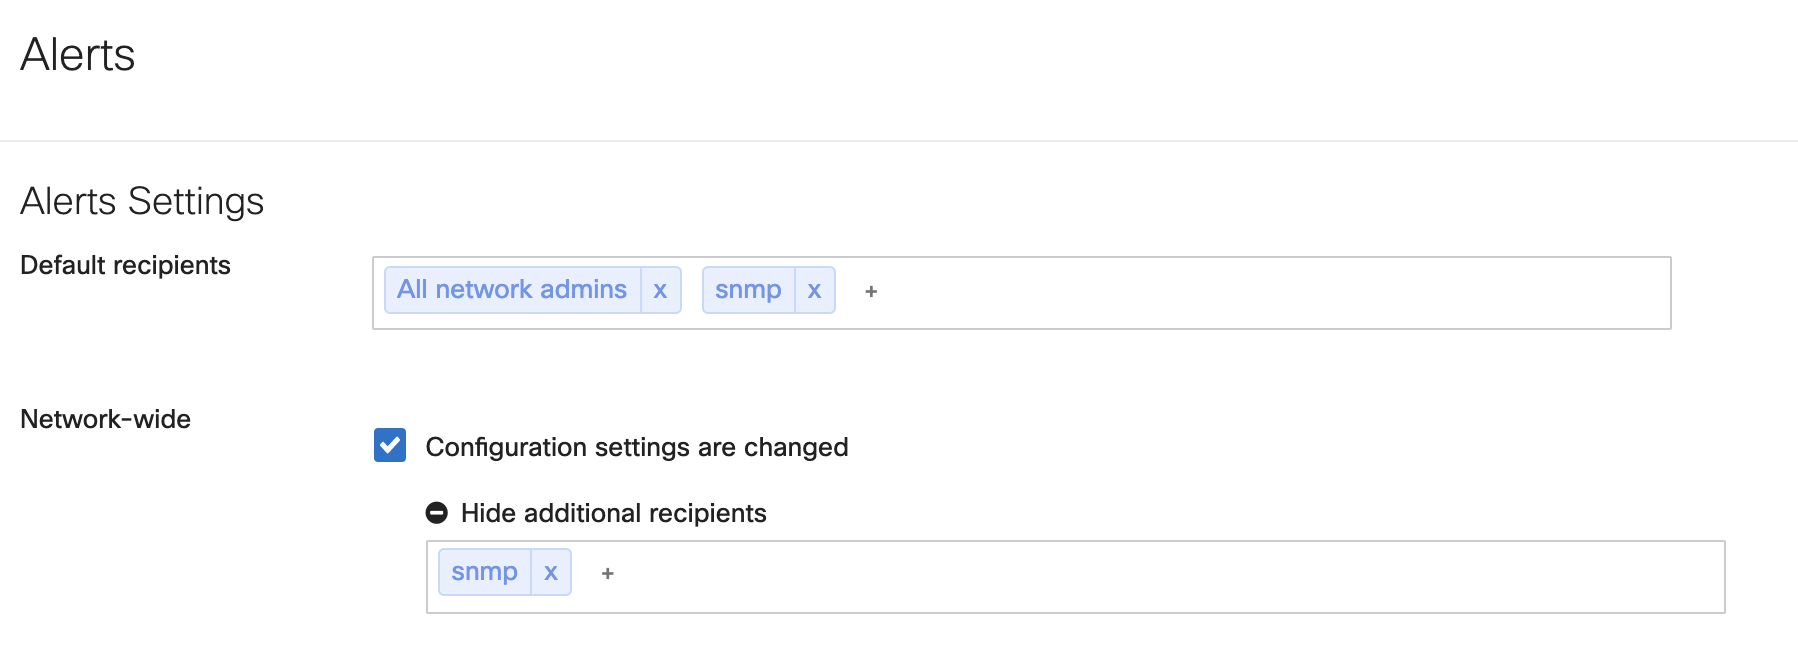
Once SNMP traps are enabled and configured to send, alerts that trigger SNMP traps to be sent must be enabled and set up appropriately. Below is a list of SNMP traps, and their respective dashboard alerts.
|
SNMP Trap Sent |
Meraki Dashboard Alert |
Alert Category |
|
Settings Changed |
Configuration settings are changed |
Network-Wide |
|
VPN Connectivity Change |
A VPN connection comes up or goes down |
Network-Wide |
|
Foreign AP Detected |
A rogue access point is detected |
Network-Wide |
|
Device Goes Down/Device Comes Online |
A gateway goes offline |
Wireless |
|
Device Goes Down/Device Comes Online |
A repeater goes offline |
Wireless |
|
Gateway to Repeater |
A gateway becomes a repeater |
Wireless |
|
Device Goes Down/Device Comes Online |
A WAN appliance goes offline |
WAN Appliance |
|
Uplink Status Changed |
Primary uplink status changes |
WAN Appliance |
|
No DHCP leases |
The DHCP lease pool is exhausted |
WAN Appliance |
|
IP Conflict |
An IP conflict is detected |
WAN Appliance |
|
Cellular Network Up/Cellular Network Down |
Cellular connection state changes |
WAN Appliance |
|
Rogue DHCP Server |
A rogue DHCP is detected |
WAN Appliance |
|
Warm Spare Failover Detected |
A warm spare failover occurs |
WAN Appliance |
|
Malware Blocked |
Malware is blocked |
WAN Appliance |
|
Malware Detected |
Malware is downloaded |
WAN Appliance |
|
Device Goes Down/Device Comes Online |
A switch goes offline |
Switch |
|
New DHCP Server Alert |
A new DHCP server is detected on the network |
Switch |
|
Port Disconnected/Port Connected |
Any port goes down |
Switch |
|
Port Cable Error |
Any port detects a cable error |
Switch |
|
Port Speed Change |
Any port changes link speed |
Switch |
|
Power Supply Down/Power Supply Up |
A power supply goes down |
Switch |
|
Redundant Power Supply Backup/Redundant Power Supply Back to Primary |
A redundant power supply is powering a switch |
Switch |
|
UDLD Error |
Unidirectional link detection (UDLD) errors exist on a port |
Switch |
|
Critical Temperature |
A switch is operating at critical temperature |
Switch |
|
Device Goes Down/Device Comes Online |
A camera goes offline |
Camera |
|
Device Goes Down/Device Comes Online |
A cellular gateway goes offline |
Cellular Gateway |
SNMP traps cannot be sent for any Systems Manager alerts. If a trap and its associated alert is not listed above, Meraki devices do not send traps for it.
Also note that if devices go down and are not communicating with the dashboard, the trap will be sent after the specified amount of time configured for the alert.
Related Resources
Articles listed below contain more information about each feature mentioned in this document: