Finding Logs for Android Troubleshooting
To access this logging, perform the following steps:
Enabling Developer Mode and USB Debugging
- Navigate to Settings > About or About phone and tap on the Build number entry 7 times.
- Go back one level and select Developer options.
- Enable USB Debugging on this menu.
Accessing USB Debug Logs
Specific processes vary by OS/Device Manufacturer, but it's recommended to search for the phrase "fatal exception."
The processes below can vary based on the computer manufacturer, end device manufacturer, and Android Studio / ADB version. This is meant to be used as a guide but specific variations may be present which might require support from the device manufacturer. It is recommended that, if a device is not recognized by either method mentioned below, the following items are verified.
- USB debugging is enabled (If the device is already enrolled, USB debugging may be restricted. Allow USB debugging by pushing an "Android Restrictions" profile from "SM -> Settings" with the option "Prevent Android Debug Bridge (ADB) access" unchecked
- Try different USB cables including one provided by the device manufacturer (especially important with Samsung devices)
- Multiple ports on the computer (devices may operate differently on different USB versions)
- Most up to date version of Android Studio / ADB
- Most up to date version of device drivers
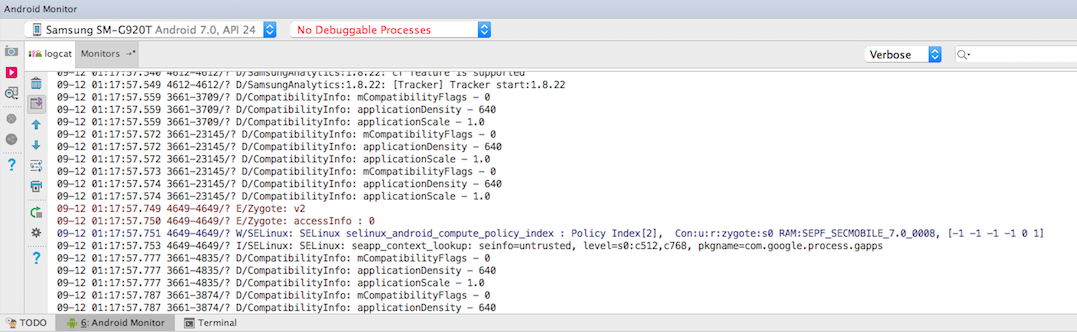
Via Android Studio
- Install Android Studio.
- Launch the program. You may need to create a new empty project to see the monitoring interface.
- Connect the device via USB, and trust the computer signature to begin logging.
- Logs can be copied out of the monitor panel, or saved as described in this article.
Via ADB
- Download the Android SDK:
- Navigate to https://developer.android.com/studio...platform-tools and download the "SDK Platform-Tools" for the desired OS.
- Unzip the archive and place the "platform-tools" folder in an easily accessible location. These steps will assume use of the host machine's desktop directory.
- In a command line / terminal window, navigate to the "platform-tools" folder:
- Windows:
cd C:\Users\[USER]\Desktop\platform-tools - macOS:
cd ~/Desktop/platform-tools
- Windows:
- Ensure the device is populating as an ADB device:
- Windows:
adb devices - macOS:
./adb devices
- Windows:
- Modify the default logging values for ADB:
- Windows:
adb logcat -G 32M; adb shell setprop persist.log.tag.dpcsupport VERBOSE; adb shell setprop persist.log.tag.Finsky VERBOSE; adb shell setprop persist.log.tag.Auth VERBOSE; adb shell setprop persist.log.tag.PackageManager VERBOSE; adb shell setprop persist.log.tag.JobScheduler VERBOSE - macOS:
./adb logcat -G 32M; ./adb shell setprop persist.log.tag.dpcsupport VERBOSE; ./adb shell setprop persist.log.tag.Finsky VERBOSE; ./adb shell setprop persist.log.tag.Auth VERBOSE; ./adb shell setprop persist.log.tag.PackageManager VERBOSE; ./adb shell setprop persist.log.tag.JobScheduler VERBOSE
- Windows:
- Begin log output:
- Windows:
adb logcat > C:\Users\[USER]\Desktop\androidlogs.txt - macOS:
./adb logcat > ~/Desktop/androidlogs.txt
- Windows:
- Reproduce the issue during log collection
- Stop log streaming:
- Windows/macOS:
^C(control + C)
- Windows/macOS:
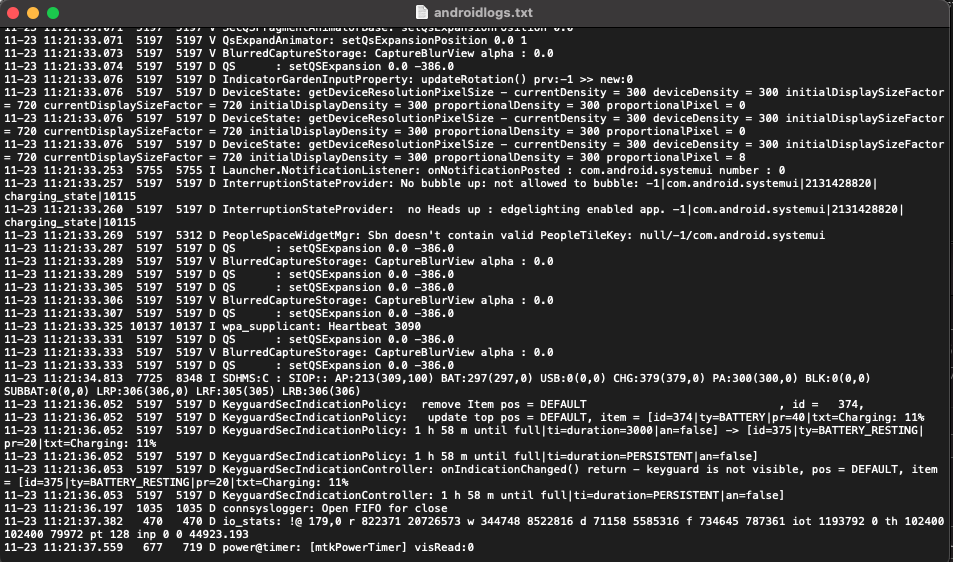
- The resulting file "androidlogs.txt" should appear on the desktop. These logs should appear similar to the below image: