
Systems Manager Logging and Troubleshooting
This article is intended to assist in basic to intermediate troubleshooting of common Systems Manager issues, as well as expose the tools needed to troubleshoot more advanced issues/cases.
Initial Steps
When experiencing an issue with Systems Manager, the first step is usually to take a look at an example client which is exhibiting the behavior. Once you have identified an example device, its logging will describe the issue and provide suggestions on how to fix it.
Dashboard-Side Logging 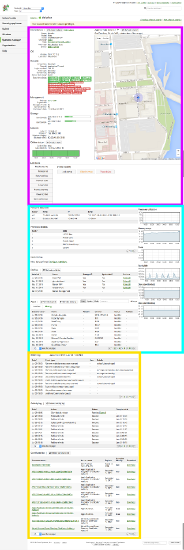
The primary logging location in SM is the Client Details page, and is always the first/easiest place to look. Here you can find three primary banks of data:
- The client details bank (Magenta)
- Displays current state/stance and vital statistics such as MAC Address, Local/Public IP, profile/app update state, OS Level, Check-in time, etc.
- The Restrictions/Profiles/Apps bank (Cyan)
- The Restrictions table displays a list of Restrictions on a client device, enforced by its profile(s).
- The Profiles table lists all configuration Profiles installed on the client, including how they were installed and whether there is an update pending for them.
- The Apps table lists all Apps Either Installed or Scoped for this device (Apps which are scoped but not installed will be under the 'Missing' Tab).
- The Logging/Data Bank (Yellow)
- The Event log lists each command/response pair that has been transmitted to/received from the client device.
- The Activity log lists the actions which have recently been performed on the device as well as the completion state and any error messaging associated with it. When an error is thrown on one or more of these commands, the error text will be displayed in the status column as a hyperlink, and the link destination will open a popup with the full text of the error, including any associated error codes.
Client-Side Logging
If Dashboard-side logging isn't getting you anywhere, each OS includes logs that are local to the client devices.
It's important to remember that the majority of this logging is only temporarily available, so it's recommended to start capturing logs prior to triggering the broken behavior. Make sure to save/export these logs as soon as they're captured.
iOS
Device logs are very useful to determine a device's local behavior when troubleshooting. There are two types of logging which can be gathered: console logs or full sysdiagnose logs.
Always make sure to reproduce the issue/behavior while the logs are being captured. If possible, note the timestamp where an issue/behavior occurred and add this information when you submit a log to Meraki Support.
Using Apple Configurator (console logging)
The following instructions explain how to use Apple Configurator on macOS to collect an iOS device's console logs. iOS device logs are extremely useful for troubleshooting and may be required to review in technical situations.
1. On a macOS device install and launch Apple Configurator 2.

2. Connect an iOS device to the macOS device via USB cable. Be sure to tap "Trust" on the iOS device, if prompted.
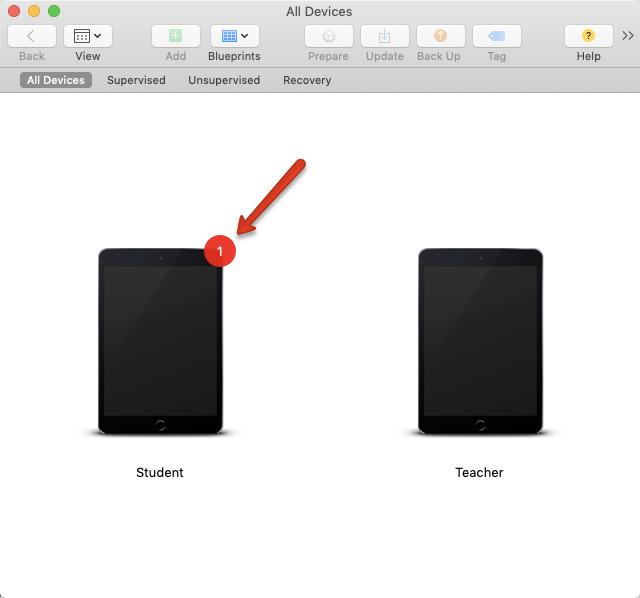
3. Apple Configurator should automatically detect the iOS device (which is plugged into the macOS device via USB cable). Double-click on the icon for the target device.
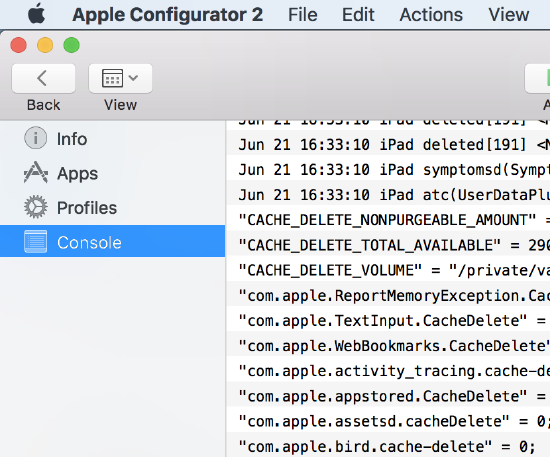
4. In the left sidebar click on Console
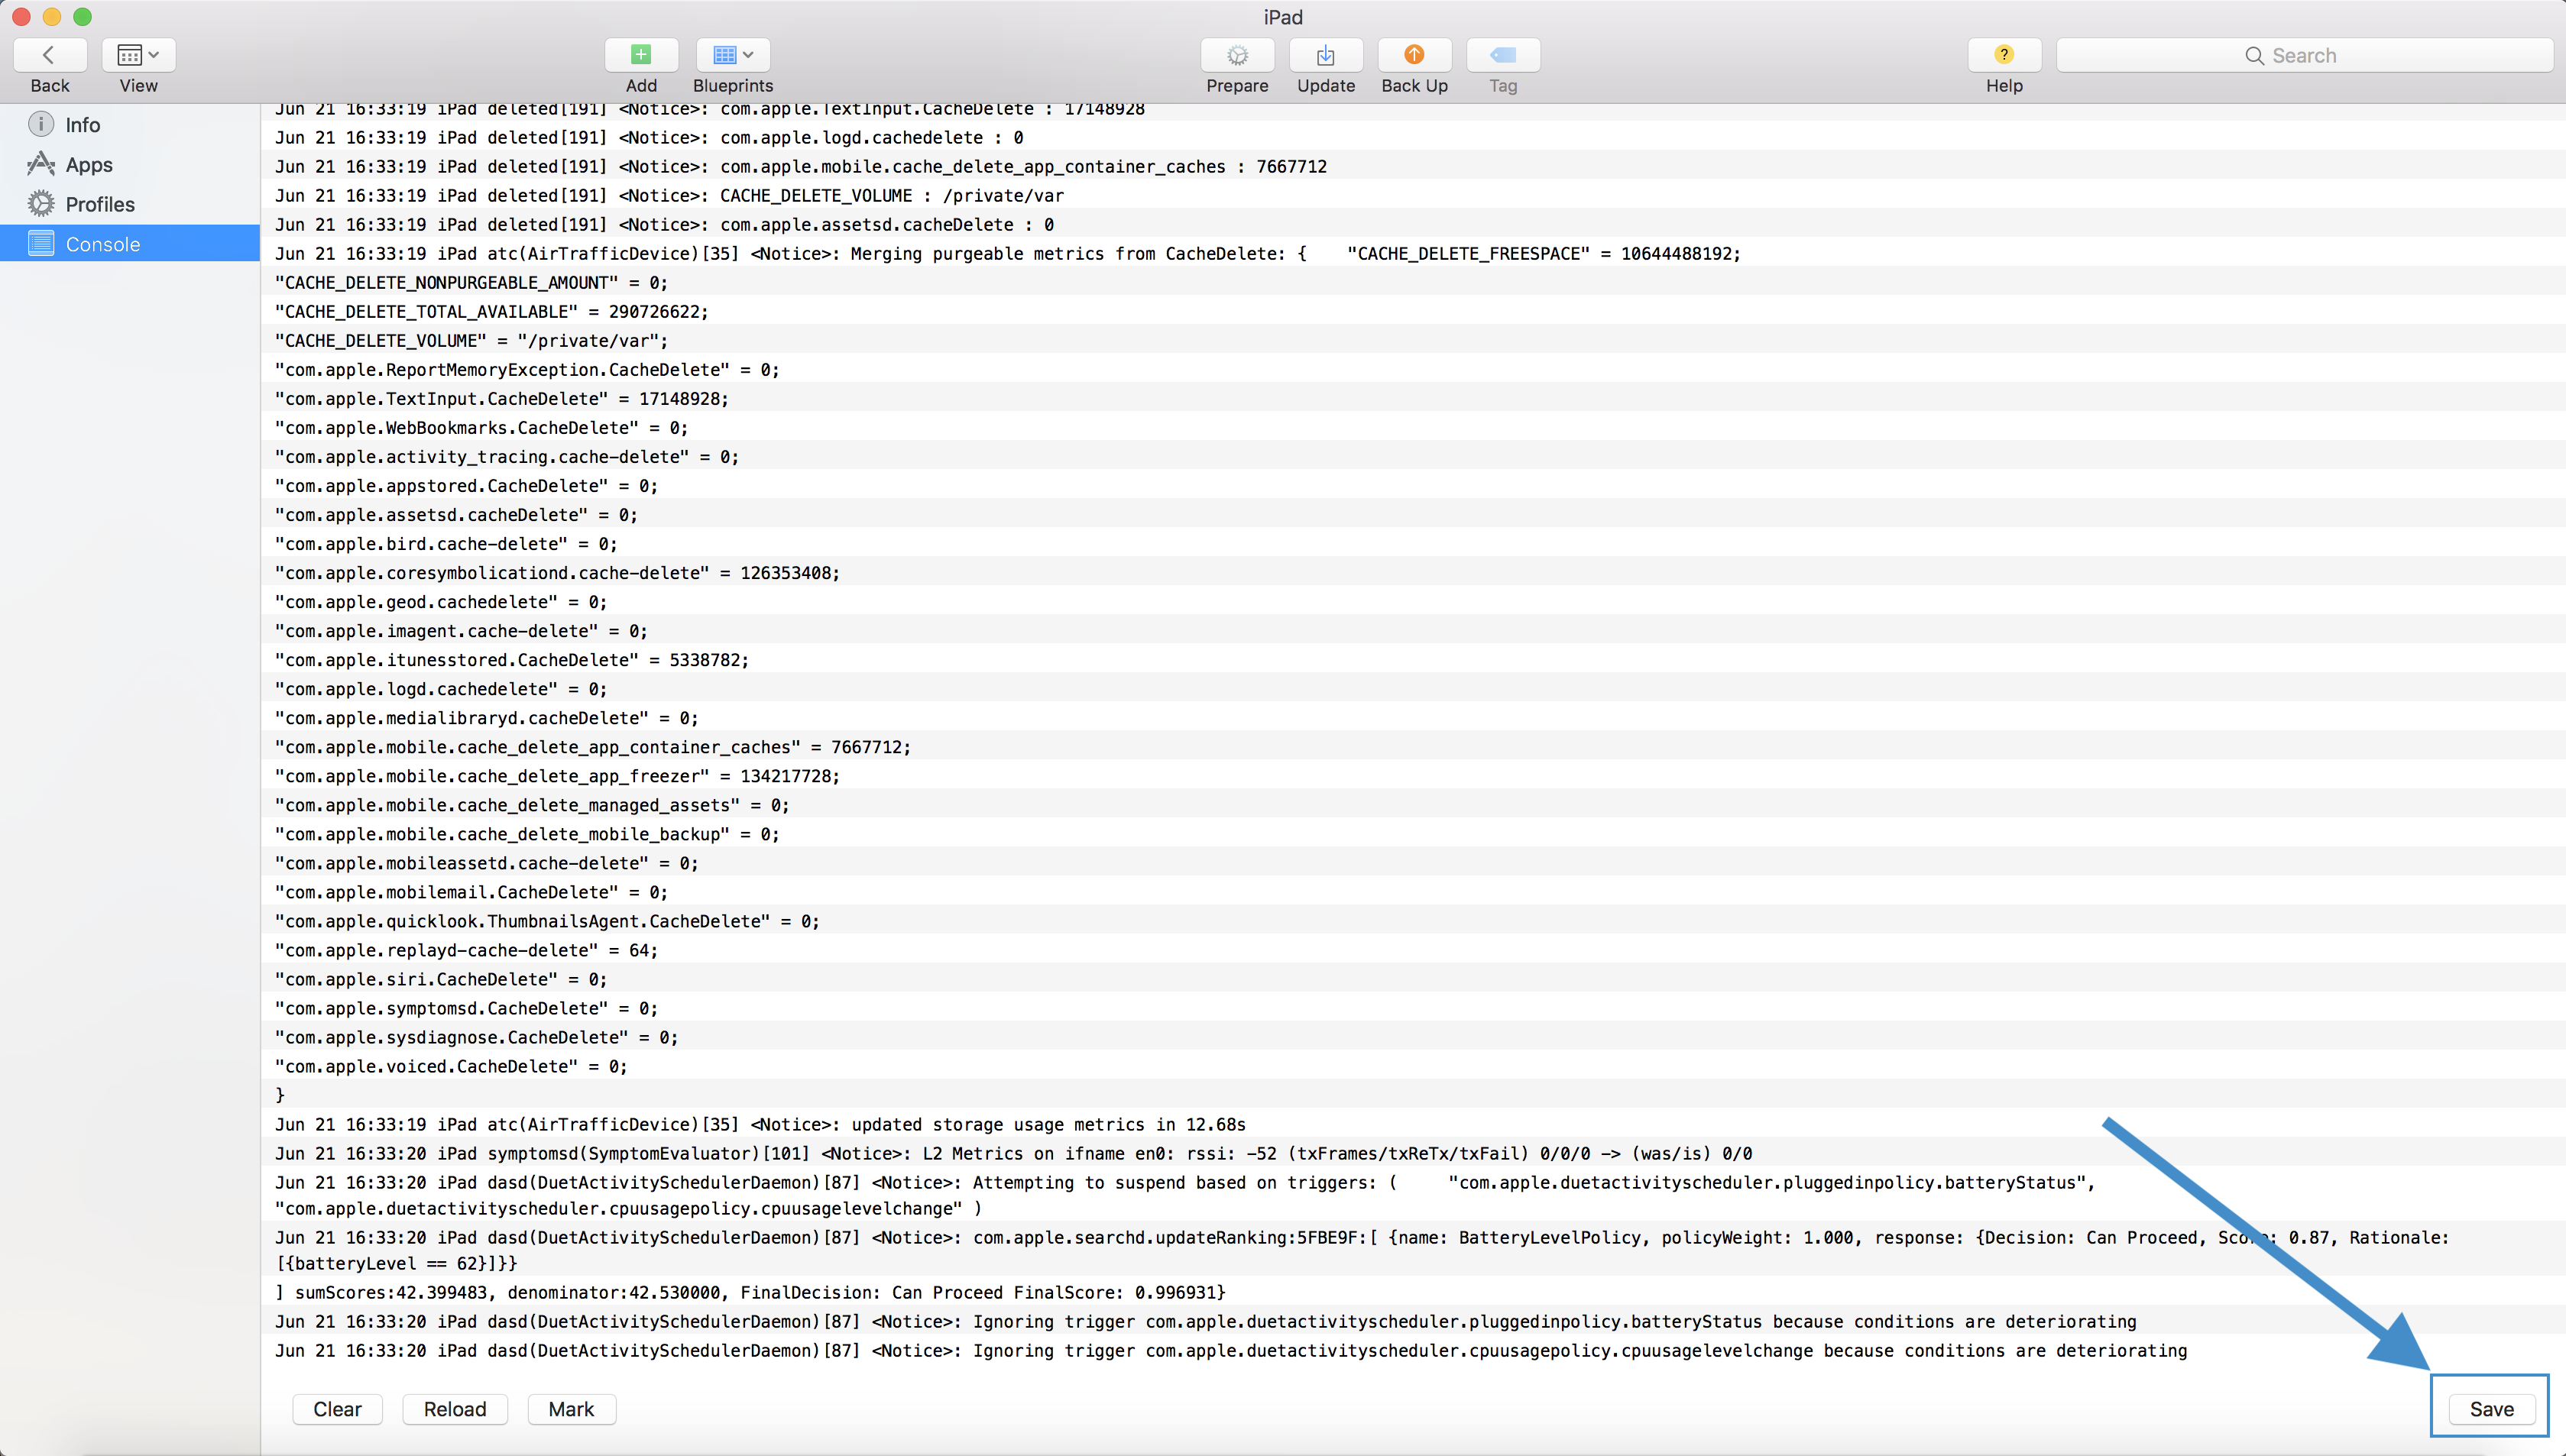
5. At this time, attempt to recreate the iOS device's problem so the events are captured in this log file.
6. After capturing the iOS device's problem in this logging, press on Save on the bottom right. This file.log can be now review and shared for additional analysis.
In this file.log feel free to review the following most common MDM processes:
- mdmd (iOS mdm daemon)
- Meraki MDM (the App process)
- profiled (profile installation and management daemon)
Sysdiagnose logs (verbose logging)
Sysdiagnose is a type of log which contains additional verbosity and is useful in more complex troubleshooting scenarios. Apple has instructions to enable this logging which is available to all Apple Developers. After creating a free or paid Apple Developer account, use the sysdiagnose (Unredacted) tool which can gather these logs using both macOS and Windows devices, or can be pulled directly from the iOS device itself.
Android Logs
To access this logging, perform the following steps:
Enabling Developer Mode and USB Debugging
- Navigate to Settings > About or About phone and tap on the Build number entry 7 times.
- Go back one level and select Developer options.
- Enable USB Debugging on this menu.
Accessing USB Debug Logs
Specific processes vary by OS/Device Manufacturer, but it's recommended to search for the phrase "fatal exception."
The processes below can vary based on the computer manufacturer, end device manufacturer, and Android Studio / ADB version. This is meant to be used as a guide but specific variations may be present which might require support from the device manufacturer. It is recommended that, if a device is not recognized by either method mentioned below, the following items are verified.
- USB debugging is enabled (If the device is already enrolled, USB debugging may be restricted. Allow USB debugging by pushing an "Android Restrictions" profile from "SM -> Settings" with the option "Prevent Android Debug Bridge (ADB) access" unchecked
- Try different USB cables including one provided by the device manufacturer (especially important with Samsung devices)
- Multiple ports on the computer (devices may operate differently on different USB versions)
- Most up to date version of Android Studio / ADB
- Most up to date version of device drivers
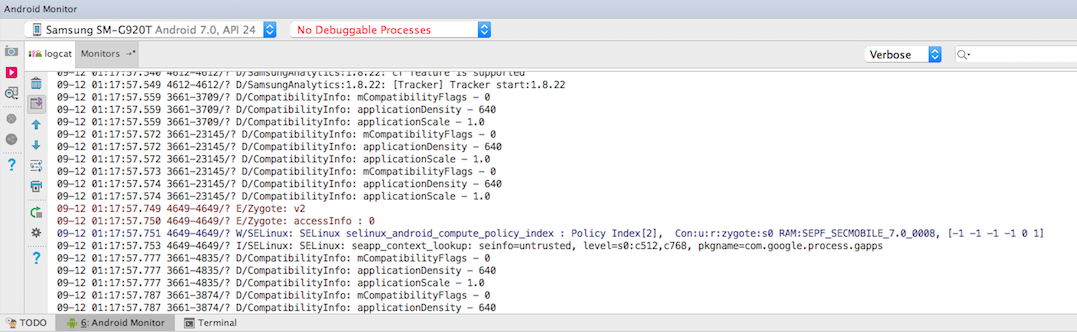
Via Android Studio
- Install Android Studio.
- Launch the program. You may need to create a new empty project to see the monitoring interface.
- Connect the device via USB, and trust the computer signature to begin logging.
- Logs can be copied out of the monitor panel, or saved as described in this article.
Via ADB
- Download the Android SDK:
- Navigate to https://developer.android.com/studio...platform-tools and download the "SDK Platform-Tools" for the desired OS.
- Unzip the archive and place the "platform-tools" folder in an easily accessible location. These steps will assume use of the host machine's desktop directory.
- In a command line / terminal window, navigate to the "platform-tools" folder:
- Windows:
cd C:\Users\[USER]\Desktop\platform-tools - macOS:
cd ~/Desktop/platform-tools
- Windows:
- Ensure the device is populating as an ADB device:
- Windows:
adb devices - macOS:
./adb devices
- Windows:
- Modify the default logging values for ADB:
- Windows:
adb logcat -G 32M; adb shell setprop persist.log.tag.dpcsupport VERBOSE; adb shell setprop persist.log.tag.Finsky VERBOSE; adb shell setprop persist.log.tag.Auth VERBOSE; adb shell setprop persist.log.tag.PackageManager VERBOSE; adb shell setprop persist.log.tag.JobScheduler VERBOSE - macOS:
./adb logcat -G 32M; ./adb shell setprop persist.log.tag.dpcsupport VERBOSE; ./adb shell setprop persist.log.tag.Finsky VERBOSE; ./adb shell setprop persist.log.tag.Auth VERBOSE; ./adb shell setprop persist.log.tag.PackageManager VERBOSE; ./adb shell setprop persist.log.tag.JobScheduler VERBOSE
- Windows:
- Begin log output:
- Windows:
adb logcat > C:\Users\[USER]\Desktop\androidlogs.txt - macOS:
./adb logcat > ~/Desktop/androidlogs.txt
- Windows:
- Reproduce the issue during log collection
- Stop log streaming:
- Windows/macOS:
^C(control + C)
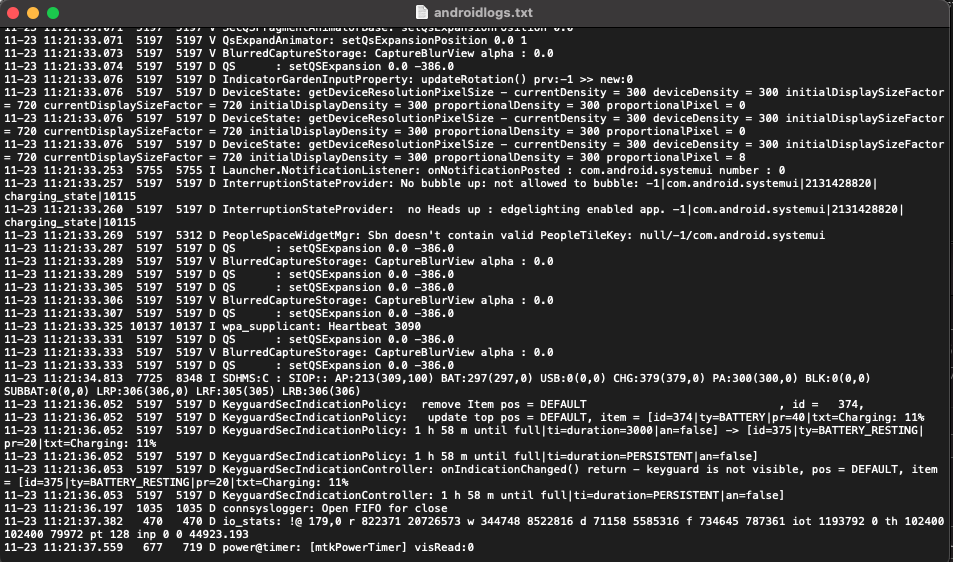
- Windows/macOS:
- The resulting file "androidlogs.txt" should appear on the desktop. These logs should appear similar to the below image:
macOS
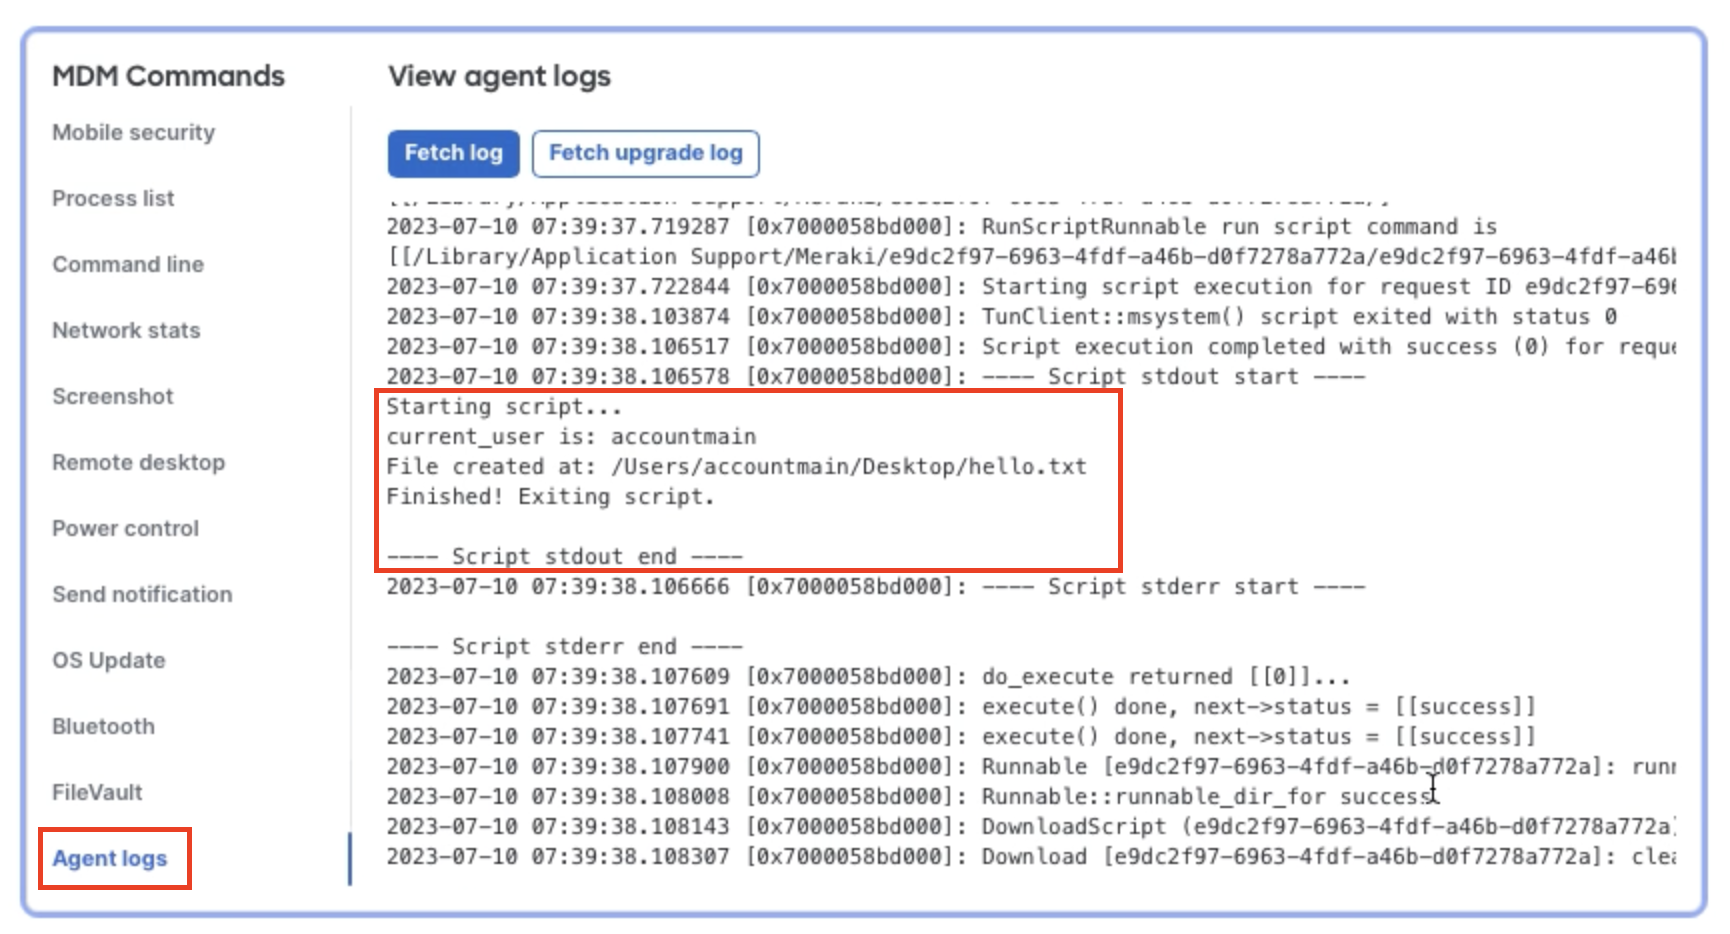
macOS Meraki Agent logs can be pulled from Dashboard while the device is online by using the Agent logs > fetch logs button. This can be used to debug custom app deployments, script deployments (like shown below), agent upgrades, agent connectivity, and much more.
Agent logs on MacOS can be found at the following location:
/var/log/m_agent.log
Console logs deal with system events, dialog text, errors, status, and other communications. To gather these logs on MacOS, use the "Console" application (/System/Applications/Utilities/Console.app). Click "start" to begin collecting logs, reproduce the issue, then click pause to stop the log stream.
To collect existing logs from a device, a sysdiagnose command must be run:
sudo sysdiagnose
When the sysdiagnose has finished running, a finder window should open at the location of the log file (/private/var/tmp/). Unpacking this archive file will reveal a number of files including the system log file "system_logs.logarchive" which can be opened with the console application.
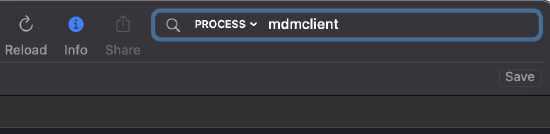
The primary process whose messages may assist is:
- mdmclient: the MDM Management Daemon on macOS
Filtering can be done on the log file by entering "mdmclient" in the search bar, then selecting "process" as the search method:
Windows
Windows Meraki Agent logs can be pulled from Dashboard while the device is online by using the Agent logs > fetch logs button. This can be used to debug custom app deployments, script deployments (like shown below), agent upgrades, agent connectivity, and much more.
Agent logs on Windows vary by agent version. These logs can be found locally at the following locations:
Agents ≤ 3.6.0:
C:\Windows\temp\m_agent_service.log
Agents ≥ 3.7.0:
C:\ProgramData\Meraki\Systems Manager Agent\Logs\m_agent_service.log
Agents ≥ 4.0.0:
C:\ProgramData\Meraki\Endpoint Agent\Logs\m_agent_service.log
The C:\ProgramData directory is a hidden folder which will only be visible in the file explorer when "Show hidden files and folders" is selcted in file exporer.
System logs are found in the Event Viewer:
Windows Logs/Application and Services/Microsoft/Windows/DeviceManagement-Enterprise-Diagnostics-Provider/Admin
Using Logs to Troubleshoot
The following table describes common error messages organized by OS/Type:
| OS(s) | Error Code | Error Text | Reason | Fix | Notes |
| iOS/MacOS | Profile Installation Failed: An SSL Error has occurred and a secure connection to the server cannot be made. | Proxy or MITM device is manipulating the payload/traffic containing the payload | Add the client to allow list | ||
| iOS | 1000 |
Domain: MCProfileErrorDomain |
Most commonly, the user/owner assigned to the device is not a member of a valid ASM Group | Assign the user to a valid group in ASM | |
| iOS | 1006 | Profile could not be decrypted | Device has received an encrypted payload but is incapable of decrypting it | Remove DEP settings, set up the device, upgrade iOS, re-add DEP settings, factory reset client | |
| iOS | 2003 | Domain: MCPayloadErrorDomain The field “UserName” is invalid. | EAP authentication information is incomplete for a WiFi Profile | Include a password with the Username in the EAP configuration in the WiFi Profile | This will only effect iOS 9+ Supervised devices |
| iOS | 4001 | Domain: MCInstallation Error | Profile installation error general fault | Remove the faulting part of the profile before deployment | This error is generally thrown when a profile cannot be installed on a client but doesn't otherwise have a more specific error message. Examples of this include pushing a Passcode payload while modification of passcode is disallowed and pushing supervised settings to non-supervisied devices. |
| iOS | 12021 | Domain:* MCMDMErrorDomain“ScheduleOSUpdate” is not a valid request type. | Device needs to be DEP Supervised to execute an OS Update command | DEP Supervise the client | |
| iOS | 12023 | Domain:* MCMDMErrorDomain“ The iTunes Store ID of the application could not be validated. |
Generic 'App License Unavailable' Error message Possible causes:
|
Possible Solutions:
|
|
| iOS | 12026 | Domain:* MCMDMErrorDomain“ The app “com.generic.app” is already scheduled for management. | The app is already in the client's installation queue. Generally speaking, this error is safe to ignore | Wait | If the app never installs, look for messages from the installd process |
| iOS | 12064 | Domain: MCMDMErrorDomain License for app "X” could not be found. | License for the app is not available on the client | Unscope and rescope the client for this app | This message will only occur with the App configured to use Device License Assignment |
| iOS, MacOS | 'Error - Activation Lock Bypass code not found with Apple. Is activation lock already disabled?' | Activation Lock Bypass command was already acknowledged by Apple's servers | Attempt to restart the client device, associate it to wifi, wait 10, restart setup assistant (home button), try again | This doesn't always work, but if these steps fail contact Apple for Activation Lock Bypass assistance | |
| iOS | Error - License for app "com.generic.app" could not be found |
|
|
||
| MacOS/Windows Agent | curl error 5 |
Couldn't resolve proxy. The given proxy host could not be resolved. Typically this means that something upstream is firewalling the connection |
Open TCP993 Outbound to Dashboard | This error may also mean that there are no remaining licenses on dashboard, so be sure to check to see if the dashboard has hit its license limit. | |
| MacOS/Windows Agent | curl error 6 |
Couldn't resolve host. The given remote host was not resolved. Typically this indicates that something is attempting to manipulate the traffic (SSL Intercept Proxy) |
Add the client/traffic to allow list (not in dashboard, on that device whatever it is) | It's important to remember that TCP993 is also the IMAPS port, so when you are looking for what device is manipulating our datastream, also look at any Email Filtering systems or local Anti-Virus systems | |
| MacOS/Windows Agent | curl error 7 or curl error 60 | Typically this occurs on config fetch when the client is attempting to contact https://cf.meraki.com | Unblock/enable HTTPS traffic to this url |