
MI WAN Health Overview
WAN Health Overview
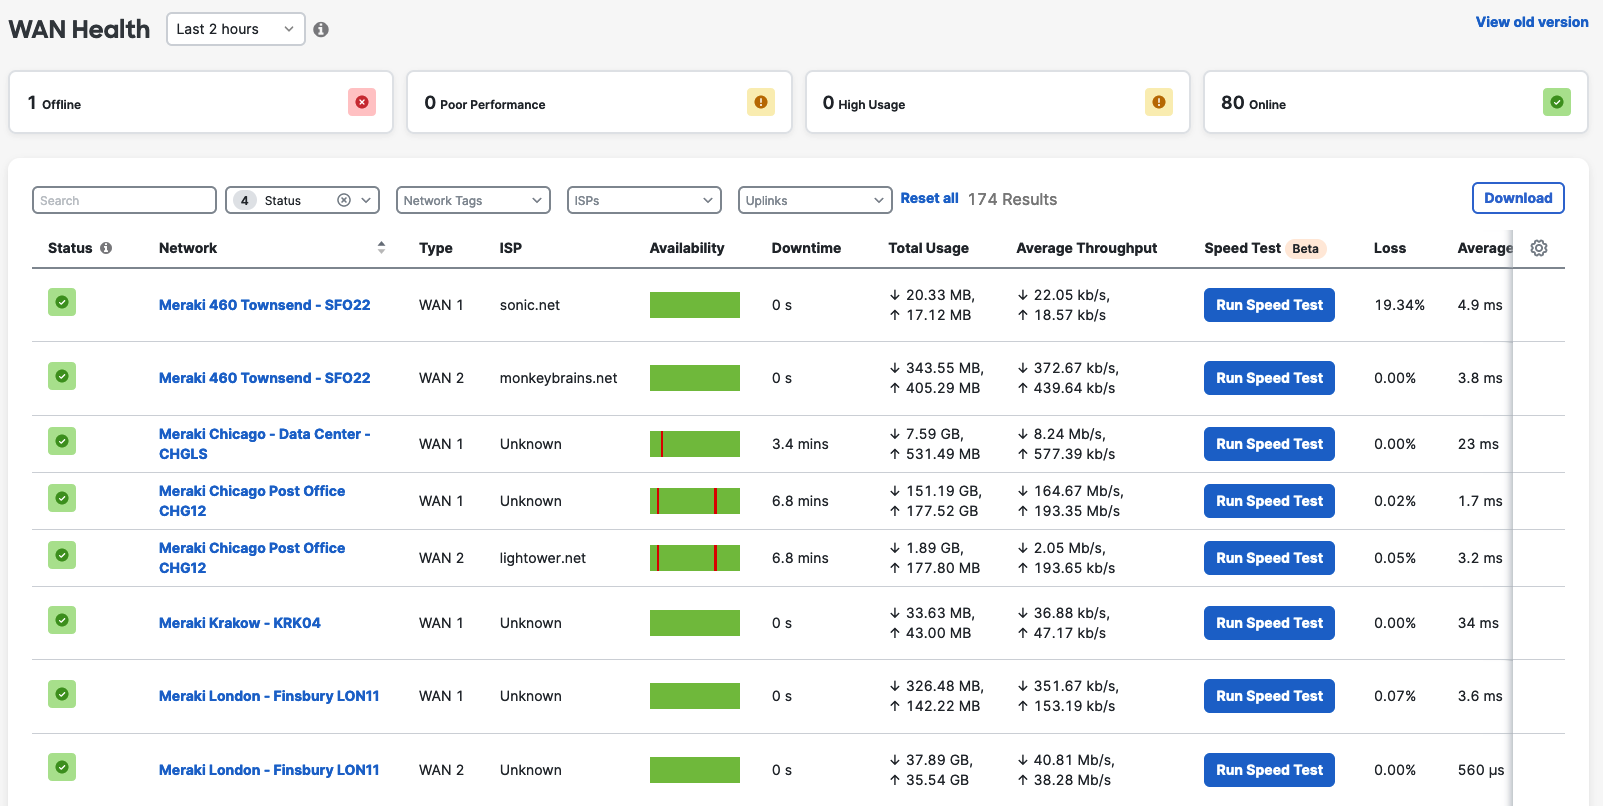
The WAN Health feature is designed to monitor WAN/internet uplinks across organization networks. In addition to monitoring, WAN Health helps proactively troubleshoot connectivity issues such as "Poor Performance" ISP or "High Usage." It also helps to keep track of primary, secondary, and LTE uplinks all together in one place. WAN Health gives more granularity in terms of uplink data compared to only knowing the status of the connection (up/down). The WAN connection information is presented in a simple, easy-to-read table format.
WAN Health Use Case
The WAN Health feature is useful when...
- Multiple WAN appliances have been deployed in the organization
- An SD-WAN deployment is being used, requiring the monitoring of several networks
- A network is using LTE as an uplink failover option
- Network administrators prefer to do more proactive monitoring and troubleshooting
- Network administrators who wish to get granular details and comparative views that affect uplink connectivity
- Run quick speed tests to understand bandwidth capabilities
- Run reports and share across teams for reporting
WAN Health will not only help with keeping track of how network uplinks are performing across the organization, it will also help determine connection patterns with historical uplink records. By keeping track of this information, WAN Health can help administrators hold ISPs accountable for network uptime SLAs and keep data on hand that proves the cause of any uplink issues.
Platform and Licensing Requirements
WAN Health is a part of Meraki Insight, and any Insight deployment will have access to WAN Health without additional configuration/licensing. The WAN Health feature requires a Meraki Insight license enabled in the organization and activated for the network’s WAN appliance. The WAN appliance must be running on firmware version MX 14.20 or higher. For more information on Meraki Insight licenses, please refer to this Meraki Insight article.
Meraki Insight is not currently supported on C8000-series devices.
WAN Health Dashboard
Timeline
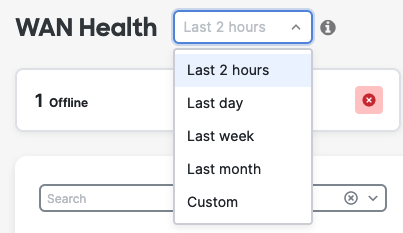
- When the last 2 hours option is selected, the WAN Health dashboard will present the previous 2 hours' worth of data.
- When the last day is selected, the WAN Health dashboard will present the previous 24 hours' worth of data.
- When the last week is selected, the WAN Health dashboard will present the previous seven days' worth of data.
- When Custom Range is selected, the WAN Health dashboard will present a series of dates and times, going back to 30 days.
Uplink Statuses Explained

Offline
The Offline number defines the number of uplinks that are down in the dashboard organization. This could be either multiple links in one network or across several networks, showing an “offline” status for Primary WAN, Secondary WAN, or LTE. An offline status could mean (but may not be limited to) cable issues, ISP modem issues, LTE modem issues, LTE provider issues, WAN appliance issues, or L2 issues between the WAN appliance and ISP modem.
Example: If the network is configured to send pings to 8.8.8.8 and sees 100% packet loss for 5 minutes, it indicates it is down. Now, if the same network is configured to send pings to another destination besides 8.8.8.8 and sees 100% loss but pings to 8.8.8.8 have no loss, we do indicate it as 'red' in the availability graph but do not show that under 'Down' on the banner. It will appear on the banner ONLY due to a 100% ping loss to the primary configured destination seen under Security & SD-WAN -> SD-WAN & traffic shaping -> Uplink statistics.
Poor Performance
The Poor Performance number defines the number of uplinks that are having issues on the ISP side due to loss or latency. The measurement of this is based on the bandwidth availability due to a loss or latency seen as a result of the pings sent to 8.8.8.8 every second to the default destination.
Example: If there is a network having no performance issue, then the link has 0% loss and 0 ms latency. If this value increases significantly, the network will be seen to have poor performance.
Loss and latency will be determined over the configured IP address under Security and SD-WAN > Configure > SD-WAN and Traffic Shaping > Uplink Statistics. If no IP is configured, these values will be measured against 8.8.8.8 by default. On the WAN Health page, all the configured IP address statistics can be reviewed by changing the destination under the "Ping Destination" column.
High Usage
High Usage defines the number of networks that are saturated due to high usage on the LAN side. If the bandwidth limit reaches 80% or greater of the set value under Security and SD-WAN > Configure > SD-WAN & Traffic Shaping > Uplink Configuration for a particular WAN uplink, it will be considered High Usage. For more information on Traffic Shaping, please refer to this article.
Example: If you have selected a window of 15 minutes and do see a high usage but expand the window to 1 hour, you notice networks do not show high usage, that indicates the high usage spiked a few times, but the average of it was less than 80% over an hour, and hence it is not indicated.
The High Usage number indicates the number of saturated uplinks due to the high utilization of the available bandwidth. To accurately identify high utilization, users must set the ISP-provided bandwidth limits under Security and SD-WAN > Configure > SD-WAN & Traffic Shaping > Uplink Configuration for each uplink. If the bandwidth usage exceeds 80% of the defined limit, it will mark that uplink as High Usage.
Search Option

You can search your organization’s uplinks by four different attributes:
-
Search: You can search for any text-based column value from the WAN Health metrics table. For example, network name.
-
Status: Allows you to filter based on the status of the WAN Uplink.
-
Network Tags: This will allow you to filter the uplinks by applied Network Tags.
-
ISP: This filter will allow you to search uplinks by ISP name.
-
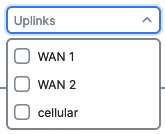
Uplinks: This will allow you to filter the list by primary, secondary, or LTE uplink types.
Uplink Status Colors
-
Green: Uplink is healthy without any issues.
-
Yellow: Either Poor Performance (WAN issue) or High Usage (LAN issue).
-
Red: Uplink is down; no connectivity or L1 issue.
-
Grey: Uplink is either not configured or has not been connected for an extended period of time.
Uplink Type
-
WAN 1: The physical connection for the WAN 1 uplink on the WAN Appliance.
-
WAN 2: The physical connection for the WAN 2 uplink on the WAN Appliance
-
cellular: Either a USB 3G/4G modem or built-in LTE (for MX67C/MX68CW only) will be detected as secondary, cellular.
Note: In the event that Load Balancing is enabled, the selected primary uplink under Traffic Shaping will be labeled as primary and remaining uplinks will show as secondary.
Cellular
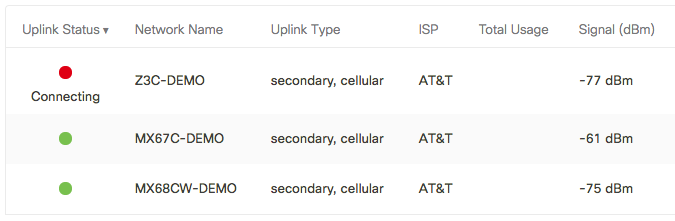
Some WAN Appliance models (such as the MX67C/MX68CW/Z3C) have integrated LTE. WAN Health will be able to detect the following from those devices:
-
Uplink Status: If the SIM card is inserted and the device is trying to connect to its service provider but is not successful, WAN Health will show the LTE status in the Uplink Status column with a Red status indicator in Connecting mode. Fully connected LTE uplinks will show the Green status indicator.
-
Uplink Type: If the uplink listed is an LTE connection, the uplink will be listed with the tag cellular under the Uplink Type column.
-
ISP: If the WAN connection is a cellular connection, the ISP field will have the LTE provider name.
-
Signal (dBm): WAN Health will report the LTE uplink's signal strength in dBm.
Download
The Download option will export the metrics listed on the WAN Health page as a CSV file for offline usage or sharing. The time span for these metrics is dictated by the time range selected on the timeline menu.

Speed Test
WAN Health can now run speed tests from the Meraki dashboard. This capability is different from the throughput tests we see on the Appliance Status page, as the latter is focused on testing the WAN Appliance bandwidth toward the Meraki Dashboard. The new Speed Test feature works similarly to running speed tests from speedtest.net from your laptop, but instead, this will be tested from the chosen WAN appliance Interface.
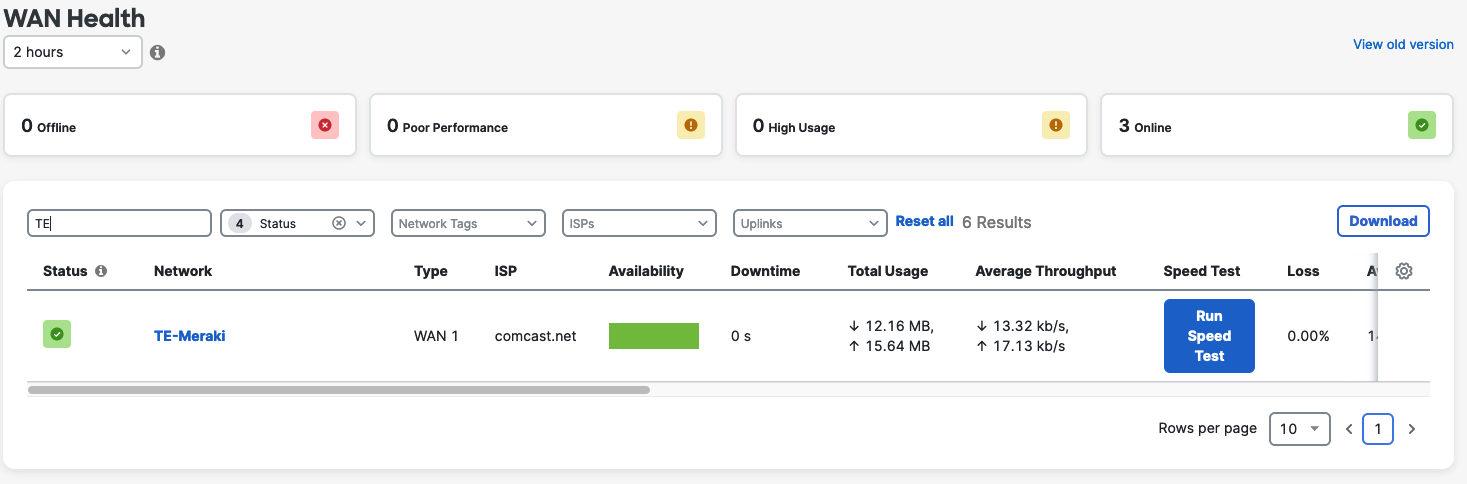
By clicking the Run speed test button, the WAN appliance will initiate the download of a 1GB file to measure the capability of the uplink at that given time. After the test is completed, the resulting measurement will be displayed on the screen in Mbps. Please be aware that the total size of the file to download is 1 GB, but this does not mean that every test will use this amount of data. The 1GB is used as a benchmark file size to calculate the speed of the uplink.
Running the speed test will induce a small blip in the performance and connectivity of the WAN Appliance clients as the uplink interface will be saturated.
The speed tests are currently available for download speed only and can only be run by Dashboard Administrators who have writing configuration privileges.
ISP Renaming
The ISP Rename option allows you to change the name of the ISP field for every uplink under the WAN Health feature either individually or in bulk. After the name has been changed, it can be restored to the default value identified by the Meraki Dashboard.
Changing a single uplink
To change a single uplink ISP name, please follow these steps:
- Under the WAN Health page, locate the uplink to modify
- Select the pencil/edit option and choose your desired ISP. A custom ISP can be written.
- The new ISP name should be set automatically after selection.
Changing multiple uplinks
To change multiple uplink names, please follow these steps:
- Under the WAN Health page, locate the uplinks to modify
- Use the checkmark option to select the desired uplinks
- Once selected, the new Rename ISP button should be shown on the top right of the page
- Select the new ISP name or add a custom one as needed
- When done, click on Rename
Restoring the uplink name
To restore the uplink names, please follow these steps:
- Under the WAN Health page, locate the uplinks to modify
- Use the checkmark option to select the desired uplinks
- Once selected, the new Restore default name button should be shown on the top right of the page
- Confirm the restoring the name by selecting Restore
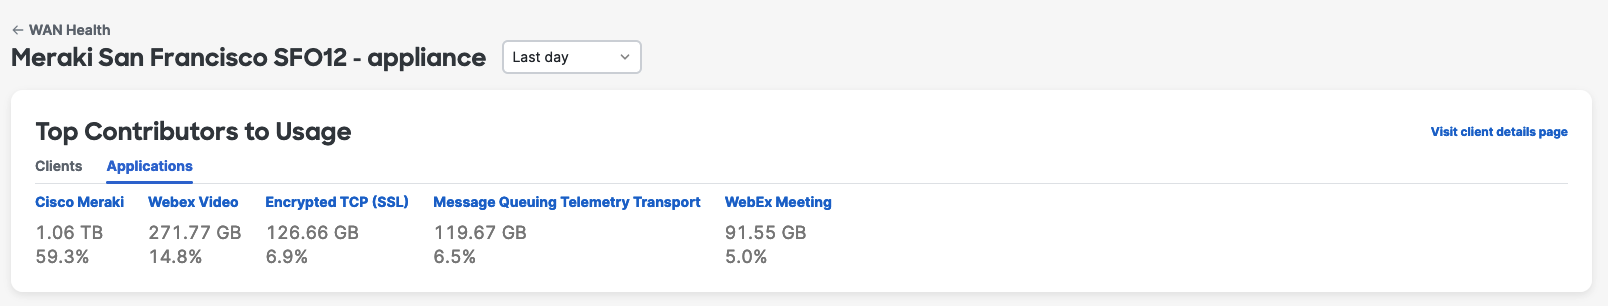
Detailed Uplink View
The Detailed Uplink View page provides simplified and unified access to the most critical metrics that the selected WAN appliance Uplinks are reporting. It can be accessed by clicking on any metrics seen on the Meraki Dashboard for each Uplink interface. The main sections on this page are Top Contributors to Usage, Metrics and Connections, and Download Speed history.
Top Contributors to Usage
This section provides a top-five list of contributors to overall network usage. Depending on the option selected, it can list these contributors by client or by Applications and use both data consumption in Gigabytes and as percentages of the total data used by all the contributors. In the screenshot below, we can see an example where the Applications option was selected
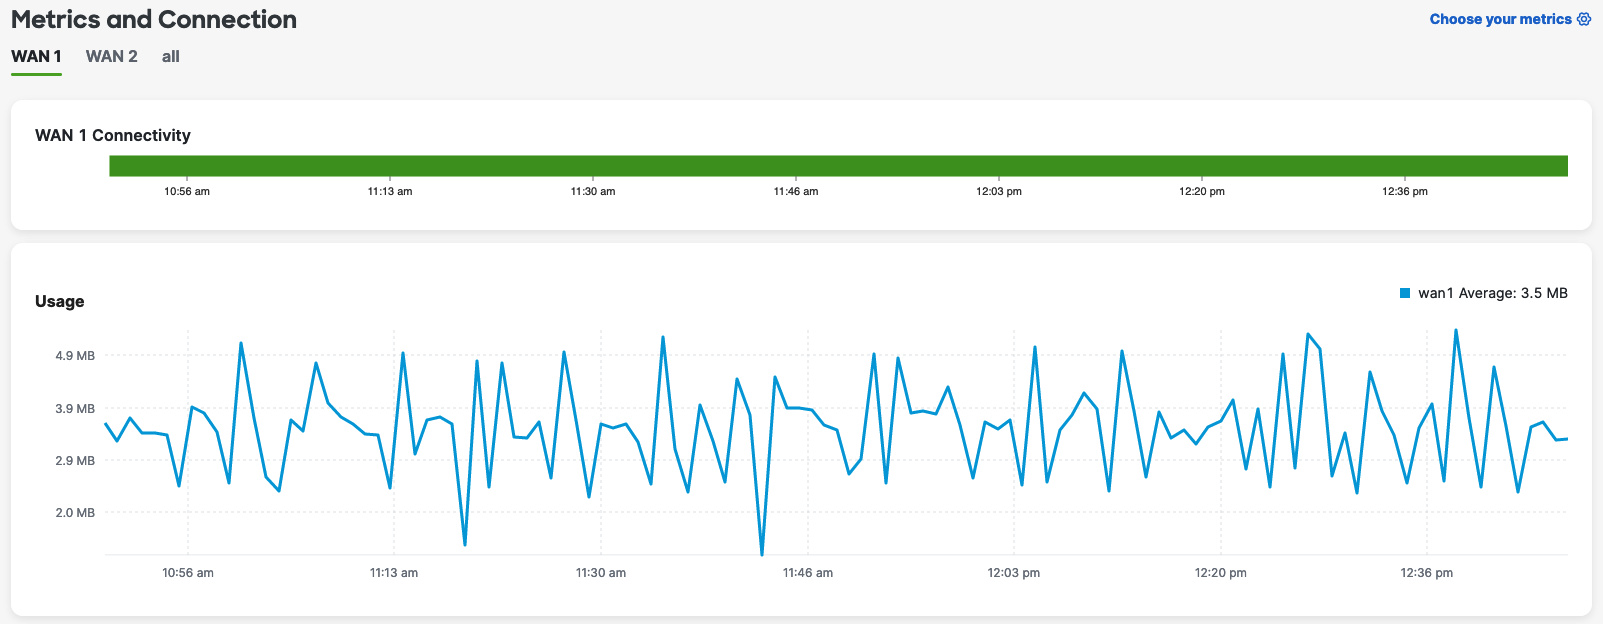
Metrics and Connection
The Metrics and Connections section details several usage and performance metrics of the desired WAN appliance Uplinks. The WAN Health feature by default shows information on:
- Connection Status
- Usage
- Loss
- Latency
- Jitter
A detailed view of the metrics above can be found by hovering the pointer over their corresponding line graphs.
Which metrics are shown can also be customized using the Choose your metrics option on the Meraki Dashboard. In addition, the information on this page can be scoped to WAN1, WAN2, or all WAN appliance interfaces. An example of the Usage metric view for the WAN2 interface can be seen below.
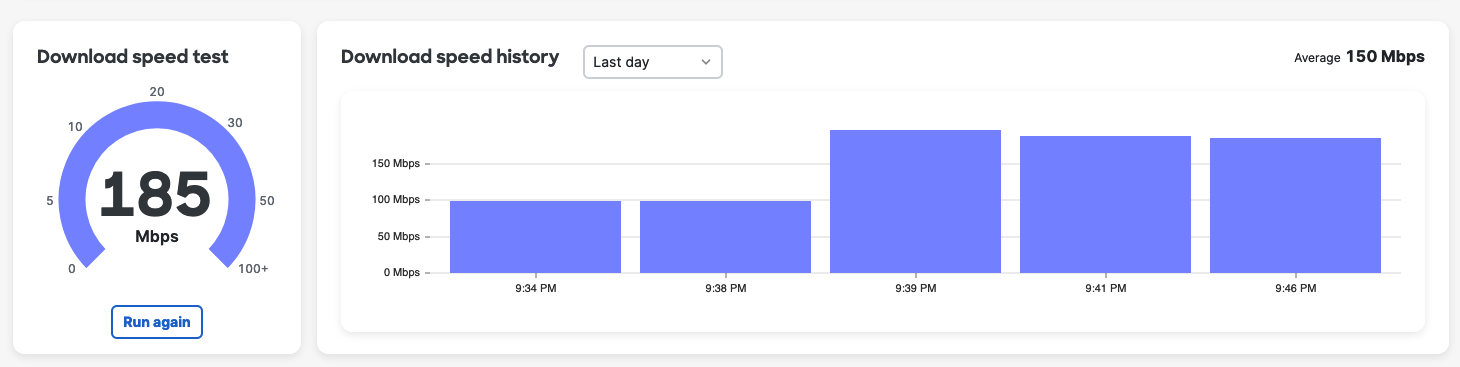
Download Speed history
This section provides a historical view of previous speed test results and also allows running a speed test on the uplink interface instantaneously.
FAQ
How is the ISP detected?
We do a reverse lookup to the next-hop IP address which will give us which ISP the uplink belongs to. Alternatively, the Security and SD-WAN > Monitor > Appliance Status > Uplink tab status page would show the ISP. If the lookup is failing, it will show “unknown.”
How is current bandwidth measured?
Current bandwidth is measured from the current uplink traffic displayed on the Security and SD-WAN > Monitor > Appliance Status > Uplink tab status page.
How are current loss and latency measured?
Current loss and latency statistics are measured based on the responses we receive on the connectivity testing IP address configured on the Security and SD-WAN > Configure > SD-WAN & Traffic Shaping > Uplink Statistics page. By default, the IP address is set to 8.8.8.8. To change it for a different destination, you can set addresses on the Traffic Shaping page. For more information on configuring uplink statistics, please check our Traffic Shaping Settings document.
How are affected apps detected?
If there are tracked web applications set to be monitored on the Insight > Monitor > Web App Health > Monitor tab, this data will be used to determine if the application is performing poorly on the WAN uplink.
If the performance score is less than 80% of its threshold, Insight will flag the application as “Affected.” From the WAN Health page, it will be easy to determine if the application performance is degraded due to a WAN uplink with Poor Performance or not. A Poor Performance indication could be caused by packet loss or high latency.
If the WAN shows no sign of issues, we can then check on the Web Application Performance page for that particular application. This will give more detail as to whether any issues are reported on the LAN side or the server-side. For more information on web application performance, check our main Meraki Insight document.