

How to Monitor Switch Ports in Cisco Meraki Dashboard
Click 日本語 for Japanese
Learn more with these free online training courses on the Networking Learning Hub:
Overview
This article explains how to use the Cisco Meraki dashboard to view visual switch port details and statistics.
The dashboard offers two paths to port information:
-
View ports on a single switch. Navigate to Switching > Switches, then choose a switch. The Summary tab shows a visual status of the switch ports. The Ports tab shows both the visual status and the detailed status.
-
View all switch ports in a network. Navigate to Switching > Switch ports. Select details from a row to view information about a single port.
The visual interface uses color and icons to show link speed, power, error states, and spanning-tree status. This helps you assess port health quickly.
Step-by-step instructions
View port status on a single switch
-
Navigate to Switching > Switches.
-
Choose a switch from the list.
-
Select the Summary tab to view a visual status of the switch ports.
-
Select the Ports tab to view both the visual status and the detailed status.

Enable Color Assist mode
Color Assist mode improves port-state visibility.
-
Select My Profile in the top right corner of the dashboard.
-
Enable Color Assist mode.

Read the visual port states
Each port icon shows its state. The default display icon and the Color Assist icon represent the conditions below:
Normal port states
-
Default Display Icon
Color Assist Icon Explanation

Link operating at full 1Gbps (or 10Gbps on SFP+ ports) 

Link operating at reduced speed/duplex (10 or 100Mbps) 

Link disabled administratively 
Link disconnected 

Link has active PoE draw (802.3af or 802.3at) 

Link has been detected as uplink to Internet path (Meraki Cloud uplink) 
Link is disconnected, but port has active PoE draw (indicates potential cabling issue)
Moderate error states
|
Default Display Icon
|
Color Assist Icon |
Explanation
|
|---|---|---|
 |
|
Link in an erroneous state with one of the following error types:
Speed Downshifted: problem causing for non-optimal link state (both the interface and connected device are advertising a faster link speed but a problem is causing the speed to downshift) PoE denied: port is waiting for power (may indicate that currently there is not enough available power for the port and connected device) Authentication failure: port not forwarding due to 802.1x authentication problem BPDU conflict: switch is seeing BPDUs from multiple sources on a full-duplex link High amount of L1 packet errors: port is sending or receiving a high amount (greater than 100 hits/hour or greater than 1% of traffic) of CRC align errors, Fragments, and/or Collisions |
High-severity error states
The following error types indicate a high-severity condition:
|
Default Display Icon
|
Color Assist Icon |
Explanation
|
|---|---|---|
 |
 |
Link in an erroneous state with one of the following error types:
PoE overload: connected device is consuming more power than the maximum limit configured or specified in the 802.3at/af standards Loop Inconsistent: loop guard is activated Very High amount of L1 packet errors: port is sending or receiving a very high amount (greater than 1000 hits/hour or greater than 10% of traffic) of CRC align errors, Fragments, and/or Collisions |
Blocking symbol
The blocking symbol can combine with any other port state above. It specifies that the port is in one of the following states:
|
Default Display Icon
|
Color Assist Icon |
Explanation
|
|---|---|---|
|
|
|
The blocking symbol can be combined with any other port states above. The blocking symbol specifies the port is in one of the following states: STP discarding: port is in an STP discarding state LACP disabled: LACP has disabled the port |


Expand the detailed port view
The detailed view shows the following columns for each port:
-
Port #: Specified port number on the switch.
-
Type: Active port configuration type (access/trunk).
-
VLAN: Actively configured VLAN(s) and voice VLAN.
-
Current Traffic (sent/received): Live ingress/egress traffic flow for the interface.
-
RSTP state: Active RSTP port state (Enabled, Forwarding, Blocking).
-
PoE: Active PoE draw in watts (advertised PoE in watts).
-
LLDP: Detected LLDP client information. Includes a direct link to the detected client device(s).
-
Link: Link negotiation state.
-
Status: Visual indication of the port's connection status over a 24-hour period. Hover over this field for more detail.

View details for a single port
Select a specific port to view more detail about that switch port.
Configuration
This section displays configuration details about the selected port. To modify the configuration, select Edit Configuration at the top of the section.
The configuration details include:
-
Description: A configuration description (for example, Access port on VLAN20).
-
Link Negotiation: The current link negotiation state (Auto, 10Mbps Half, 10Mbps Full, 100Mbps Half, 100Mbps Full, 1 Gbps Full, 10Gbps Full).
The RSTP field shows the port's RSTP state. Each port can be in one of these states:
-
Enabled – RSTP will be used when the port is connected.
-
Forwarding – RSTP is in use and the port forwards traffic.
-
Blocking – RSTP is in use and the port discards traffic, because it would introduce a routing loop.
-
Disabled – RSTP will not be used when the port is connected.
Status
This section displays information about the current port status:
-
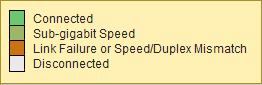
Connectivity: Shows detailed information about the port connectivity state. The color of the connectivity bar varies depending on the link state. Use the legend in Figure 2.
-
Usage: The total usage on this switch port over the previous thirty seconds.
-
Traffic: The total traffic on this switch port, including broadcast traffic. Averaged over the previous thirty seconds.
-
LLDP: Shows detected LLDP client information for the selected port. This field contains a direct link to the detected client device(s). It also offers an option to display the raw LLDP information.
Other networking devices can advertise their identities using LLDP. The format and content varies greatly.
Current clients
This displays details about the currently connected client(s) behind the selected switch port.
Packets
This displays detailed packet information for the selected switch port. It includes the total, sent, received, and rate values for Total, Broadcast, and Multicast traffic. The table also displays counters for CRC align errors, fragments, collisions, and topology changes.

Verification
Use the visual and detailed views to confirm that each port reports the expected state:
-
A port operating normally shows a full-speed link icon (1Gbps, or 10Gbps on SFP+ ports).
-
A port supplying power shows active PoE draw (802.3af or 802.3at).
-
An uplink port shows the Meraki Cloud uplink indicator.
-
The Status column reflects the port's connection state over a 24-hour period. Hover over the field for more detail.
-
The Packets section shows live counters. These confirm traffic flow and error counts for the selected port.
Troubleshooting
Use the error states and packet counters to identify problem ports.
Identify problem ports from visual states
-
A disconnected port with active PoE draw indicates a potential cabling issue.
-
A Speed Downshifted, PoE denied, Authentication failure, BPDU conflict, or high L1 packet error state indicates a moderate problem. Investigate it.
-
A PoE overload, Loop Inconsistent, or very high L1 packet error state indicates a high-severity problem.
-
A blocking symbol indicates the port is in an STP discarding state, or LACP has disabled it.