
Switch Traffic Analytics
Learn more with this free online training course on the Meraki Learning Hub:
Enabling Traffic Analytics
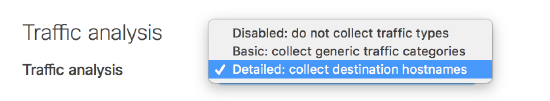
To enable, navigate to Network-wide > General and set Traffic analysis to Detailed: collect destination hostnames. This will add Traffic Analytics to your Monitor tab the next time you refresh.
Note: The data displayed for traffic analytics is only collected after this feature is enabled. Data prior to that point will not be available with the exception of pre-existing traffic flows, including those established for Meraki Cloud Communication; there may be a noticeable spike in reported traffic volume initially as data for existing flows is collected, the initial traffic values may not reflect actual traffic values for this reason.
Once enabled, it may take up to 24 hours for information to propagate fully.
Network-wide Traffic Analytics
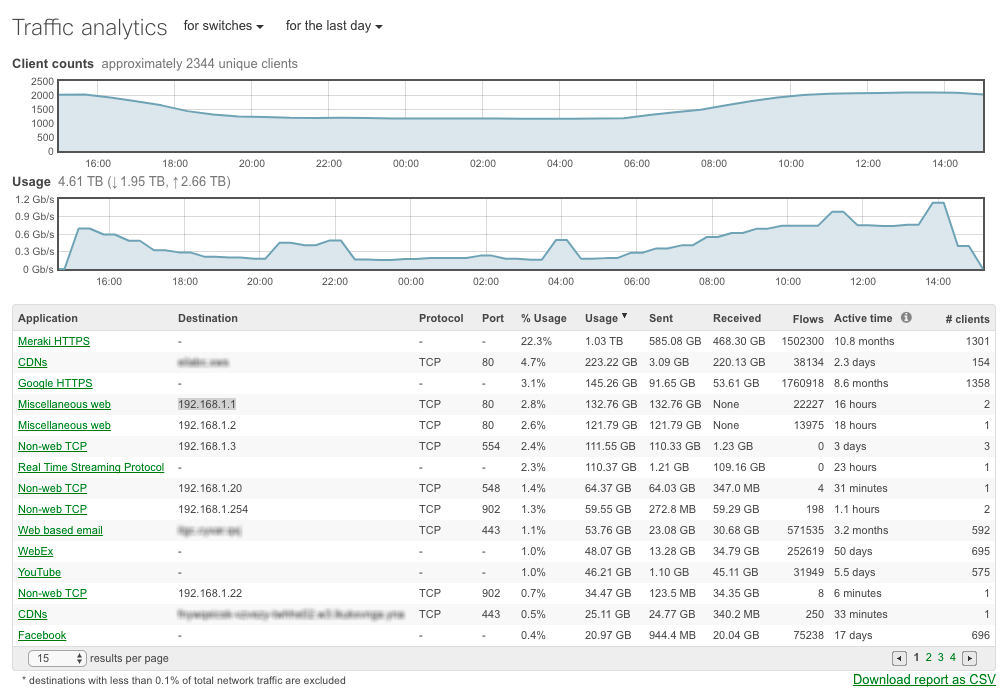
This page aggregates all of the detected applications for a given time frame. This time frame can be selected at the top of the page and options for weekly, daily and monthly are available. Custom pie charts can also be configured to further customize the data based on HTTP hostname, IP, Port range, etc. This is configured under Alerts & Administration.
Configuring for Non-combined Networks
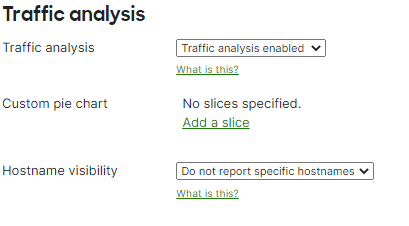
For non-combined network, navigate to Network-Wide > General and set the Traffic analysis to Traffic analysis enabled and the Hostname visibility to Report specific hostname.
Hostname Reporting
Meraki's layer 7 application visibility is now enhanced to dynamically detect applications running on your network and provide hostname visibility. This is an opt-in feature and can be enabled under Network-wide > General.