
Viewing MT40 Metrics
Overview
This article describes the features of the MT40 - Smart Power Controller page. To access this page, navigate to Sensors > Monitor > Sensors in the Meraki dashboard.
Device Information
The device information header section displays the sensor device name, model, MAC address and online or offline status. The navigation tabs to access Device details and Power controls pages are also contained in this section.
Sensor Data
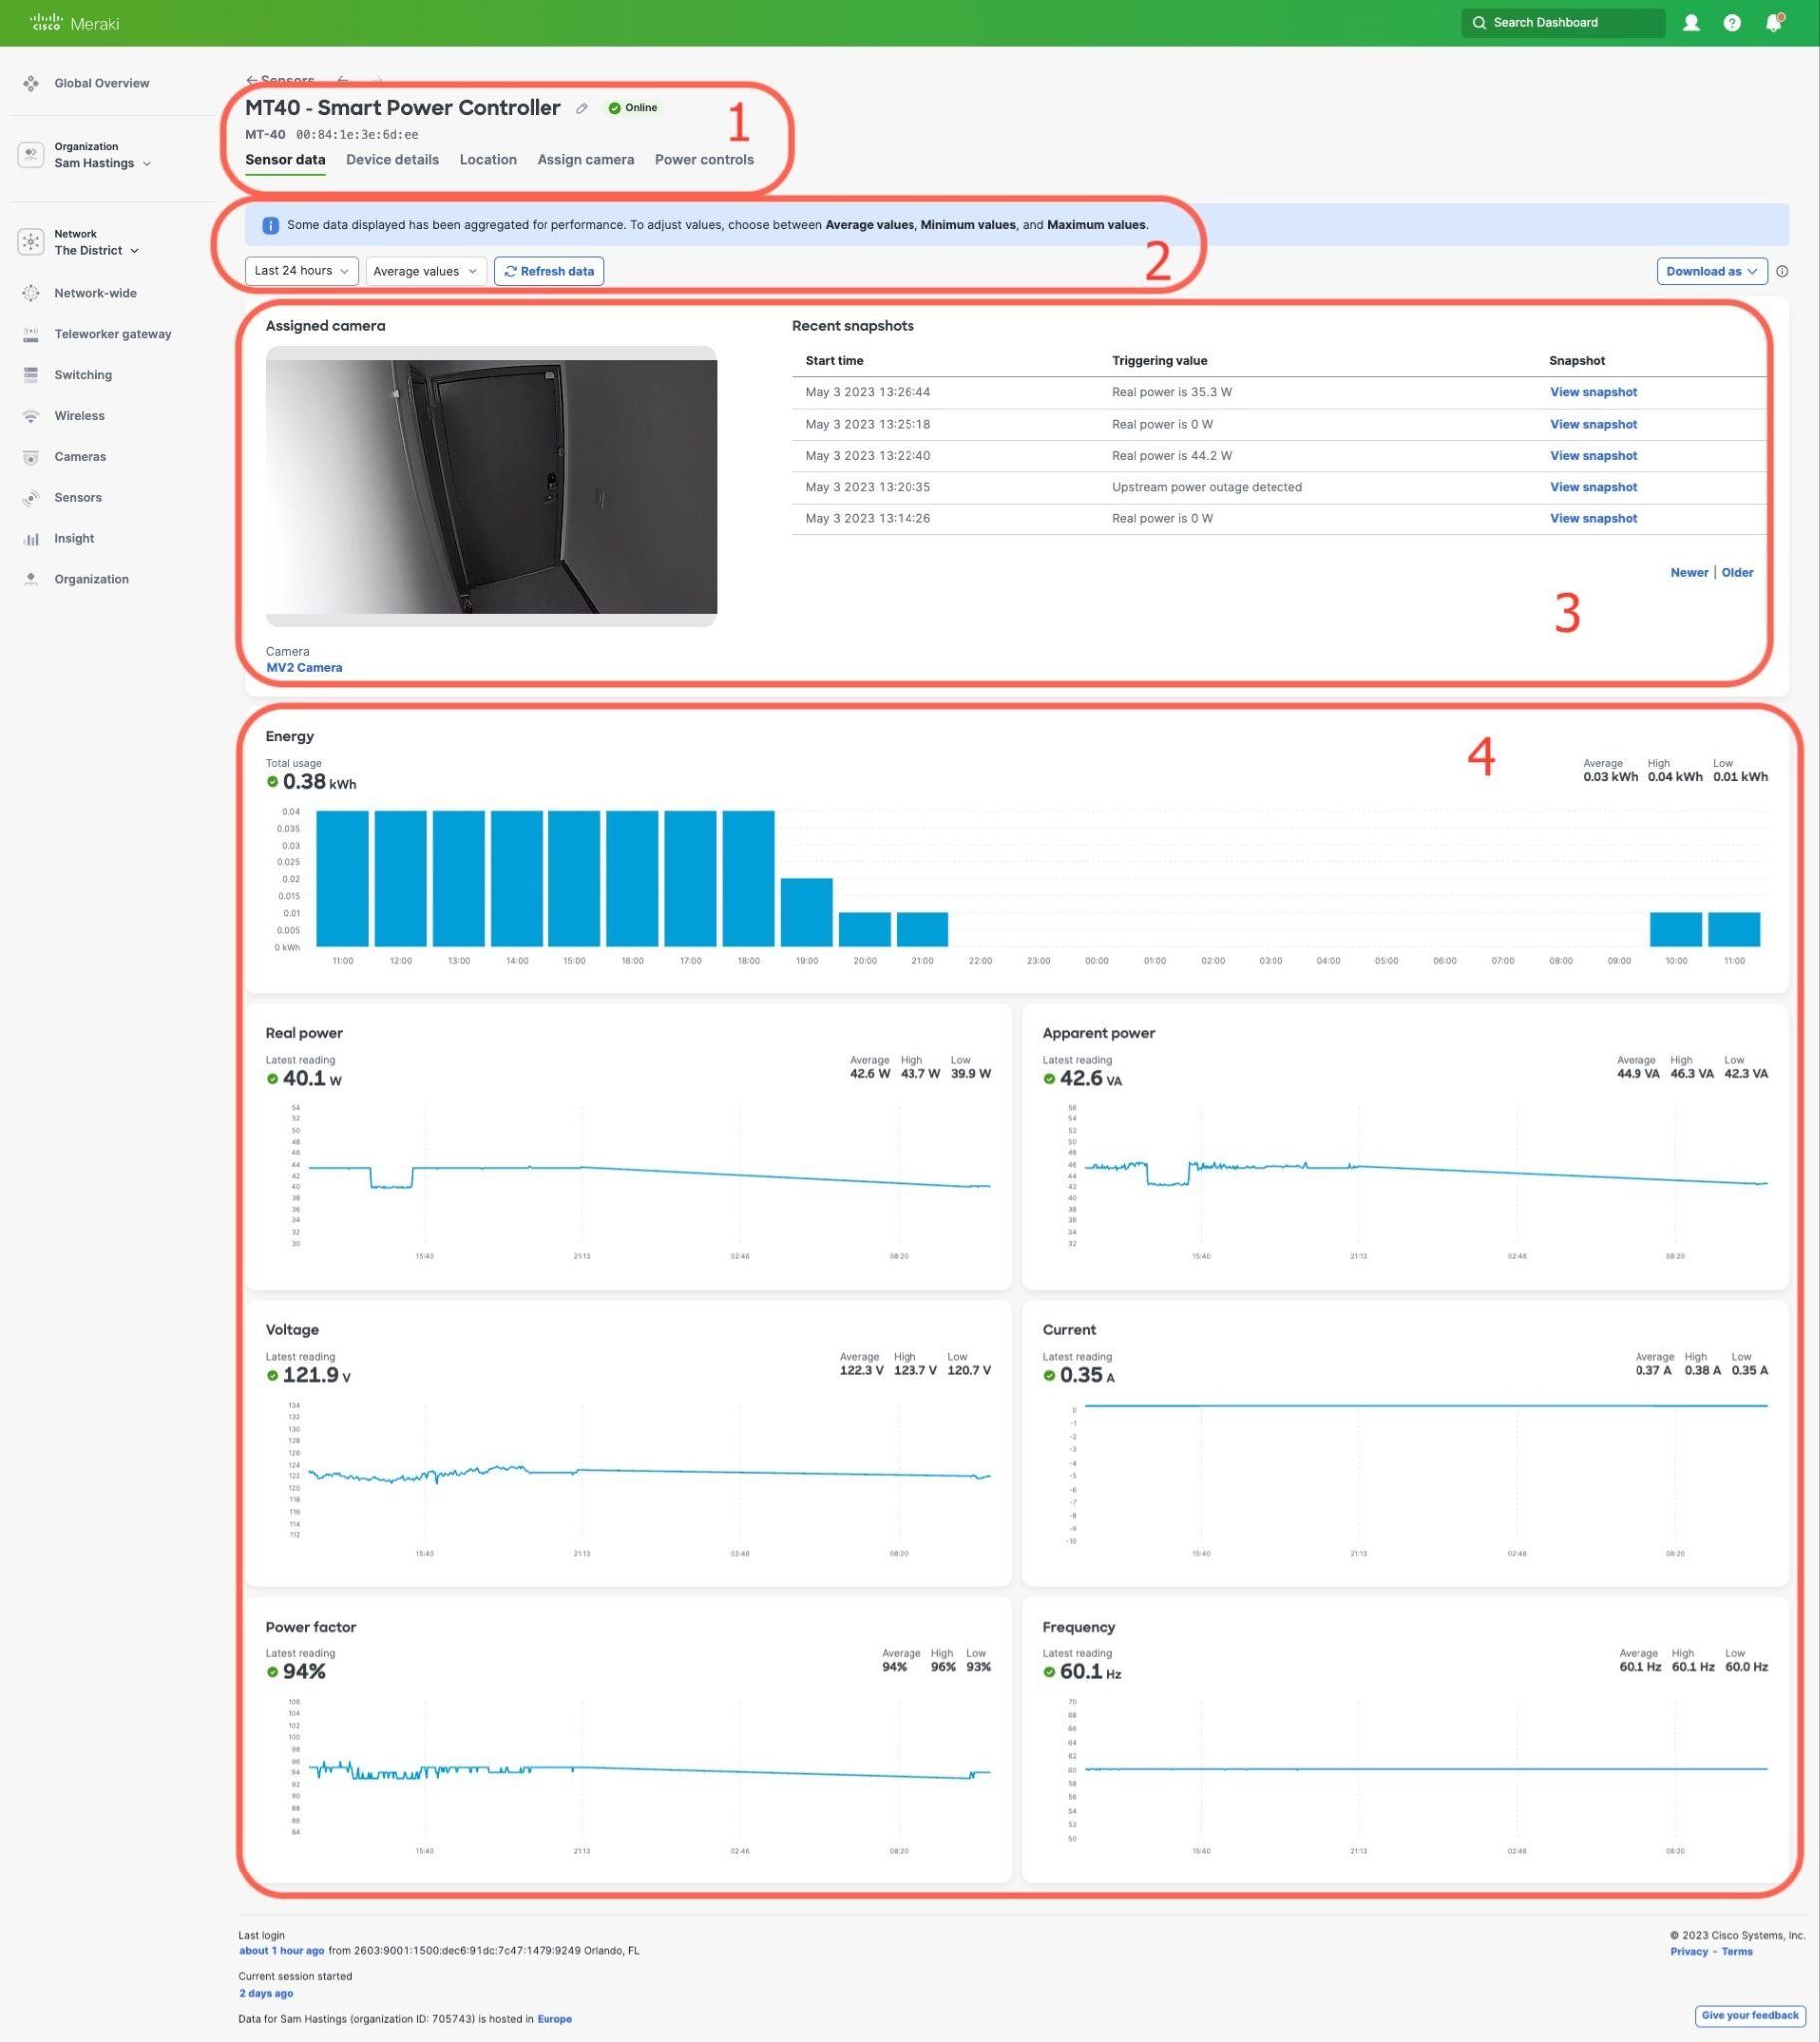
Data Time and Value Picker
Use the time range dropdown menu to filter the Device Readings Charts. These charts use aggregated data for optimal page performance, which might result in some data points displaying as an average of available data. To view the complete data, select between Average, Maximum, and Minimum values for that chart.
| Time frame | Data Point Resolution |
|---|---|
| <2 hours | 15 sec |
| >2 hours <24 hours | 2 minutes |
| 24 hours - 1 week | 15 minutes |
| 1 week - 30 days | 1 hour |
Assigned Camera
The Assigned camera section is visible if a camera is associated with the sensor. It will display a live stream of the camera, a time-stamped list of triggered alerts, and a link to a snapshot of the camera feed at the time an alert was triggered.
Device Readings Charts
The Device Reading Charts display the following data from the MT40:
- Energy: Total energy consumption (kWh)
- Sustainability Insights
- Real Power: Real power consumption of downstream device (W)
- Apparent Power: Total power consumption of downstream device (VA)
- Voltage: Difference in electric potential between two points (V)
- Current: Amount of electricity flowing through (A)
- Power Factor: Percentage ratio of real power over apparent power (%)
- Frequency: Rate at which current changes direction per second (Hz)
Sustainability Insights
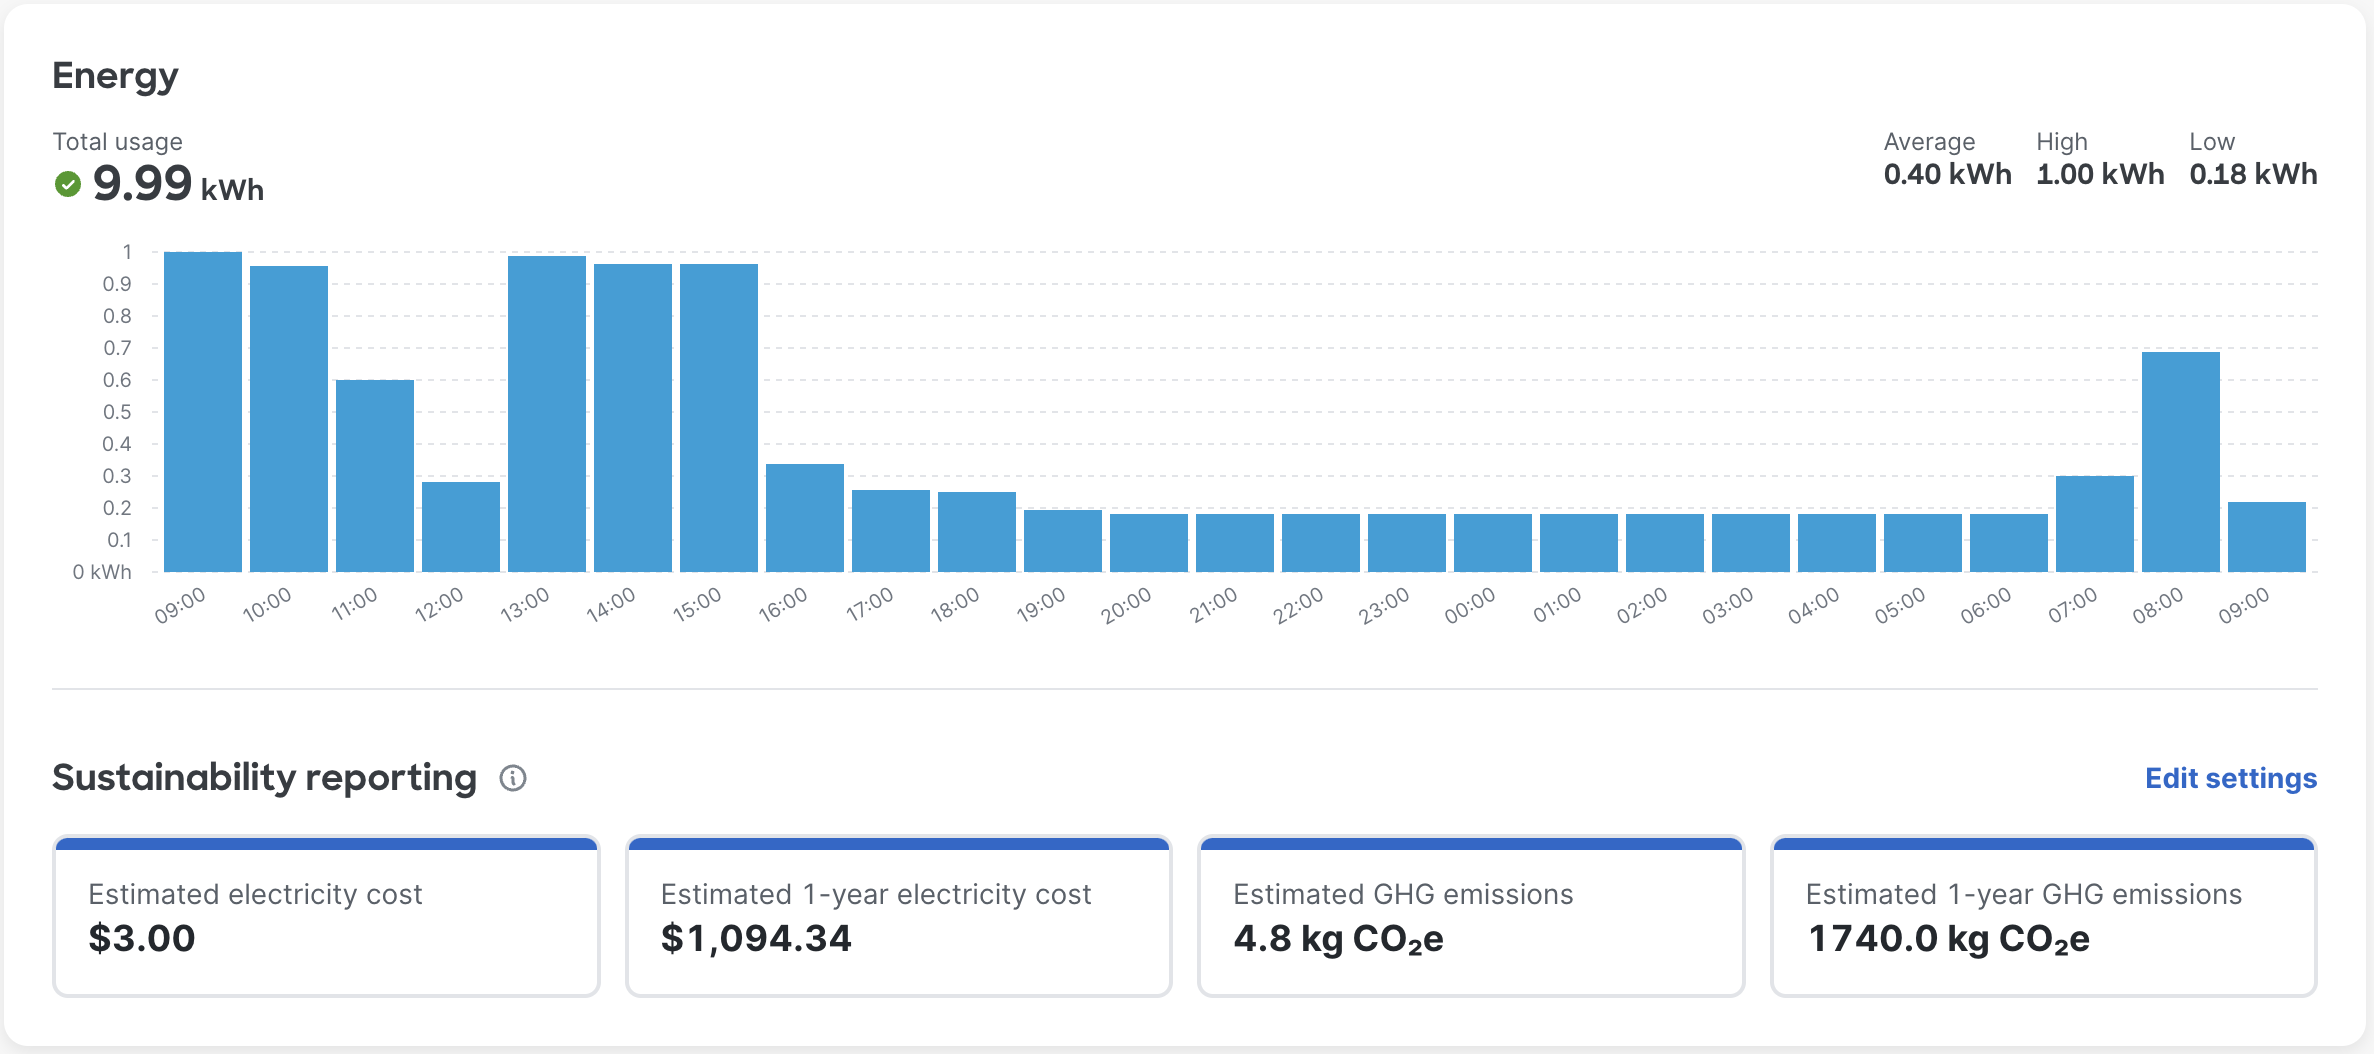
This section reports the cost of energy consumed by the downstream device along with a projected 1-year cost as well as the estimated green house gas (GHG) emissions.
Estimated cost:
Estimated cost is calculated by multiplying your total usage (kWh) over the time period you have indicated on this page by your electricity cost per kWh. Estimated 1-year electricity cost is calculated by extrapolating your estimated electricity cost over 1-year period.
Green House Gas emissions:
GHG emissions are emissions associated with climate change which include carbon dioxide, nitrous oxide, and methane. GHG emissions is calculated by multiplying your total usage (kWh) over the time period you have indicated on this page by your GHG emissions factor.
Estimated 1-year GHG emissions is calculated by extrapolating your estimated GHG emissions over 1-year period.
Settings:
The settings page will allow the user to change the base cost(per kWh) and currency used to calculate the estimated cost as well as the 1-year projected cost. Along with that users can also set the base GHG emissions rate (kg CO2 per kWh) to calculate the estimated emission rate.
The base rates are a network-wide setting and will be applied to all MT40s in the same network.
Disclaimer
- Data and other information generated in this dashboard are estimates and indicative only, and they are based on assumptions and approximations. They are not predictions or guarantees of actual outcomes.
- Cisco is not responsible for any errors or omissions in connection with the data and other information generated. They are generated and provided "as is", with no guarantee of completeness, accuracy, or timeliness. They are made available without warranty of any kind, express or implied. In no event will Cisco, its affiliates, partners, agents, or employees be liable for any decision made or action taken in reliance on the data and other information generated, or for any consequential, special, or similar damages, even if advised of the possibility of such damages.
Device Details
The Device Details sidebar displays the sensor location, serial number, alert profiles, tags, notes, and firmware version. Click the pencil icon in Sensor alert profiles or Tags to add this sensor to existing Alert Profiles or Tag groups.

Signal Strength
The Signal Strength table displays gateways in range of the sensor and their signal strength. The color and status of the RSSI is based on 3 values:
🟢 Green = Stronger than -65 dBm
🟡 Yellow = Between -65 and -85 dBm
🔴 Red = Weaker than -85 dBm
The Last reported column indicates the last time the gateway received an advertisement from this sensor. The Last connected column displays the most recent connection to a specific gateway.
All connections will be rejected when the RSSI is less than, or equal to, -85dBm.
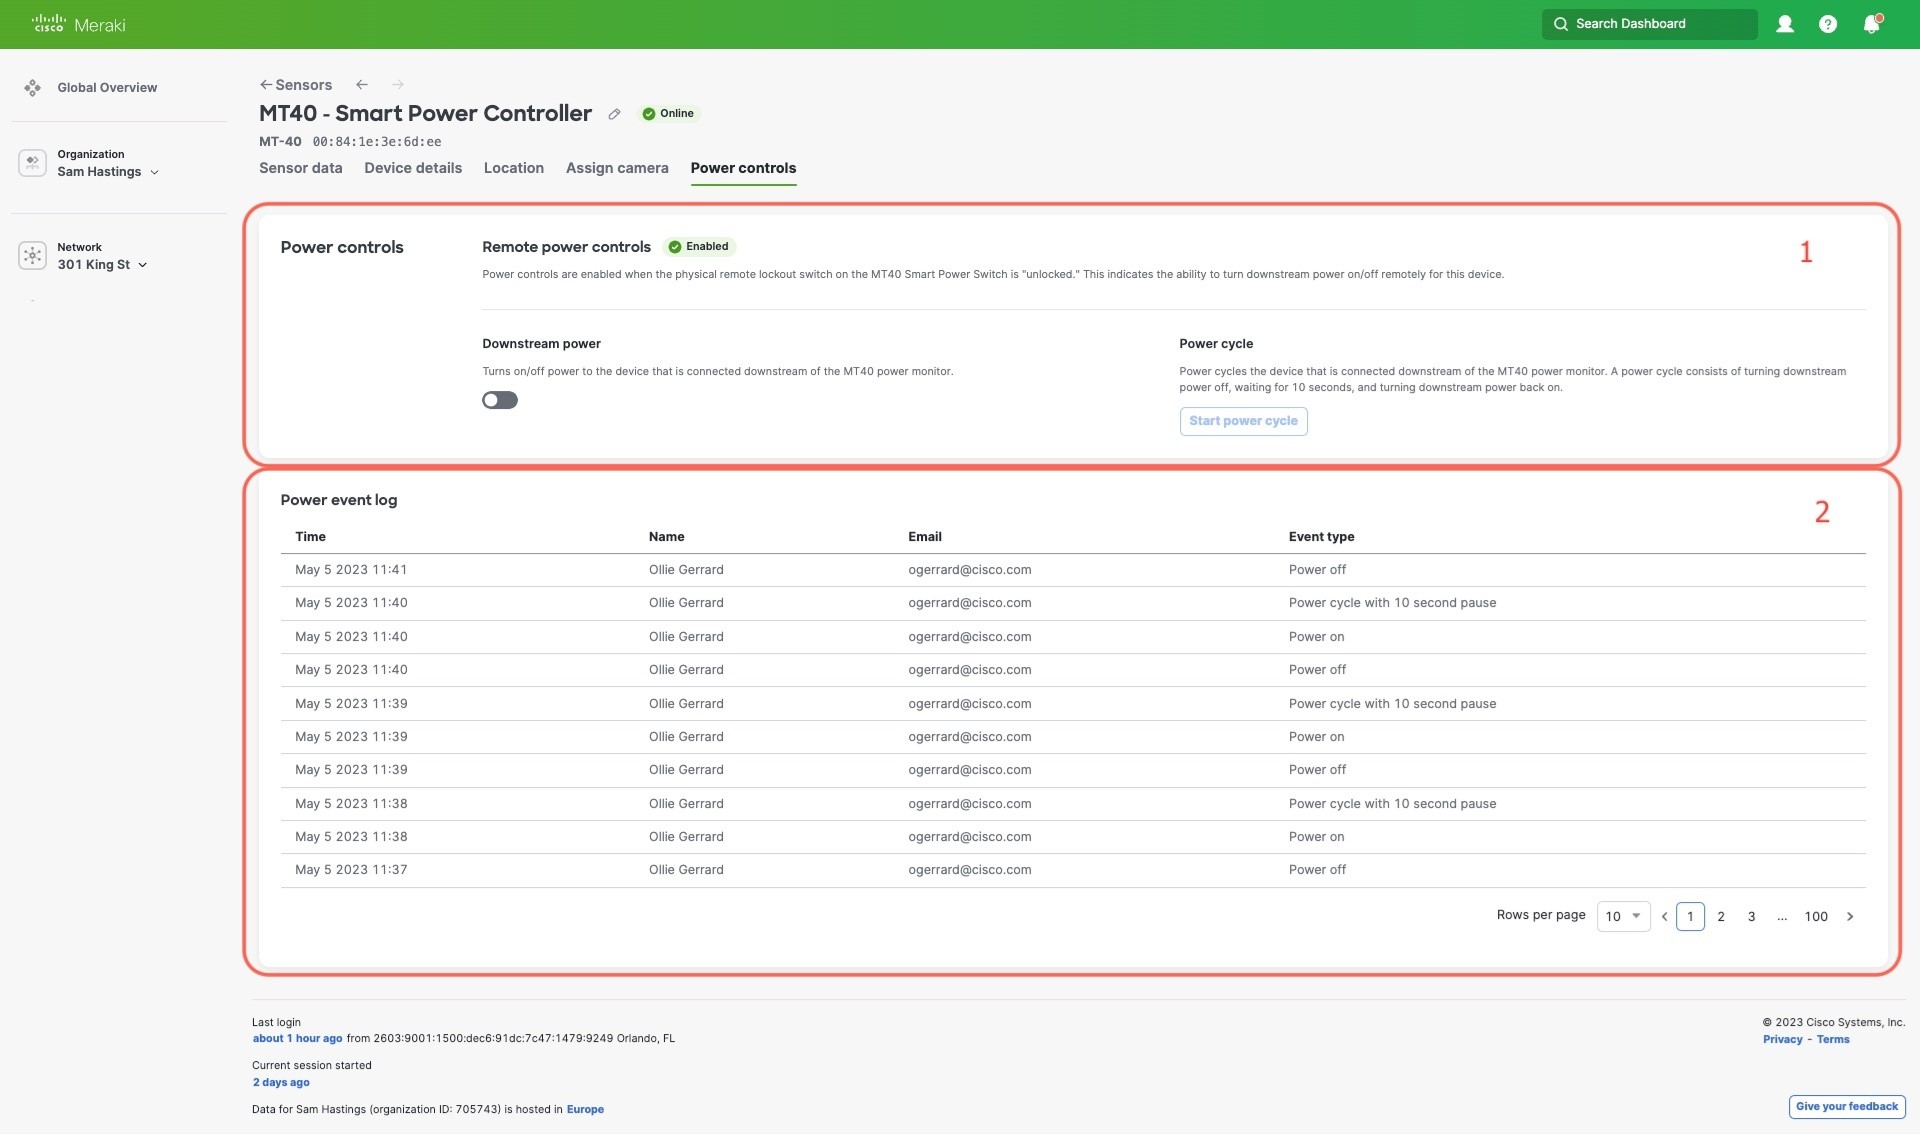
Power Controls
The Power controls panel displays the remote lock-out switch status. It also includes options to enable or disable downstream power, or to power cycle the sensor.
The Power controls feature is only available when the gateway firmware meets the minimum requirements. See the MT40 Installation Guide for more information.
Remote Power Controls
The icon in Remote power controls indicates the current status of the physical remote lock-out switch:
- Enabled: Unlocked state (power commands can be executed remotely)
- Disabled: Locked state (remote power commands are not allowed)
When the lock-out switch is in a disabled state, the downstream power is always on.
Downstream Power
The Downstream power toggle displays the current state of the downstream power. Click the toggle to enable or disable downstream power.
The downstream power state persists during upstream power outages. For example, if a downstream power state is off before a power outage, the MT40 will persist this state when the upstream power is restored.
Power Cycle
The Start power cycle button sends a command to the MT40 to power off the device, wait 10 seconds, and then power back on. Downstream power must be enabled to issue remote power commands. While the power cycle is running, the Downstream power toggle will reflect the power state.
MT sensors cannot receive further commands if the downstream device is powering any MT gateways. Verify that the downstream device is not powering any MT gateways. If the gateway is no longer reachable, toggle the physical remote lock-out switch on the sensor to recover power.
Power Event Log
The Power event log is a record of all power commands sent to the sensor. The log displays the name and email address of the user who sent the command, the time the command was sent, and the event type of the command. The time displayed is shown in the network timezone.