
VPN Status Page
Learn more with these free online training courses on the Meraki Learning Hub:
VPN Status Overview
The VPN Status page provides detailed, useful information about all VPN tunnels on your Meraki organization. This page provides real-time status updates between your Meraki Auto VPN peers and IPsec VPN peers. You can access the VPN Status page by navigating to the Organization > Monitor > VPN Status tab, or by navigating to the Security & SD-WAN > Monitor > VPN Status tab.
The Organization > Monitor > VPN Status tab will show you the status of all WAN appliances in your organization with site-to-site VPN enabled.
The Security & SD-WAN > Monitor > VPN Status tab will show the VPN status of the current network in relationship to all other WAN appliances in your organization with site-to-site VPN enabled.
If site-to-site VPN is not enabled on the selected network, the VPN Status link will not be visible under the Security & SD-WAN tab, but is still accessible through the Organization tab.
From the Organization Tab

From the Security & SD-WAN Tab

Time Period Selection
If you're viewing this page from the Organization > Monitor > VPN Status tab, the graphs will display the aggregate data of all networks participating in the VPN for the selected time period. If you'd like to see details about a specific site, simply hover your cursor over the peer in the Networks list and another graph will be overlaid on top. If you're viewing this page from the Security & SD-WAN > Monitor > VPN Status tab, the page will display the data for that network only.
To change the selected time period, click on the dropdown next to the VPN Status at the top left of the page and select the desired time period.

Connectivity, Latency, and Usage Details
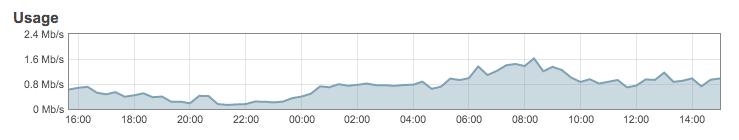
Usage Graph
The Usage graph shows the throughput of the VPN over a given time period. The graph will dynamically scale depending on the total amount of throughput within the time period. Use this graph to monitor the throughput of your site-to-site VPN connections.
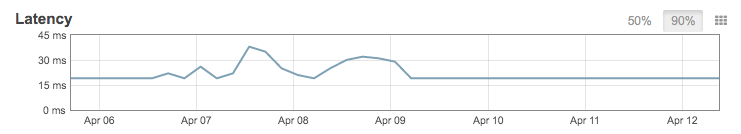
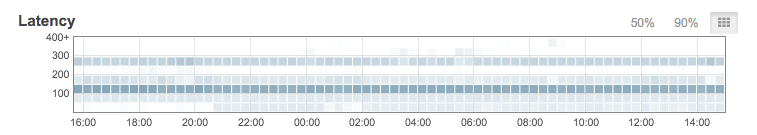
Latency Graph
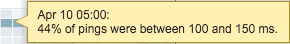
The Latency graph shows the latency in a 50th Percentile, 90th Percentile, or a Histogram View. In the Histogram view, hovering over a box will give you details for that time period. The 50% option shows the median round-trip time for pings used to monitor the site-to-site VPN connection. The 90% option will show you the results of the top 10% of pings.
Typically, use the 50% option to view the average, the 90% option to view spikes in latency over the time period, and the histogram view to get detailed data for a specific time within the time period. When there are network problems (like poor voice quality) that can be related to latency, the 90% or histogram views will help troubleshoot whether those events correlate to VPN latency issues.
Note: The Latency and Usage graph is specific to Meraki Auto VPN. We do not collect usage and latency stats for IPsec VPN Peers.
Ring View Graph
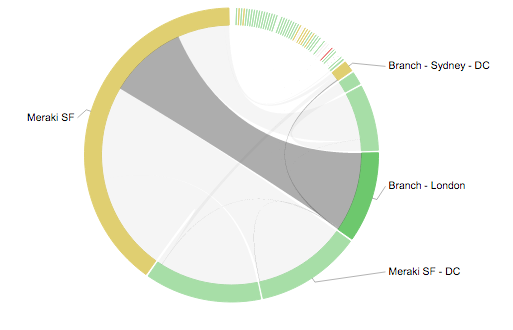
The ring view visually represents the total percentage of traffic distribution between Meraki Auto VPN peers. Each band or "slice" of color on the outer ring represents a WAN Appliance or Teleworker gateway device deployed at a given site. The band width is based on the amount of VPN traffic to or from that site. Wide segments indicate WAN appliance networks that send and receive larger amounts of VPN traffic than thinner segments.
In the example below, we can quickly see that the WAN appliance highlighted below has a high amount of VPN peer density (it’s connected to multiple WAN appliances at other sites), and is one of the major hubs for VPN traffic.
Networks List
The Networks list provides the detailed information for Meraki Auto VPN peers and IPsec VPN peers.

Information columns can be added or removed using the " + " icon on the top right of the Networks list. To view how a specific peer relates to the rest of the configured peers, hover the mouse cursor over the desired peer in the list. This will highlight the graphs at the top of the page.
- Under the site-to-site peers tab, the following information is available:
-
Status - Details on the Meraki VPN status for the selected peer.
-
Red - Peer is unreachable.
-
Yellow - Some peers are unreachable.
-
Green - All peers are reachable.
-
-
Description - The description of the Meraki or IPsec VPN peer.
-
Usage - The amount of traffic to and from that Meraki VPN peer.
-
Latency - Round-trip time latency between the WAN appliance and the remote peers.
-
There are 3 column choices for this - Average, 50%, and 90%.
-
-
- Under the exported subnets tab, the following information is available:
-
Name - Name of the subnets capable of being exported.
-
Yes/No - Indicator if the subnet is currently being exported into the VPN.
-
Subnet - CIDR notation of the subnet.
-
Router IP - This is either the IP address used by the WAN appliance's VLAN interface for that subnet, or the "next hop" IP address configured for a static route. Both of these options are configured on the Security & SD-WAN > Configure > Addressing & VLANs page. More information on the Addressing & VLANs page can be found here.
-
- On the IPsec VPN peers tab, the following information is available:
-
Status - whether the peer is currently reachable or not.
-
Name - Name of the IPsec VPN peer configured on the Security & SD-WAN > Configure > Site-to-Site VPN page.
-
Public IP - Pubic IP configured for the IPsec VPN peer.
-
Subnets - All subnets configured under the "Remote Subnets" field on the Security & SD-WAN > Configure > Site-to-Site VPN page.
-
To view additional information and statistics about the connection to a VPN peer, click the relevant row in the Networks List. For more information on this or the SD-WAN Monitoring feature, refer to the SD-WAN Monitoring page.
VPN Registry Information
The VPN Registry Connectivity Bar shows the connectivity history of the selected Meraki device to the VPN registries over the time period currently selected.
The bar can display 4 colors to indicate the registry connectivity status over the given time period.

The following colors indicate the status:
- White - WAN appliance has not been online in the last week
- Red - WAN appliance is unable to communicate with both VPN Registries or the WAN appliance is unreachable.
- Amber - Connectivity to one of the VPN Registries is down
- Green - WAN appliance is connected to both VPN Registries
Additionally, Meraki Auto VPN Registry information can be viewed next to the Networks list. Clicking on a peer will refresh the page and set the focus to that peer. This tool allows you to easily troubleshoot any problems the Meraki device could be having communicating or establishing an Auto VPN connection to another Meraki peer.
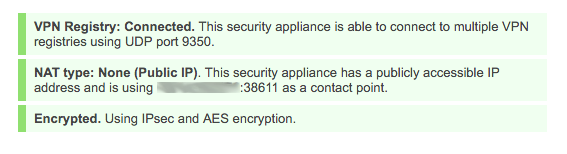
The VPN Registry Information will provide the following:
- VPN Registry: This will indicate if the Meraki device can successfully communicate with the Meraki Auto VPN cloud registry.
- NAT Type: This will indicate if there are any problems traversing upstream NAT device(s).
- Encrypted: This will indicate the VPN type and encryption.
- Routing Errors: If there are any overlapping or conflicting subnets configured, another row will appear indicating the problem subnet(s).
The VPN status page reports the state of the primary WAN interface connectivity to the VPN registry. In the event that the primary WAN interface is down, and there is another active WAN connection, the VPN status page will continue to report no connectivity to the VPN registry.
Troubleshooting Resources
-
If you are encountering problems with a Meraki WAN appliance or Teleworker gateway device connecting to another Meraki peer, or the Meraki Auto VPN registry, please refer to Troubleshooting VPN Registration.
-
If you are encountering Automatic NAT traversal problems, please refer to Troubleshooting Automatic NAT Traversal.