
Location Deployment Guidelines
Overview
Client location enables tracking of live client device location within a network when leveraging the dashboard's scanning API. Cisco Meraki APs can track the location of client devices independently using the signal strength of each client device. This helps to locate client devices that are either stationary or moving inside the intended area. Using this approach, network administrators can easily determine the proximity of any wireless client device within the network perimeter. This helps in asset tracking and location-based services such as, counting visitors, analyzing foot traffic, and customer engagement.
Under Organization > Configure > Settings > Privacy > Privacy by default, turns off the Client details map Organization-wide, regardless of any other setting (even after enabling location analytics afterwards).
The client’s page can be used to show the approximate location of a client, but should not be used for real-time tracking. The data on the client page is not updated in real-time and there might be some delay as the client roams from one AP to another.
-
Navigate to Network-wide > Monitor > Clients
-
Select the client you want to locate from the list
-
The client will be represented as a blue dot on the map as shown below
-
This dashboard view is updated every few seconds, but should not be used to track the exact location of a client device in real-time.
-
The light blue circle around the blue dot is the calculated uncertainty for where the client could reside. The client's true location will generally fall within the circumference.
-
Note: The client location is shown on a floor plan only if a floor plan is uploaded to the dashboard. If a floorplan is not uploaded in the dashboard, the client will be shown on Google maps based on the information defined within the dashboard.
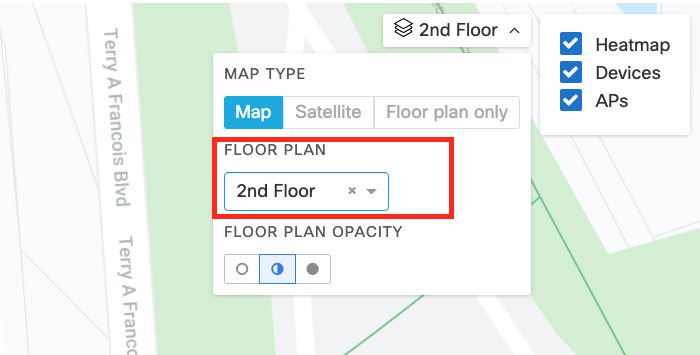
To view a holistic, aggregated client view for a network, navigate to Wireless > Location Heatmap > Select floor plan in the top right corner
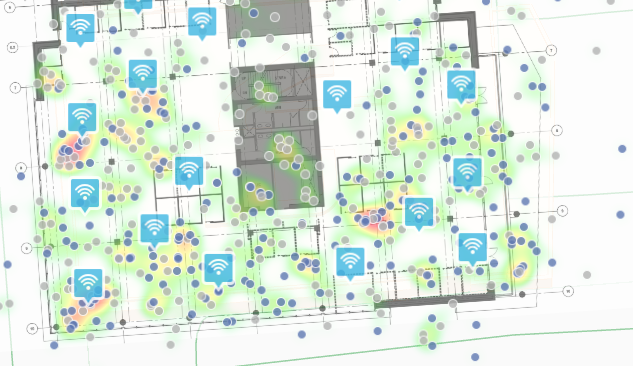
At this time, the dashboard’s location heatmap is going to aggregate client information over a duration of 15 minutes in order to show holistic trends and will not necessarily be an exact representation of where clients reside at that time. More detailed information on this feature can be found in our location analytics KB.
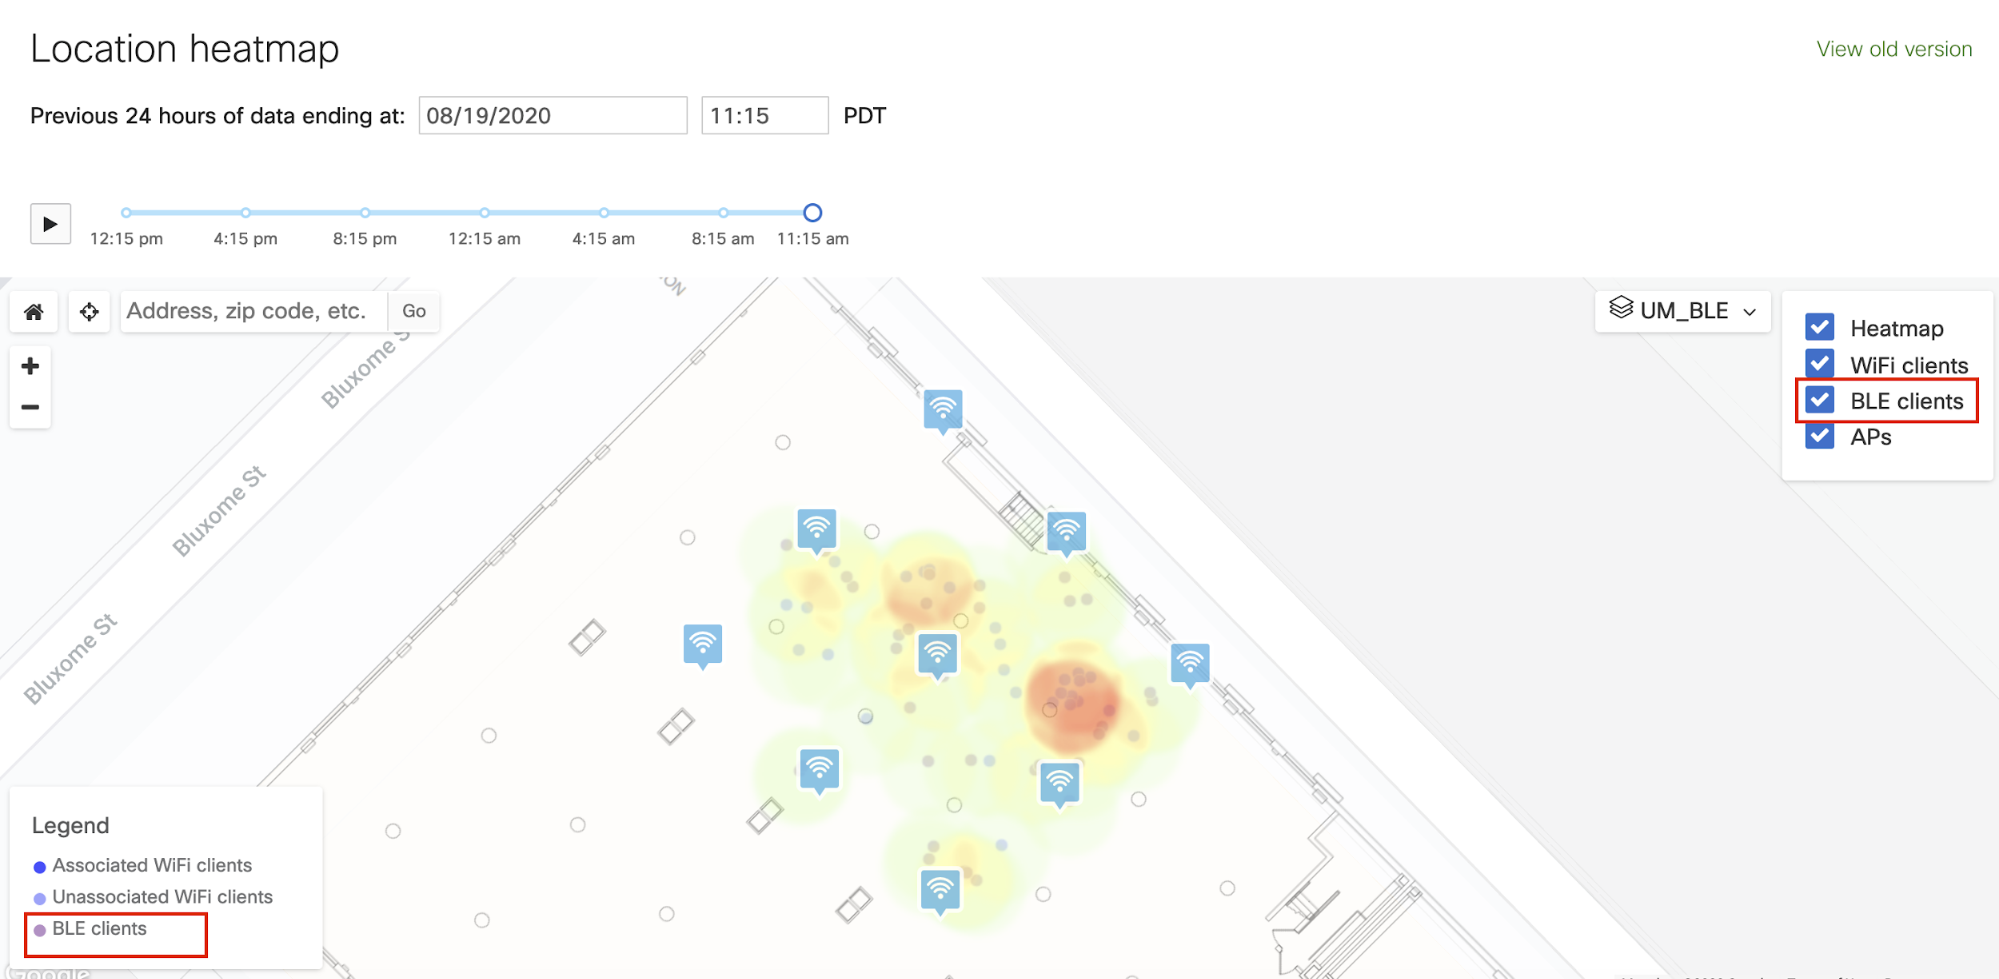
With MR 27.5 and onwards, BLE clients will also be included as a part of the Location heatmap page. They will be distinguished with a different color in the heatmap. The location of these BLE clients will also be aggregated over time and hence should not be considered as the actual location at any given time.
Location Considerations
When a wireless network is being created for a specific use case, special considerations need to be made and depending on the use case, the considerations may be different. For example, a voice network will have different considerations and requirements than a data network and vice versa. The same is true when designing and deploying a location ready network since the goal of such a deployment is to provide accurate client tracking. The design of a location ready network is integral to obtaining accurate client tracking data. There are multiple ways in which location information can be collected and depending on the use case the method of locating a client device will vary. Below are the two ways in which a wireless client can be located in the network:
-
Using Wi-Fi
-
Using BLE
The requirements for obtaining the location of any client are quite similar but there are some key differences between Wi-Fi-based location and BLE-based location. This document will highlight the requirements specifically depending on the use case.
Scanning Radio - used for Wi-Fi location
In order to accurately gather location information, all MRs in a dashboard network synchronize their scanning radio antenna to listen to the RF environment. When MRs see a packet from a client device, information is sent to the dashboard which aggregates and posts the data via the scanning API. MRs without a scanning radio, like the MR20, will provide fewer location data since these MRs have to use their client-serving radios to double as scanning radios. If location is the main goal of a network, it is advised to deploy MRs that have a 3rd antenna.
Since other features are capable of using the 3rd radio antenna, like air marshal and spectrograms, RTLS performance will be impacted if these features are used in tandem. If air marshal is actively containing a rogue device, the scanning radio will split its time between gathering RTLS data and containing the rogue device. It will be expected that fewer RTLS data points are gathered by the AP which may affect the final calculations. Lastly, if the spectrogram page is open on an MR, that MR will no longer participate in gathering RTLS information since the antenna is converted from a network analyzer to a spectrum analyzer.
IoT Radio - used for BLE location and MQTT
In order to capture BLE location information from the client devices, most of the APs have a dedicated built-in IoT radio. This radio can spend most of its time scanning beacons sent by the BLE tags or BLE devices in the network. If there are other Cisco Meraki devices in the network that utilize the BLE functionality for connection, then the IoT radio air time will be split between the scanning of BLE clients and supporting the connection for the other devices. Due to the nature of BLE and the number of beacons sent out we do not anticipate any significant impact on the location of the BLE client devices.
Note: Some APs such as the MR20/MR70 do not have an IoT radio and hence cannot be used for BLE based location calculation
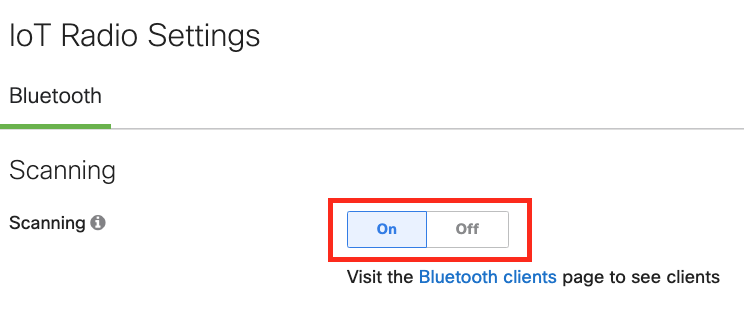
For the BLE location to work, BLE scanning needs to be enabled in the Dashboard. This is set to off by default for security purposes but can be turned on in order to receive the BLE beacons from the client device.
BLE Scanning can be turned on by navigating to Dashboard > Wireless > IoT Radio Settings> Scanning> On
Deployment Guidelines
Design - For Wi-Fi, BLE, and MQTT location
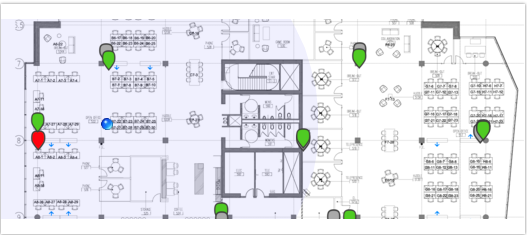
Proper placement of access points is recommended in order to fully leverage the benefits of location accuracy. It is important to note that all APs should not be clustered inside the floor plan, nor too spread out. For example, below on the left is a visual representation of a wireless network that was designed for a voice and data network, while on the right, for the same office, a design was created for an RTLS ready network.
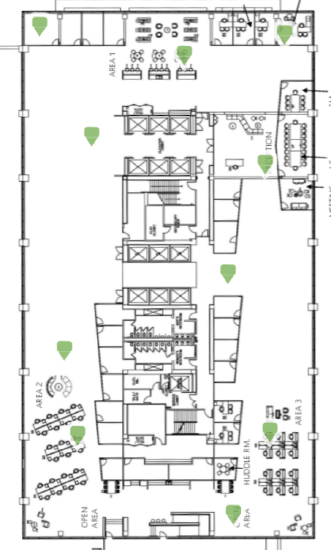
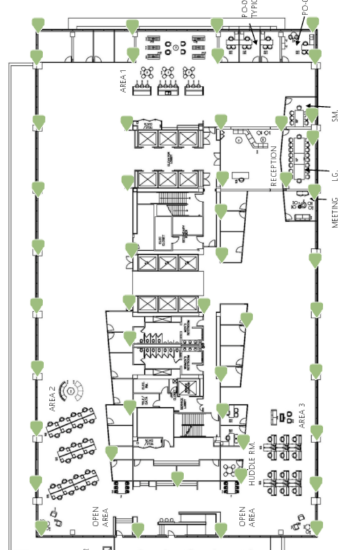
For reference, this floor plan is 100 ft x 230 ft (30.48m x 70.1m)
We can see that for the same floor plan, a location ready design requires over four times the access points for this floor plan. The main difference between the two layouts will be that for location, the APs will need to be placed along the entire perimeter of the floor plan, while also taking into account any other large obstructions like walls. Client location and tracking are expected to be more accurate when client devices are inside the perimeter of APs. It is expected for accuracy to taper off the further outside a client resides and in some cases, clients outside of the perimeter may appear inside of the building.
A good rule of thumb when deploying APs is to have a direct line of sight to a couple of access points at any given time. If this type of placement is not followed, an overall decrease in client accuracy will be observed.
The total number of access points required will depend on the environment and whether or not high path loss is present. Every location will be different, so there is not a one size fits all deployment guide. Lastly, when placing access points on the floor plan within the dashboard, take care to ensure that the placement is as accurate as possible. This is because the latitude and longitude of the APs are taken into account when calculating the client’s location.
Due to radio differences between the receive sensitivity of different AP models, there could be some minor variance in location accuracy across different MR models.
Deployment - For Wi-Fi, BLE, and MQTT location
In our testing, the best location results were obtained when using omnidirectional antennas. When mounting APs to the ceiling or walls, please ensure that all of the APs throughout the building are mounted at approximately the same height, and within the range of 2.5 - 3.5 meters off the ground. Since RTLS works by measuring the received strength of packets, access points should not be placed inside of ceiling tiles or in/behind solid objects. To conclude, the physical orientation of the APs does not affect the accuracy, so they can be mounted in whichever way is the easiest.
There could be challenges in real-world deployment locations where keeping the height of the AP within the 2.5 - 3.5m range may not be feasible. In such a case we recommend keeping the height of all APs the same since the location accuracy will highly depend on the height of the deployed APs.
Internal APs with external antennas might see some difference for location accuracy. For location analysis recommendation is to use omnidirectional dipole antennas.
Signal Strength - for Wi-Fi-based location only
Estimating a client’s location is achieved when three or more APs receive a client’s wireless frame, such as a probe request or an 802.11 data frame. The APs will then use the RSSI (Received signal strength indicator) information from the commonly seen packet, along with other information such as MR latitude and longitude to estimate the client's location.
Once the access points have been deployed, wireless coverage will need to be validated, which can be done by using a site survey tool such as Ekahau. For Wi-Fi location, the survey needs to confirm that there is at least an RSSI >=-67dBm and a Signal to Noise Ratio (SNR) of 25 or higher to three APs at any point throughout the floorplan. Client devices that do not meet these guidelines may be difficult to locate accurately inside the network perimeter.
When conducting a site survey, the survey visualization/heatmap needs to be adjusted to reflect how the weakest client will hear/interpret the network coverage, which is typically mobile phones. For Ekahau, this can be done using the “device offset” feature.
Example: If the survey device’s signal strength at a location is measured to be -60dBm and a phone is measured to be -64dBm, the survey device should be adjusted to simulate the weaker client device. This would result in the required signal strength for the floorplan being -63dBm (-67dBm - 4dBm).
If it is determined that the co-channel or cross channel interference is too high, which could result in lower throughput, some access points may be used as WIPs and only monitor the RF while not broadcasting SSIDs. This can be done by utilizing the SSID tagging feature.
Once the site survey has been completed and adequate coverage is confirmed, additional testing should be performed by walking through the floor plan to ensure that you achieve expected tracking results. If there are areas within the building that have a lower degree of accuracy, look for potential obstructions. That area may require an additional access point to provide enhanced triangulation.
Most of the site survey tools also allow AP placement planning using BLE. Please make sure to use the appropriate tool for the pre-deployment site survey when deploying the BLE location-ready network.
RF Profiles - for Wi-Fi-based location
Static channel assignment will override RF profiles settings assigned to an AP. While choosing a static channel, ensure that you have selected a static channel within the RF profile range assigned to that specific AP. This will ensure that the APs are tracking client devices more accurately for a network.
Using the API
The API is configured on the Network-wide > General page under the Location and scanning section. From here, the analytics feature will need to be enabled in the drop-down box, followed by the Scanning API. Once both of these features have been enabled, the dashboard will populate a validator string that’s shared across all networks within the organization, along with fields to add an external HTTP POST server.
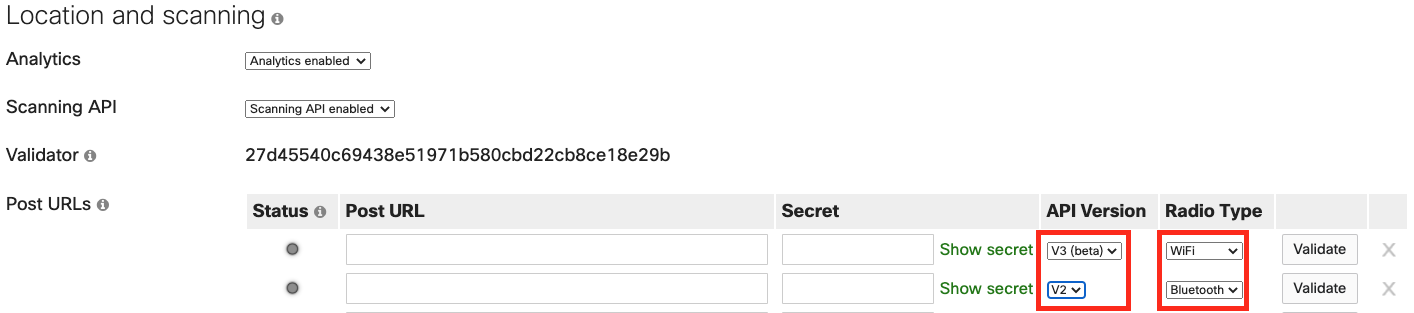
The server will need to respond with the validator when a GET request is made, along with being able to receive JSON POSTs.
Differences in Scanning API Version 2 and 3
For the Wi-Fi-based location
Major changes were introduced into the scanning API version 3 in order to greatly improve the overall accuracy. This was accomplished by changing how the AP aggregates data, along with how the dashboard correlates all of the data between the APs. This has allowed for accuracy improvements up to 3.5 meters. If the dashboard does not have enough data to estimate a client’s location, the locations field will be empty, but the AP that saw the strongest signal to the client will still be posted in the API data.
Another large change with version 3 is how data is posted. Data is now posted to the configured server on a per-network basis instead of a per AP basis like it is with version 2. Though, separate posts will still be made for Wi-Fi and BLE respectively.
Meraki cannot provide a guaranteed POST interval, as it can depend on a number of factors, including the quantity of access points in the network, and the response time (latency) of the customer receiver. Typical POST intervals range from 1-3 minute intervals but are not guaranteed.
Lastly, changes were made to how randomized MAC addresses are handled in version 3. In version 3 the API will include randomized MAC information only if the client is associated with an SSID from the AP. In the case the client is not associated and is also sending randomized beacons with locally administered MAC addresses (per the IEEE standard), the AP will discard the information and it will not show up in the API.
More specific information about the scanning API can be found over on our developer website.
Version 3 scanning API is available for Wi-Fi on firmware 26.1+
Wi-Fi client tracking prior to release 27 releases, the Wi-Fi clients were tracked based on the probe received from the originating clients. The MAC address received by the probe was tracked to be a single client and its information was passed on via the Scanning API for location analytics and client tracking/counting. With release 27 and later releases, client detection mechanism can also use data frame to detect the client location which provides more reliable detection and allow AP to count more accurate number of clients seen in the environment. This may result in seeing a higher client count (which is more accurate) with release 27 and later as compared to the previous firmware release versions
For BLE based location
There are some major changes that are introduced in version 3 for the Scanning API in order to obtain a higher level of accuracy. Meraki APs will use a triangulation technique to find out the location of each and every BLE tag or a BLE client device in the network. Hence, in order to triangulate, there is a constraint where the BLE beacon needs to be heard by 3 or more APs in order to calculate the location. There will be one update API post sent out on a per-network basis as opposed to individual APs in version 2. Also, if the BLE client is not seen by 3 or more MRs, the lastestRecord field will be used in the API to indicate the nearest AP which can be used to obtain the approximate client location.
Scanning API BLE version 3 is only available in wireless networks running firmware version MR 27.5 and above.
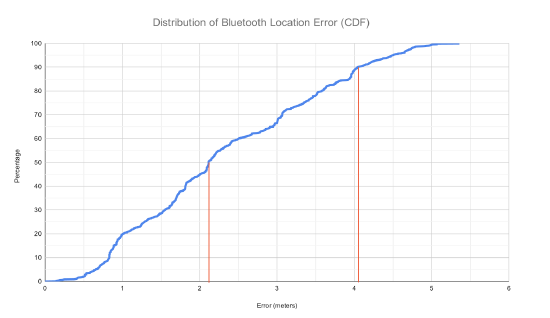
Based on internal lab testing, data was gathered over a month from multiple BLE devices ranging from the BLE tags to smartphones. In order to represent the accuracy that we saw, the data were aggregated into a cumulative distribution function graph (CDF), which shows the probability of accuracy for any given data point. Based on our findings, most BLE tags in the industry operate in the same way, and therefore, we have no specific recommendations on one over the other.
In our testing, a custom SDK was used to configure the UUIDs on mobile devices. This helped us identify each client device uniquely even though the client randomized their MAC address in each and every beacon.
As seen above, 50% of the location samples are within 2.2m of the actual location of the BLE tags or mobile device. Around 90% of the location samples are within 4.1m of the actual location of the BLE tags or mobile devices. These results are based on our location testing in a controlled environment. The location accuracy number may change from network to network depending on the AP placements and the location of the BLE devices.
As the number of observing APs increases, the client location accuracy will improve. Here is a table based on our location testing in-house:
|
APs |
Median Error |
Average Error |
|
4 |
3.915 |
4.354 |
|
5 |
3.111 |
2.995 |
|
8 |
2.553 |
2.725 |
|
9 |
2.257 |
2.468 |
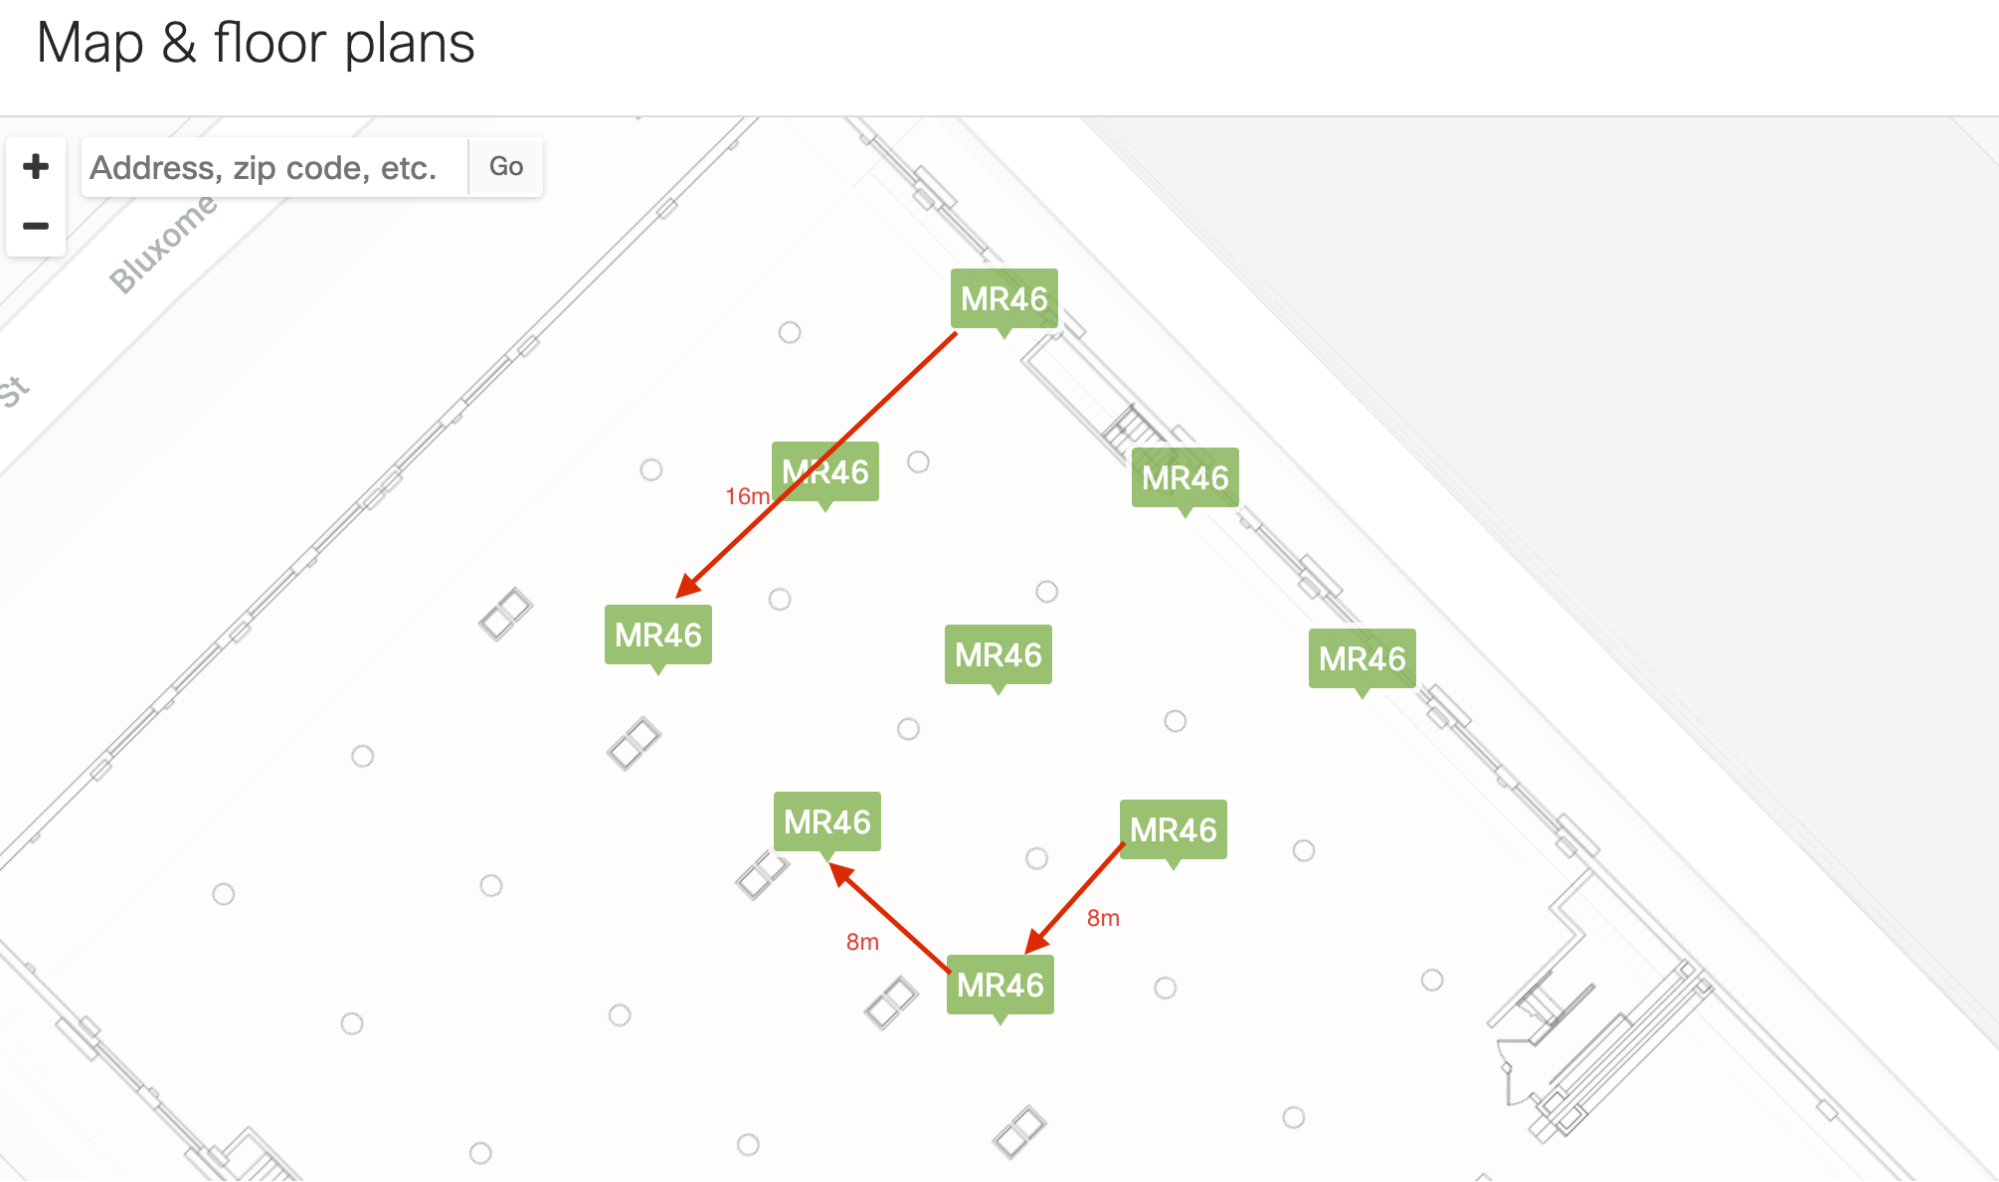
In-house testing AP placement for BLE location calculation:
Using the API
The scanning API can be leveraged to help IT administrators capture foot traffic patterns, provide detailed network-based information, or even be utilized with a custom-built SDK to send push notifications to customers.
Applications such as DNA Spaces or Purple can natively ingest the API and perform analysis, but there is always the option to join the DevNet community in building new applications for different use cases that your business may have.
Privacy
It is becoming more and more popular for wireless devices to change their wireless media access control (MAC) address for anonymity purposes, which can make it difficult to obtain accurate client count information. Meraki’s API will filter out all un-associated locally administered MAC addresses per the IEEE standard in order to provide more accurate numbers. As the number of mobile devices that implement randomization increases, solutions to detect and locate devices have changed. Meraki provides additional capabilities such as Bluetooth information via the Meraki Scanning API, enabling Meraki customers to anonymously include wearable devices as part of their location analytics dataset.
In order to learn more about how Meraki stores location analytic data with privacy in mind, please review the following the Location Analytics Hash Function documentation.
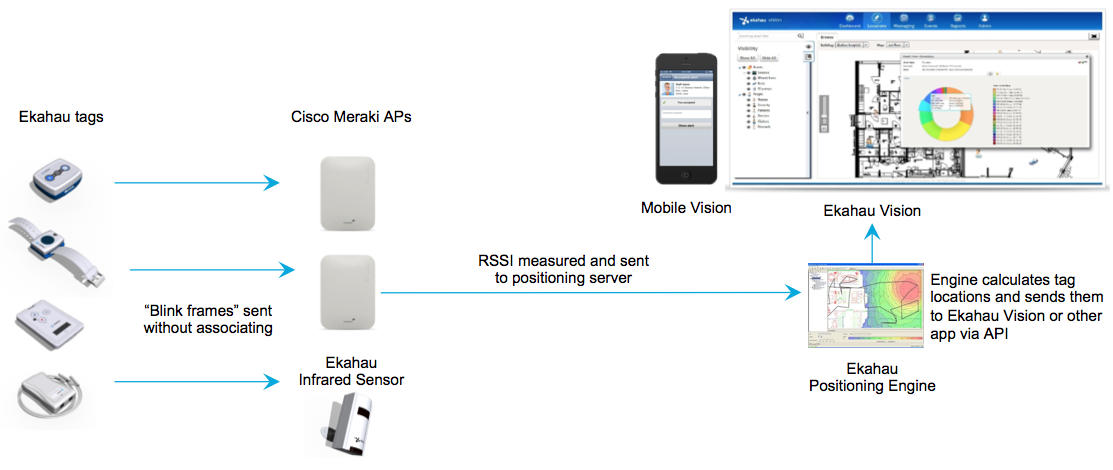
Cisco Meraki access points also integrate with Real-Time Location Services (RTLS) software from Ekahau and Stanley Healthcare (previously known as AeroScout). These RTLS vendors offer the ability to track clients or Active RFID tags with great accuracy in real-time, graphical formats. Cisco Meraki APs support Ekahau and Stanley / AeroScout tags in both unassociated “blink mode” and associated “connected mode”. Blink mode is used in order to conserve the battery of the Wi-Fi tags as they are not connected to the AP full time.
Meraki integrates with Ekahau's Real-Time Location Services (RTLS) solution, which offers the ability to track clients or tags with great accuracy in real-time, graphical formats. For detailed documentation on Ekahau's products please visit the Ekahau website.
In associating mode, the tags will associate with the Meraki AP and independently communicate with the Ekahau positioning engine. No special configuration of the Meraki AP is required.
Blink Mode
In blink mode, the tags will not formally associate with the AP, but will instead broadcast information which is collected by the AP and then sent by the AP to the Ekahau server.
To configure a given Dashboard wireless network to work with tags in Ekahau blink mode:
-
Select the wireless network from within Dashboard
-
Go to Network-wide > General
-
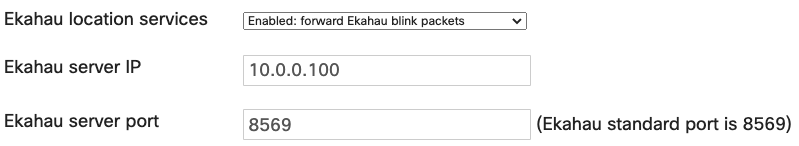
Change “Ekahau RTLS” to “Enabled”
-
Enter the IP and port of your Ekahau positioning engine.
-
Select “Save Changes”.
The Meraki APs on the selected wireless network will now pass information from Ekahau blink tags back to your Ekahau server.
Stanley/AeroScout branded products are available for purchase through Cisco. Meraki integrates with both Stanley and AeroScout branded RTLS solutions. For detailed documentation on Stanley's products please visit the Stanley Healthcare website.
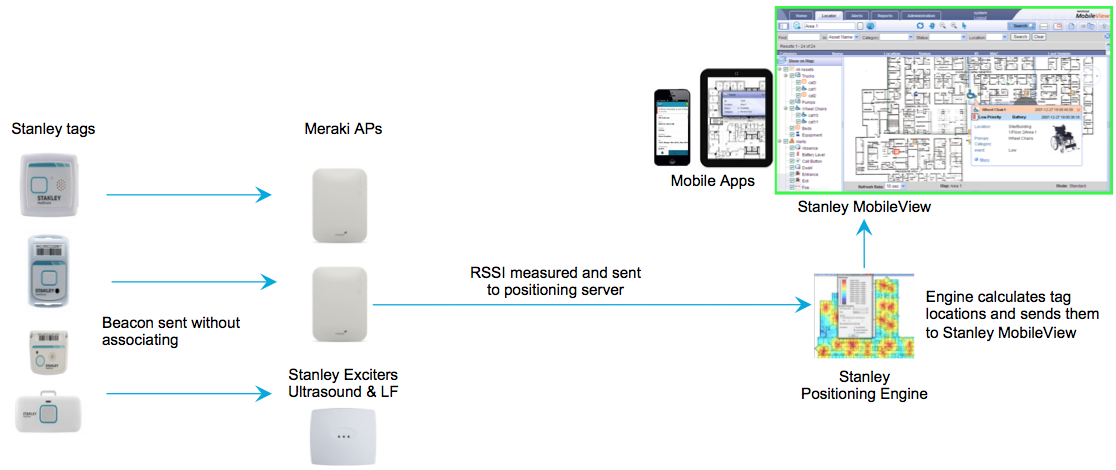
In associating mode, the tags will associate with the Meraki AP and independently communicate with the Stanley positioning engine. No special configuration of the Meraki AP is required.
Blink Mode
In blink mode, the tags will not formally associate with the AP, but will instead broadcast information which is collected by the AP and then sent by the AP to the Stanley server. To configure a given Dashboard wireless network to work with tags in Stanley blink mode:
-
Select the wireless network from within Dashboard
-
Go to Network-wide > General
-
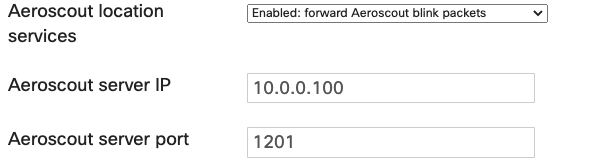
Change “AeroScout RTLS” to “Enabled”.
-
Enter the IP and port of your Stanley / AeroScout positioning engine.
-
Select “Save Changes”.
The Meraki APs on the selected wireless network will now pass information from Stanley blink tags back to your positioning engine.
Client Accuracy
If all of the above recommendations have been implemented but you’re not seeing the accuracy that you believe you should be receiving, the following tests can be conducted to get a baseline.
-
Place a BLE/wireless client somewhere on the floor plan overnight and ensure that it does not go to sleep. For wireless clients, streaming a long YouTube video will help to prevent a client from going to sleep.
-
In the morning aggregate and plot all of the lat/long points from that specific client
-
To get more granular, you could estimate the test device’s location and perform a delta between the actual lat/long with what the API output is providing.
-
-
If accuracy concerns appear to affect specific devices, walk the floor plan with one of those devices, and see if it’s able to see at least three BSSIDs (access points) at any given time.
-
Also, pay attention to the signal strength that it sees these access points at. The issue could be that the signal strength is weak and it’s difficult for the APs to “see” the client in order to estimate its location
-
The receiver is not receiving POSTs
If your receiver is not receiving POSTs, a few checks can be made on the dashboard.
-
Check Network-wide > General > Location and scanning > Post URLs. Click on the LED to the left of the URL of interest to view the most recent errors.
-
Select “Validate” for the URL in question to ensure the dashboard is able to reach and connect to the endpoint correctly.
-
If the dashboard encounters an error reaching the endpoint, a reason and HTTP code will be shown.
-
If everything above checks out, verify server logs to see if POSTs are being made from the dashboard. If this is not an option, Support can be engaged to check when the last successful POST has been made.