
Enhanced Topology
Note: Enhanced Topology is coming up with exciting new features and updates rolling out in phases to ensure a smooth transition and to gather valuable user feedback. The initial rollout will ensure alignment with existing layer 2 topology features while introducing a modernized appearance, improved network visibility along the additive functionality around client visibility and information! Stay tuned for more exciting developments and expect future additions to this page as we continue to improve your experience
Overview
Network Topology is a powerful tool that provides administrators a graphic overview of the physical and logical network topology. It provides a holistic overview of the connectivity of the network especially when it comes to documentation, monitoring and troubleshooting. This document aims to provide detailed information about the physical network topology and the enhancements added.
The Layer 2 Network Topology under Network-wide > Topology is a complete overhaul of the existing L2 topology under Network-wide > Topology > L2 tab. The new and improved Layer 2 topology experience comes with the below enhancements:
-
New Front end framework that is optimized for performance, with interactive components to help you provide more visibility and control
-
Modern and distinct look of the device icons that resonate with industry-standard representations
-
Health Overview
-
Client Visibility
-
Enhanced visibility into devices, their connectivity, links and issues

Requirements and limitations 
-
Cisco Meraki MS switches must be deployed in the network for the Network Topology feature to be available.
-
To opt-in into the new and improved Topology experience, navigate to Organization > Early Access page and opt-in to Enhanced Topology
-
Once you have opted in, navigate to Network-wide > Topology to access the new Topology experience.
-
The L3 Topology tab is will be available as a link on the new Enhanced Topology page incase you wish to visit the legacy version of the L3 topology. L3 topology modernization and enhancements are currently out of scope and will likely come along later in the future
Understanding Enhanced Topology
Before we dive deeper into the features of Enhanced Topology, let’s have a look at the different representations used in Enhanced Topology and how to navigate and interact with the topology map
Navigating the Topology Map
To navigate the enhanced topology map, simply use the mouse scroll function to zoom in and out of the topology map. You can also click and drag to move across the map and explore different areas. The default, zoomed out view will provide high level connectivity of different devices and their respective connectivity to Meraki cloud represented via the device status badge.
Device Status Rationale
Below is what each of the device status badges represent:
|
Device Status Badge |
Device Status |
Description |
|
|
Online |
The device has a healthy connectivity to the Meraki cloud |
|
|
Alerting |
The device is online but is in alerting state due to one or more alerts. |
|
|
Offline |
The device does not have connectivity to the Meraki cloud and is in the offline status |
|
|
Dormant |
The device has been in the offline status for more than 7 days |
|
|
Unknown |
The device status is unknown. This is typically because the device is not reporting its connectivity status, or the device is a cisco device that is not meraki monitored or managed, OR the device is a third party vendor device. |


Device Icons
Each of the below device icons provide a clear distinction between different types of networking devices. If we cannot determine the device type because of lack of LLDP data shared by the device, by default we will represent that device with a switch icon.
|
Icon |
Device Type |
Examples |
|
|
1 |
|
Switch |
Meraki Switch (MS), Cisco Switch (CS), third-party device categorized as switch, default device type if the third party device does not provide device type information |
|
2 |
|
Router/ Firewall |
MX (Security Appliance), Firewall, third-party device categorized as router |
|
3 |
|
Access Point |
MR (Meraki Access point), Cisco Access point, third-party device categorized as access point |
|
4 |
|
IOT device - Camera |
MV (Meraki Vision) |
|
5 |
|
Gateway |
MG (Meraki Gateway) |
|
6 |
|
IOT device - Sensor |
MT (All model types) |


Note: Some of the device icons listed above might be rolled out in future updates in the upcoming enhancements.
Device Distinction
In order to further provide visibility into and distinguish various networking devices by vendor types as well as their placement in the Meraki dashboard network, below are the different border representations used in Enhanced Topology.
|
Representation |
Border Type |
Device Type |
Examples |
|
|
1 |
|
Line border |
Meraki Device or Cisco (Meraki Managed) device |
Meraki MS, MX, MV, MR, MT, MG or any Cisco managed SKU (C9200, C9300, -M SKUs) in the current network |
|
2 |
|
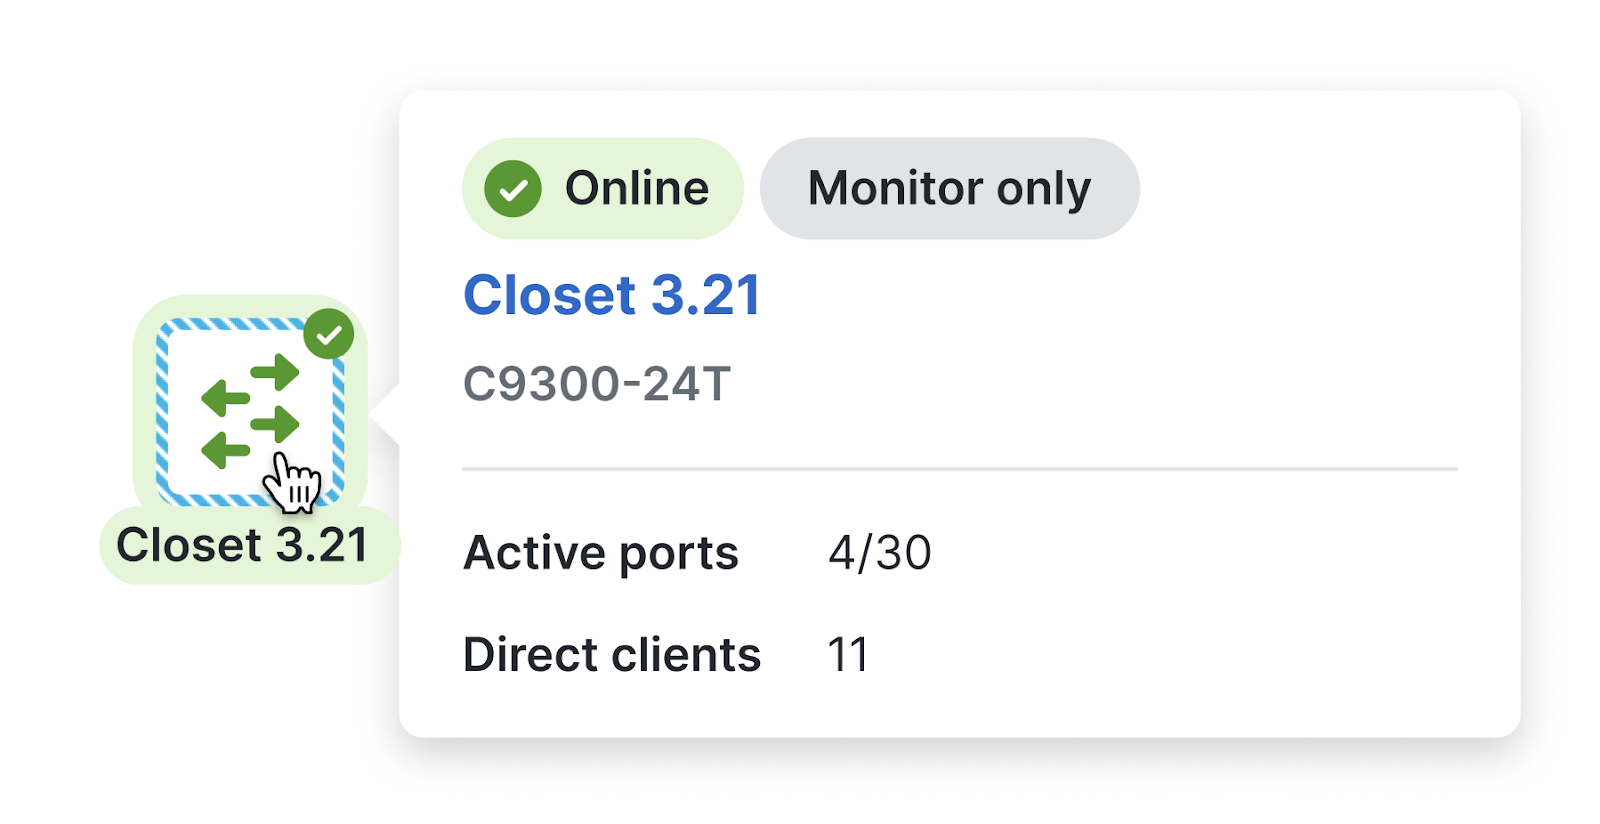
Blue striped border |
Cisco Device or Cisco (Meraki monitored) device |
Cisco switch, Cisco Access point, Cisco device in meraki monitor mode |
|
3 |
|
Purple striped border |
Meraki Device in another Meraki dashboard network |
Meraki device physically connected to this network but part of a different dashboard network in that organization |
|
4 |
|
Grey striped border |
Third party vendor device |
Non-cisco and Non-meraki device |


Please note that the icon type shown above of a switch is for representation purposes only to differentiate different border types. Based on the device type, the device icon enclosed within the border will reflect accordingly.
Exploring Enhanced Topology
Enhanced Topology revolutionizes a user’s network monitoring and troubleshooting with an intuitive and interactive network topology map, designed to give users complete visibility and control over their network infrastructure. Here is a detailed description of the features and enhancements in Enhanced Topology:
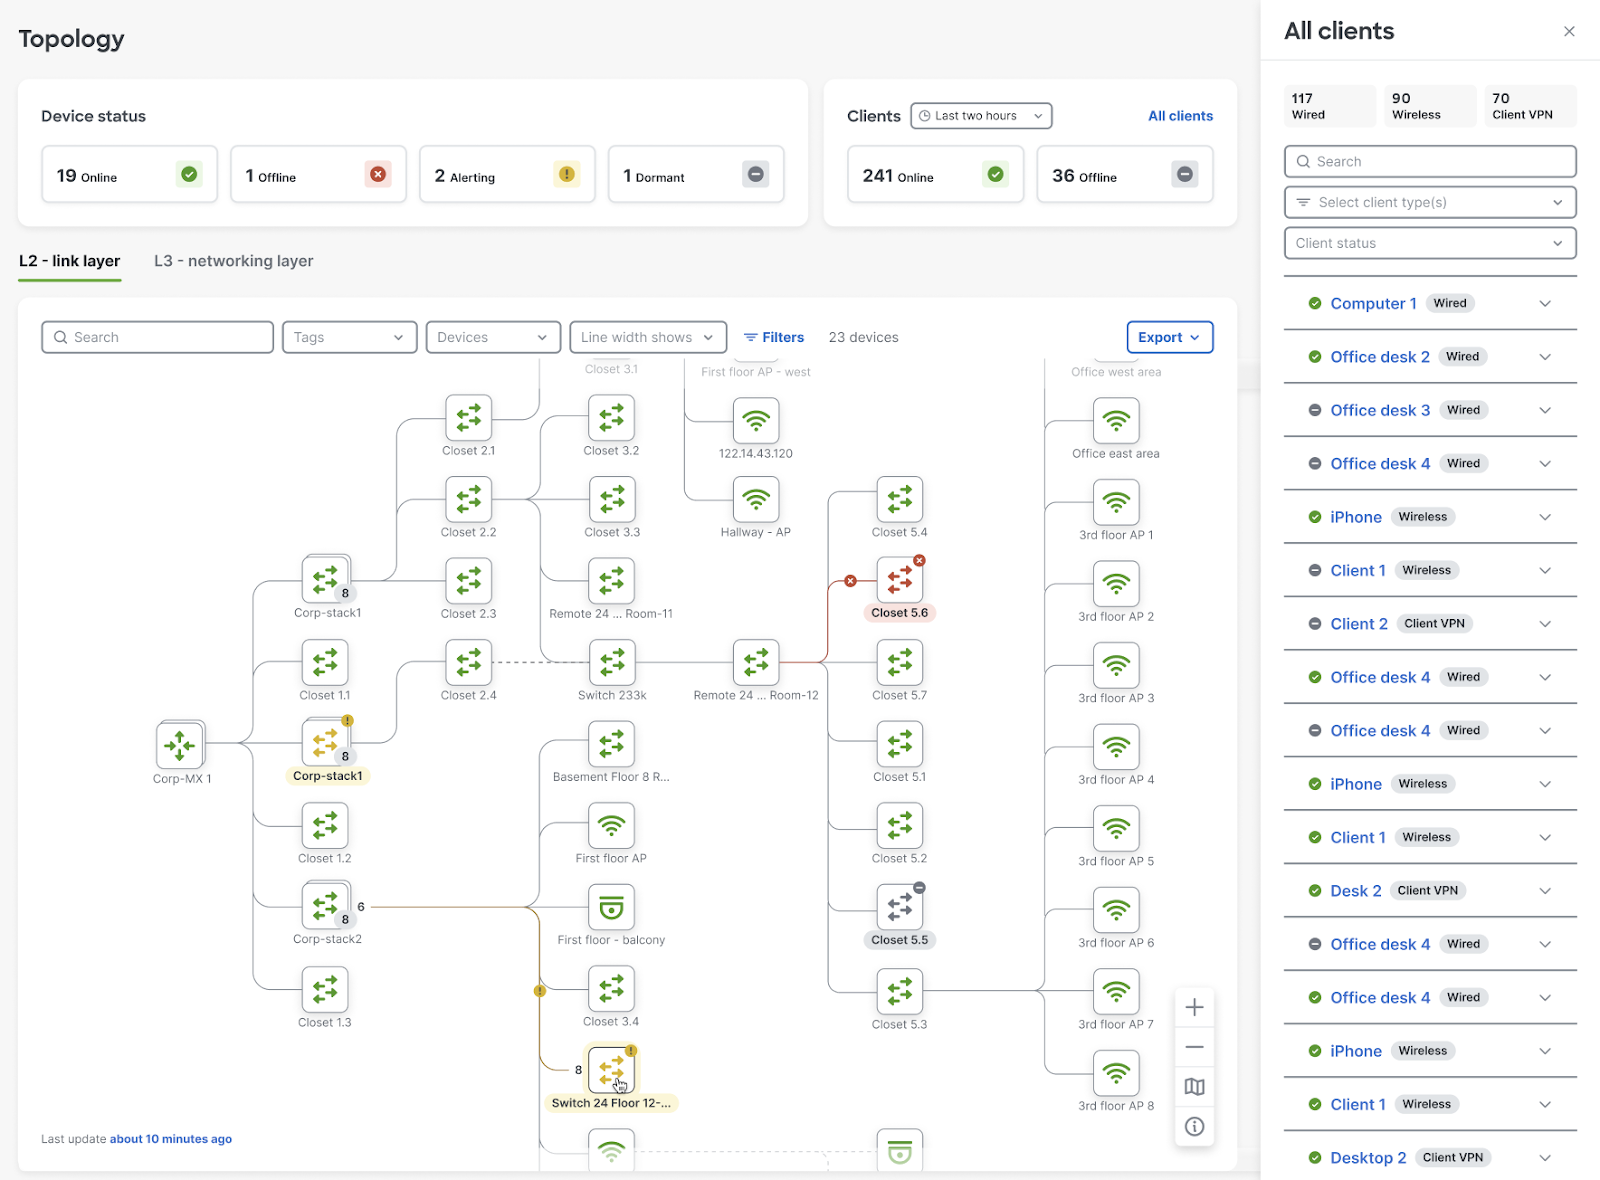
Summary Overview
Enhanced Topology comes with a high-level snapshot of your networking devices and client information.
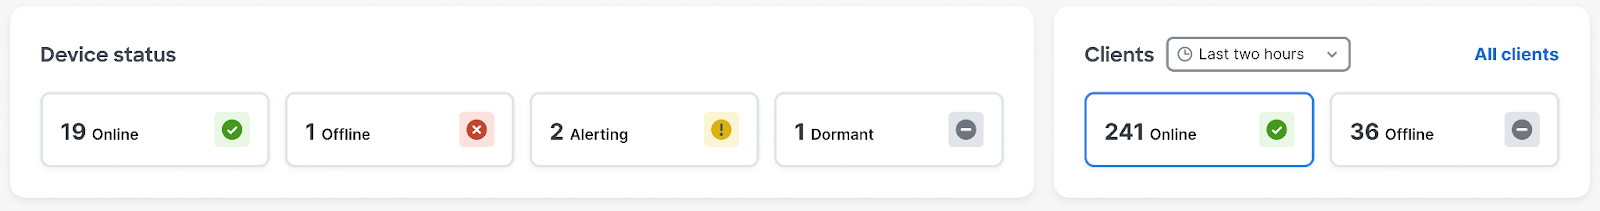
Device Status:
-
The Device Status widget within the Summary view provides a snapshot of your networking devices’ status - Online, Offline, Alerting, and Dormant.
-
Each of the cards is interactive, hence a user can click on either to filter the devices matching the specified device status. Clicking on the “Offline” card, for instance, will highlight the 1 offline device in the network, fading the rest of the devices in the network that does not match this condition. To unselect a card, simply un-select the selected card, click on another status card OR click anywhere on the page.
Client Information:
-
The Clients widget within the Summary view provides an aggregated count of total online v/s offline clients in the network for the duration of time selected in the drop down.
-
Each of the cards is interactive. Clicking on either of the online or offline card will open up a Clients Drawer panel to the right listing all the clients in the network applying a pre-filter = status card chosen
-
All Clients hyperlink open the Clients Drawer panel without any status pre-filters
Device Details
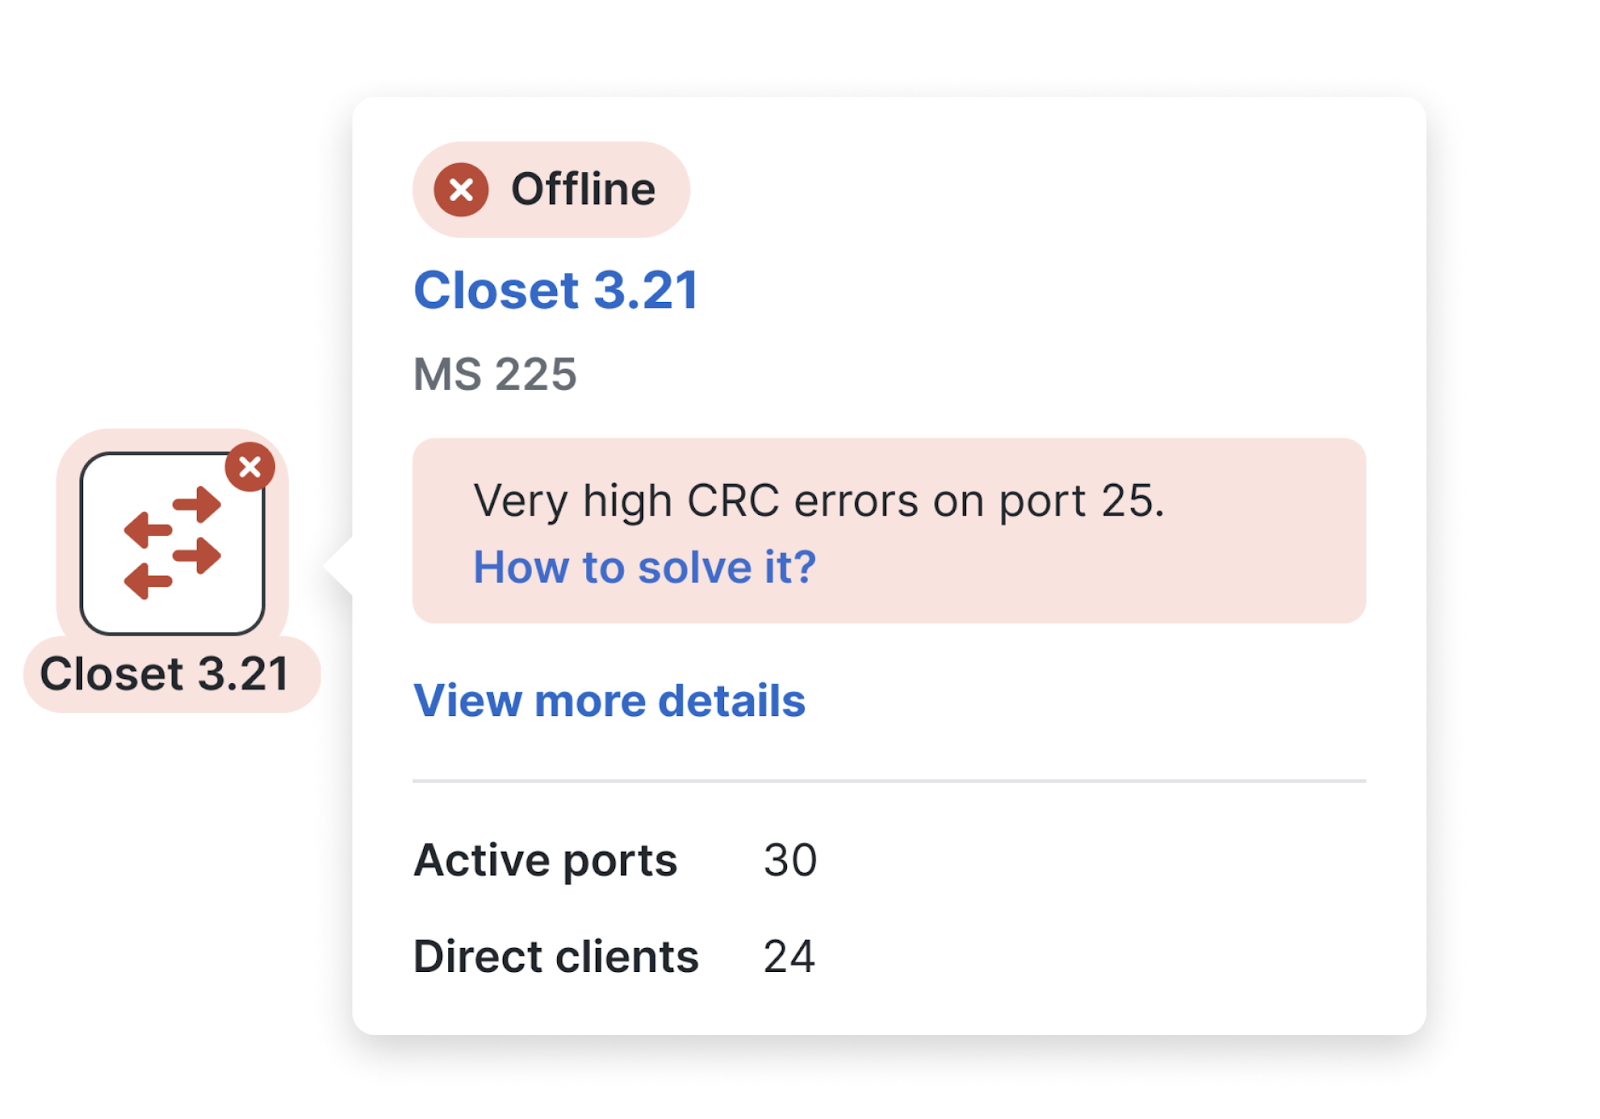
A hover or click on a device on the topology map will open up a device info pop-over that provides details about the device such as:
-
Model Number
-
Device Type
-
Device Status Info
-
Additional context if the device is in an Alerting state
-
Direct Clients
Note: The information within the popover is expected to change and vary depending on the type of device selected and the information the device has reported.
Link Details
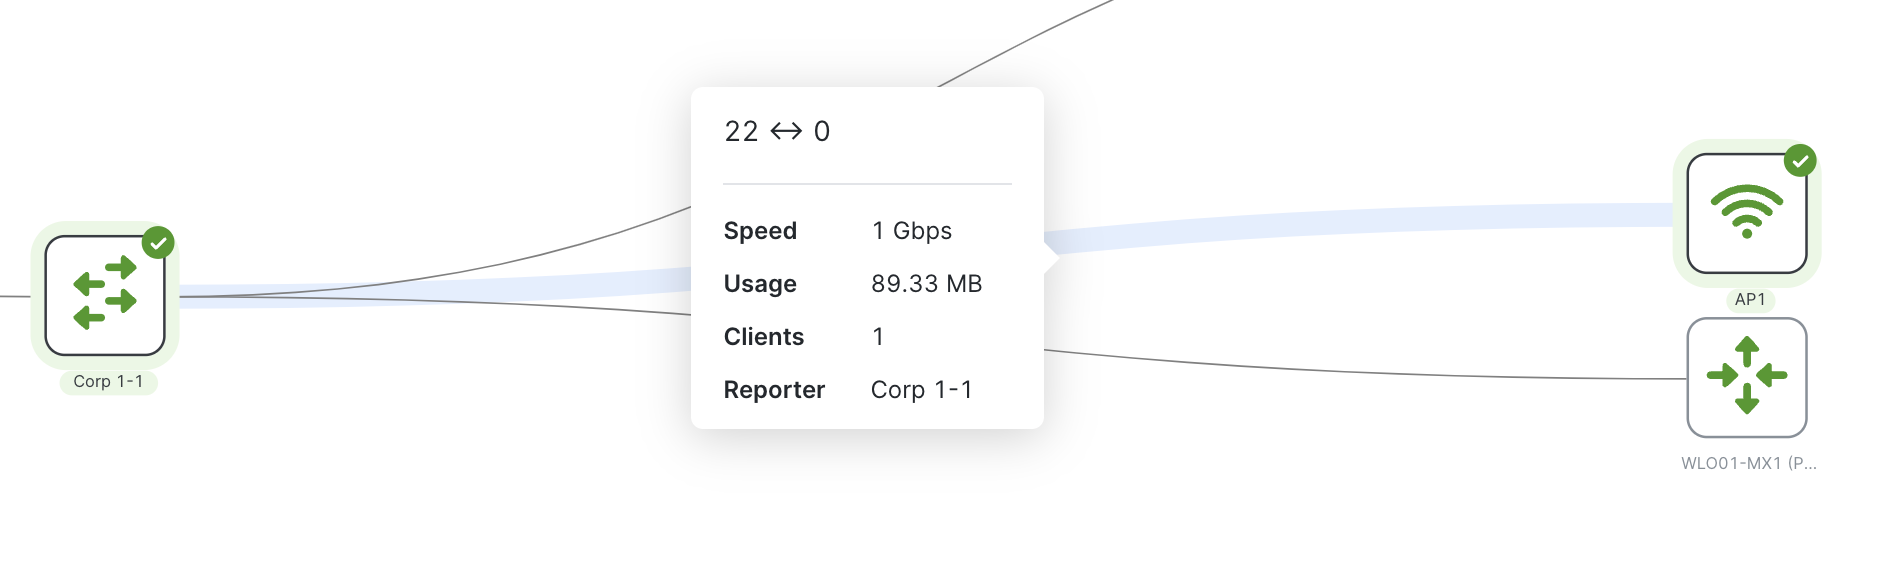
A hover or click on a link between two devices on the topology map will open up a link info pop-over that provides details about the link such as:
Speed
-
Device and Port number information that the link connects to on either end
-
Speed
-
Usage
-
Clients
Note: The kind of information within the popover is expected to vary depending on the type of device the link is between and the information that is reported by devices on both ends of the link.
Note: Hyperlink for the ports within the Link popover will be rolled out to Enhanced topology in the upcoming enhancements.
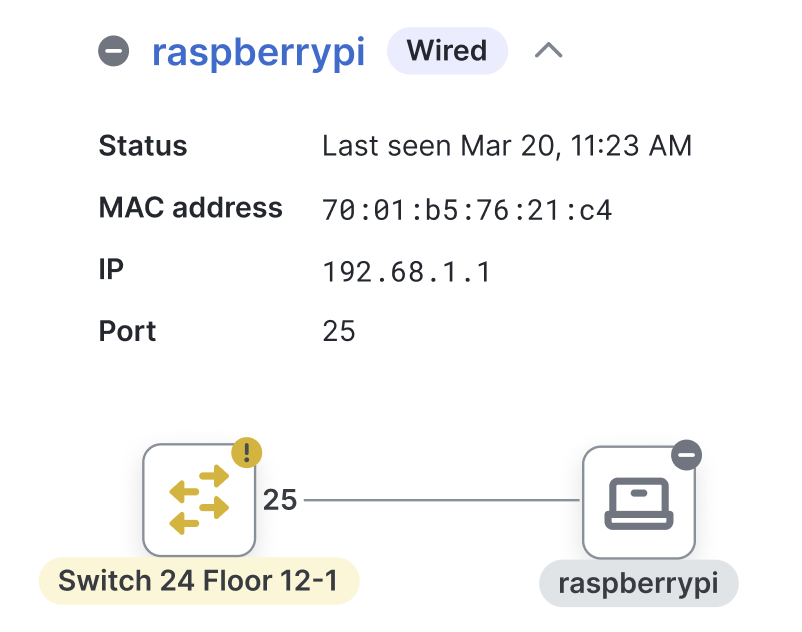
Client Details
Clicking on the Clients Widget will open up the Clients Drawer panel to the right which has a list of all clients in that network along with additional details.
The Clients drawer panel provides an aggregated count of clients on the top based on the client connection type - Wired, Wireless, and Client VPN
Search and Filter options:
-
Search: This is a catch-all search field. You can search a client by its name, MAC address, IP etc.
-
Client Types: This is a multi-selector option, that lets you filter clients by client type - Wired, Wireless, Client VPN
-
Client Status: This is a single selector option to filter for Online v/s Offline clients
Note: This drawer will display a maximum of 100 clients that match the specified filter. For a larger list please navigate to the Network-wide -> Clients page.
Client’s Detail Card:
-
To get more information about the client’s IP, MAC, connectivity on the network easily expand and collapse the detail section for each of the clients in the list
Note: The client information represented on the Network-wide > Enhanced Topology page is a replica of the information on the Network-wide > Clients page. If you notice any issues or errors with the information being presented for the clients, please ensure the behavior on the Network-wide > Clients page before reporting an issue with Enhanced Topology
Feedback
Please share your feedback on the new topology experience using the “Feedback” button on the top. Our teams will be actively monitoring the feedback to ensure we provide the best experience to our users.