

How to Use the MX Live Tools
Overview
The Live tools under Security & SD-WAN > Monitor > Appliance Status > Tools provide useful information for troubleshooting network issues on the WAN appliance. Each tool pulls information from, or interacts with, the WAN appliance in real time.
Learn more with these free online training courses on the Networking Learning Hub:
The following tools are available:
- Live uplink traffic – real-time upload and download usage on the active Internet/WAN link(s)
- DHCP leases – active DHCP leases issued by the WAN appliance
- Ping – ICMP Echo requests and round trip time (RTT) latency to a destination
- Traceroute – the network path and per-hop latency to a destination
- MTR – hop-by-hop reachability analysis that combines ICMP and traceroute
- DNS – hostname resolution using the primary DNS server configured on the WAN appliance
- Throughput – a one-time download speed test from dashboard
- Blink LEDs – blinks the front-panel LEDs to identify the appliance on site
- Reboot appliance – remotely reboots the WAN appliance
- Umbrella connectivity – tests communication with the Cisco Umbrella cloud service
Prerequisites
- Dashboard access to the network that contains the WAN appliance, with permission to view Security & SD-WAN > Monitor > Appliance Status.
- A destination IP address, or an FQDN where supported, for the Ping, Traceroute, MTR, and DNS tests.
- Cisco Umbrella integration with Meraki. The Umbrella connectivity tool appears only when Umbrella is integrated.
Step-by-step instructions
Open the Live tools
-
In dashboard, go to Security & SD-WAN > Monitor > Appliance Status.
-
Select the Tools section.
-
Select the tool to run. Live uplink traffic is selected by default.
Monitor Current Clients (wireless only)
On wireless-capable MX/Z appliances, the Security & SD-WAN > Monitor > Appliance Status: Current clients tool, automatically shows the associated wireless clients currently connected, data usage, and how long the user has been associated with.

Monitor live uplink traffic
-
Select Live uplink traffic.
-
Review the Internet traffic graph for combined upload and download usage on the active Internet/WAN link(s). When both Internet links carry traffic, each link appears in its own color.
Use this tool to see how much data enters and leaves the network at present. For historical usage, go to Network-wide > Monitor > Clients.

View DHCP leases
-
Select DHCP leases.
-
Review the table of clients that hold active DHCP leases on the WAN appliance.
Use this tool to confirm that client devices receive IP addresses and to identify the addresses they received. For more information, visit the article on Configuring DHCP services on the MX.

Run a ping test
-
Select Ping.
-
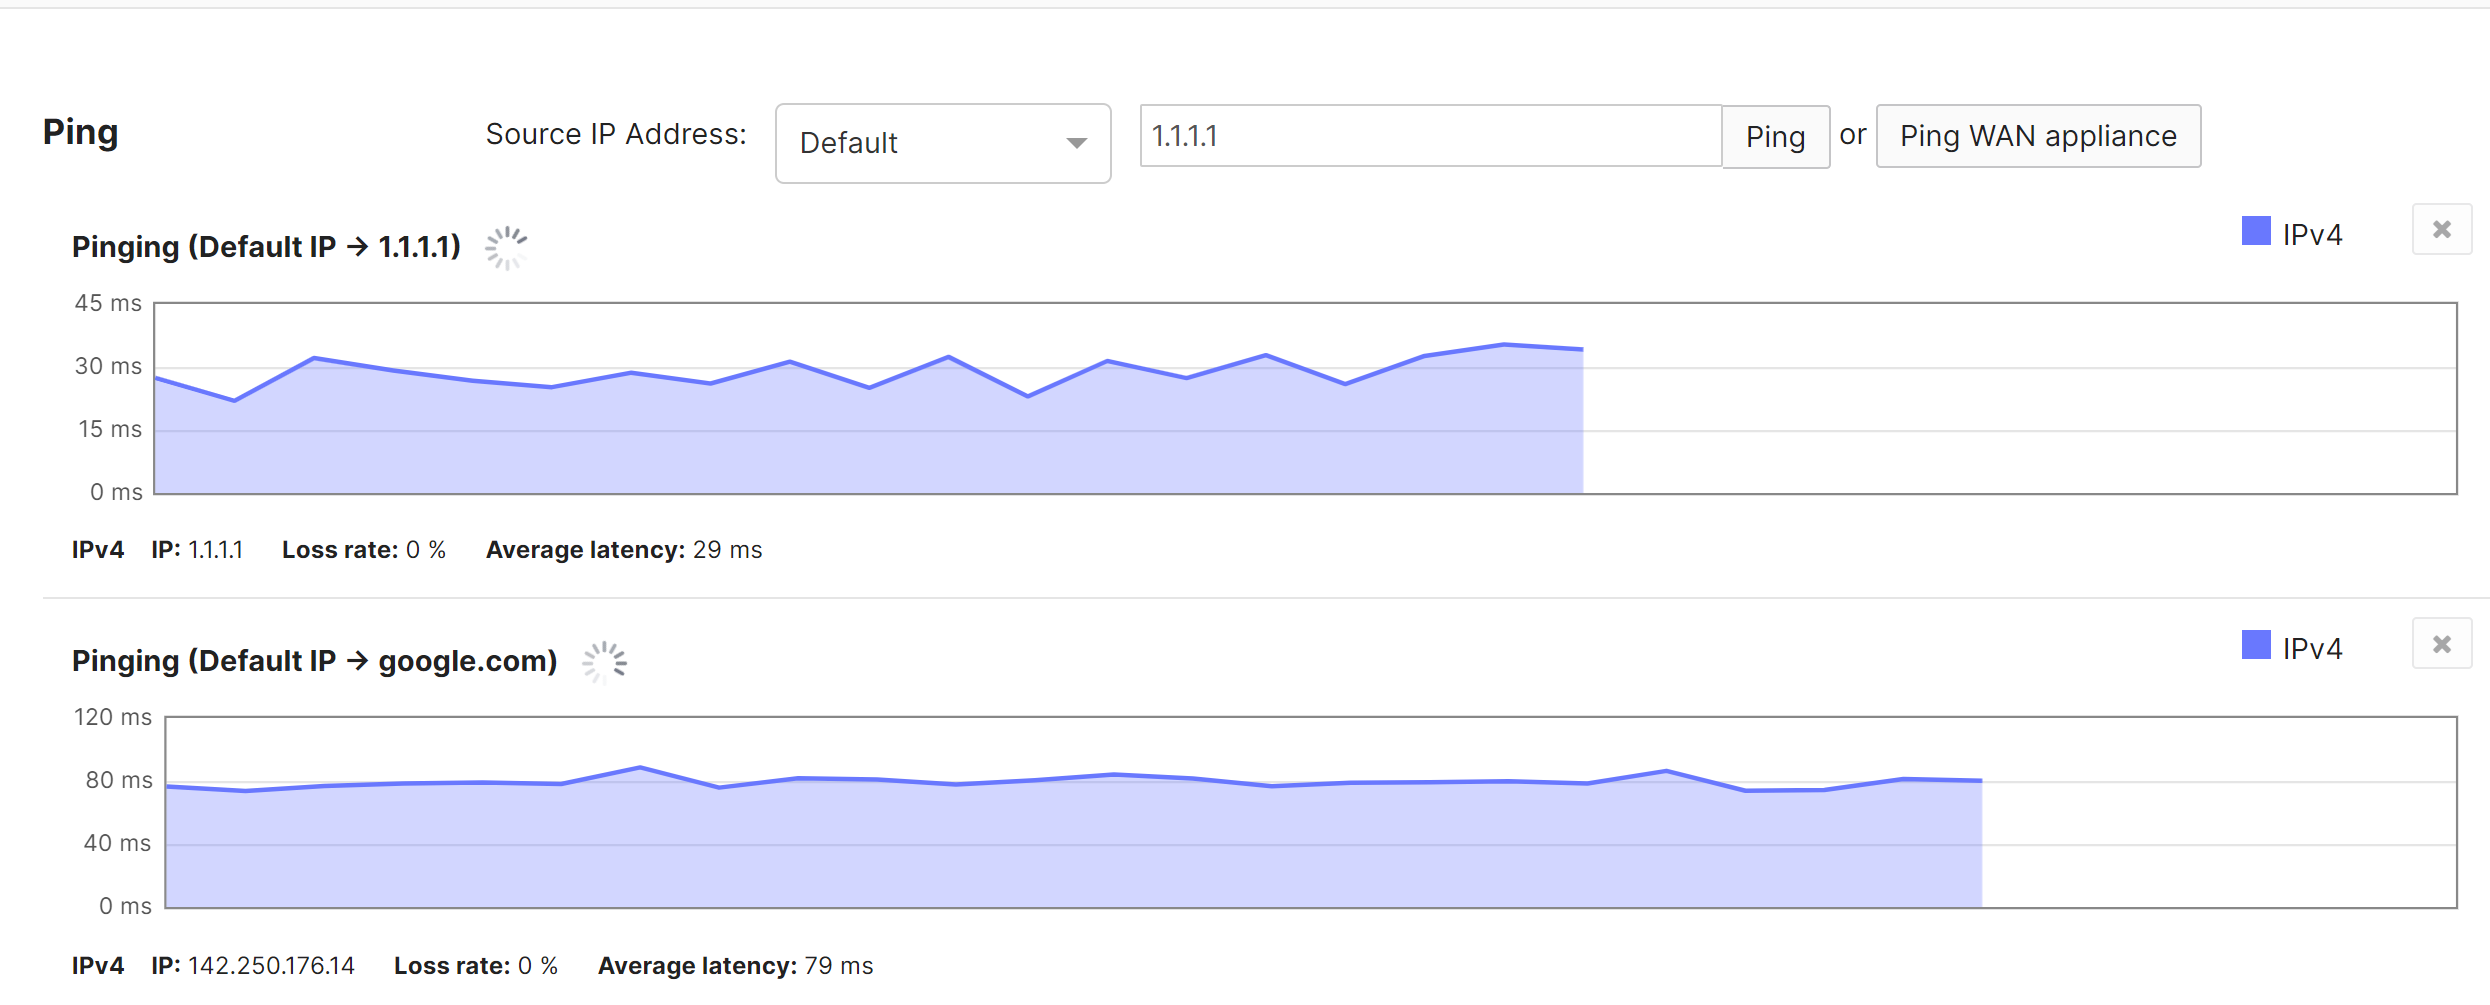
Enter the destination IP address and start the test. The tool sends a series of ICMP Echo requests and graphs the round trip time (RTT) latency.
-
Select the || (pause) symbol to stop a test, or select X to remove a ping test.
Use this tool to verify connectivity from the WAN appliance itself to internal clients, to remote endpoints over static routes or VPN, or to Internet destinations. For more information, refer to Using the Ping Live Tool.
Run a traceroute
-
Select Traceroute.
-
Enter the destination IP address and start the test. The tool continuously sends ICMP echo requests with an increasing TTL (time to live). Each router along the path responds, identifying itself and the latency to that point in the path.
Use this tool to see the path traffic takes across the network to reach a destination, and the latency to each hop. 
Run an MTR test
-
Select MTR.
-
Enter the destination FQDN or IP address and start the test.
-
Review the hop-by-hop reachability results.
An MTR test combines ICMP and traceroute functionality to perform a more detailed reachability test. Use it to identify potential causes of loss or delay to a destination from the WAN appliance's WAN IP.

Perform a DNS lookup
-
Select DNS.
-
Enter the hostname and run the lookup. The tool resolves the IP address using the DNS primary server configured on the WAN appliance.
Use this tool to diagnose connectivity problems when the DNS server may not function correctly, or to remotely confirm that a hostname resolves.

Test throughput
-
Select Throughput.
-
Run the test. The tool performs a one-time download speed test from dashboard.
Use this tool to generate additional traffic on an Internet link and to test the speed at which information can be retrieved from dashboard.

Blink the appliance LEDs
-
Select Blink LEDs.
-
All LEDs on the front of the WAN appliance blink in unison until you stop the tool.
-
Stop the tool when the local user identifies the appliance.
Use this tool to identify the WAN appliance within a stack of other equipment when coordinating with a local user remotely.

Reboot the appliance
-
Select Reboot.
-
Wait for the appliance to come back online. A complete reboot generally takes less than 3 minutes.
A reboot provides the same effect as disconnecting and then reconnecting the power cable. The device retains all of its settings while clearing any caches and restarting the ports and services. Use this tool to clear transient issues or to allow faster updates after replacing an upstream or downstream networking device, such as a modem.

Test Umbrella connectivity
-
Select Umbrella connectivity.
-
Select Run to test whether the WAN appliance can communicate with the Cisco Umbrella cloud service.

Verification
Confirm each test completes as described below:
- Live uplink traffic – the graph updates in real time and shows combined upload and download usage, with individual colors for each Internet link in use.
- DHCP leases – the table lists client devices and the IP addresses the WAN appliance assigned to them.
- Ping – the graph plots round trip time latency for the responses received from the destination.
- Traceroute – the results table identifies each hop along the path. Interpret the columns as follows:
- Hop – how many layer 3 devices, such as routers, the traffic has passed through. Hop 1 is the first router along the path. Multiple hosts at the same hop number can indicate multiple paths.
- Host – the IP address of that particular hop.
- Count – the number of times that hop has responded during the test.
- Latency – the average round trip time for responses from that hop. This number typically increases as the number of hops increases.
- MTR – the results show reachability, loss, and latency for each hop between the WAN appliance's WAN IP and the destination.
- DNS – the QUESTION SECTION specifies what the lookup searches for, such as google.com's IP address, and the ANSWER SECTION provides the response. Multiple IP addresses for a single hostname are a normal load balancing technique. The query time indicates how long the response took to arrive.
- Throughput – the test returns a download speed for the transfer between dashboard and the WAN appliance.
- Blink LEDs – all front-panel LEDs blink in unison until you stop the tool.
- Reboot appliance – the appliance returns online within approximately 3 minutes and retains its configuration.
- Umbrella connectivity – the test reports whether the WAN appliance reaches the Cisco Umbrella cloud service.
Troubleshooting
Keep the following tool behaviors and limitations in mind when interpreting results:
-
DHCP leases does not track third-party servers. The tool shows only leases issued by the WAN appliance, not leases issued by a third-party DHCP server on the LAN. For more information, refer to Configuring DHCP Services on the MX.
-
Some hops do not appear in traceroute results. Devices such as firewalls may not respond to this type of test and will not appear in the results.
-
Traceroute uses UDP on newer firmware. WAN appliances running MX 16.X+ firmware use UDP traceroutes over UDP port 33447 instead of ICMP traceroutes when users initiate traceroutes with the traceroute tool.
-
MTR data can be difficult to interpret. Some hops likely will not respond to ICMP because they de-prioritize or drop ICMP traffic.
-
DNS uses the appliance's primary DNS server. The test does not use the DNS servers configured for DHCP, so results may differ from client-side lookups.
-
Throughput is not a traditional speed test. Do not use it to confirm the actual speed of an Internet link. Traffic generated during the test passes through potentially multiple ISPs to reach dashboard, which adds many additional points of contention that can reduce the throughput speed. To test the actual throughput of the Internet link, test from a whitelisted client wired directly to the WAN appliance and use a speed test service such as one provided by the ISP, SpeedOf.me, or Ookla.
-
Reboot is not a factory reset. A reboot clears caches and restarts ports and services while retaining the configuration.
-
Reboot in an HA pair affects one appliance. When the WAN appliance is in an HA pair, the Reboot WAN appliance button reboots only the current appliance, not both.