
Getting started on Packet Captures with Wireshark
By Chase Nebeker
Overview
Network troubleshooting can be difficult and time-consuming. Wireshark is a free and open-source program that helps narrow down network issues. Cisco Meraki provides ample opportunity to gather data through packet capture. This guide covers moderate to advanced Wireshark filters that help troubleshoot and narrow down network issues.
Wireshark can show that an issue is not network-related, but rather a server that is not responding to traffic it is being sent.
This guide can only scratch the surface of what can be done with Wireshark. If you need help interpreting captures, contact Meraki Support for assistance.
As of April 10, 2020, the current version of Wireshark <https://www.wireshark.org/download.html> is 3.2.3. This article is written based on this version.
Prerequisites
Before getting started, ensure you have the following:
-
Wireshark installed. Download the latest version from wireshark.org.
-
Access to the Meraki dashboard.
-
Filter Bar Color Indicators
Before applying any filters, understand what the filter bar colors indicate in Wireshark:
- Green: Filter syntax is correct
- Yellow: Proceed with caution — unexpected results may occur
- Red: Incorrect syntax or input — no results will be displayed
All Wireshark display filters are case sensitive and must be entered in lowercase. Always press Enter after modifying a filter to activate it.
Learn more with these free online training courses on the Meraki Learning Hub:
Step-by-step instructions
Step 1. Set up a packet capture
For more information on capturing traffic from different products, refer to the Packet Capture Overview article.
Start captures as close to the client or server as possible. Once you identify traffic patterns of interest, you can add different hops in between.
Captures from Meraki equipment may not display 100% of packets that pass through the device. The device prioritizes delivering packets over capturing them. If complete packet capture is required, use a port mirror on the switch or a network tap.
Step 2. Select the right interface
Selecting the correct interface is vital to ensure you capture the data you are looking for.
MX WAN appliance
-
Internet 1: Captures all traffic going out the Internet 1 link. This traffic will be NATed to the IP on that interface.
-
Internet 2: Captures all traffic going out the Internet 2 link. This traffic will be NATed to the IP on that interface.
-
LAN: Captures traffic sent and received on the LAN interface of the MX.
-
Site-to-Site VPN: Captures all Meraki site-to-site VPN traffic.
-
Site-to-Site VPN over Internet 1: Captures all Meraki site-to-site VPN traffic established on Internet 1. This interface is useful for determining whether SD-WAN preferences are working correctly.
-
Site-to-Site VPN over Internet 2: Captures all Meraki site-to-site VPN traffic established on Internet 2.
-
IPsec VPN: Captures all non-Meraki VPN traffic.
-
Client VPN: Captures all traffic sent and received over the Client VPN interface.
-
Cellular: Captures all traffic going out of an integrated or USB cellular link.
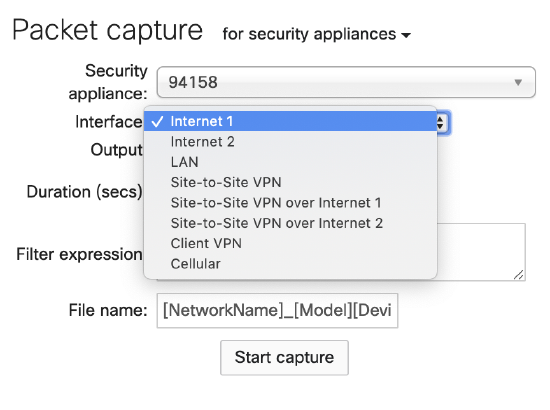
Some interfaces only appear if the corresponding feature is enabled, for example, Client VPN or site-to-site VPN.
MS switch
Switches allow you to select a specific switch and port to capture from. Select the switch and port that the device is plugged into.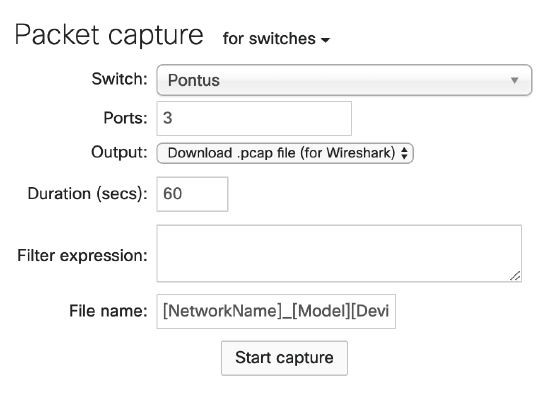
-
Navigate to Switching > Monitor > Switches and select the switch in question.
-
Select the port you wish to capture traffic on.
-
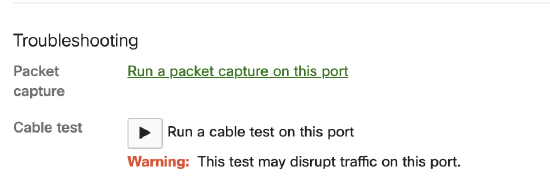
Under the Troubleshooting section, select Run a packet capture on this port.
MR access point
Access points default to All Access Points. Select the specific access point (AP) the client is connected to.
- Wired - Captures all traffic that is sent to the switch
- Wireless - Captures all traffic that is sent on the wireless radio
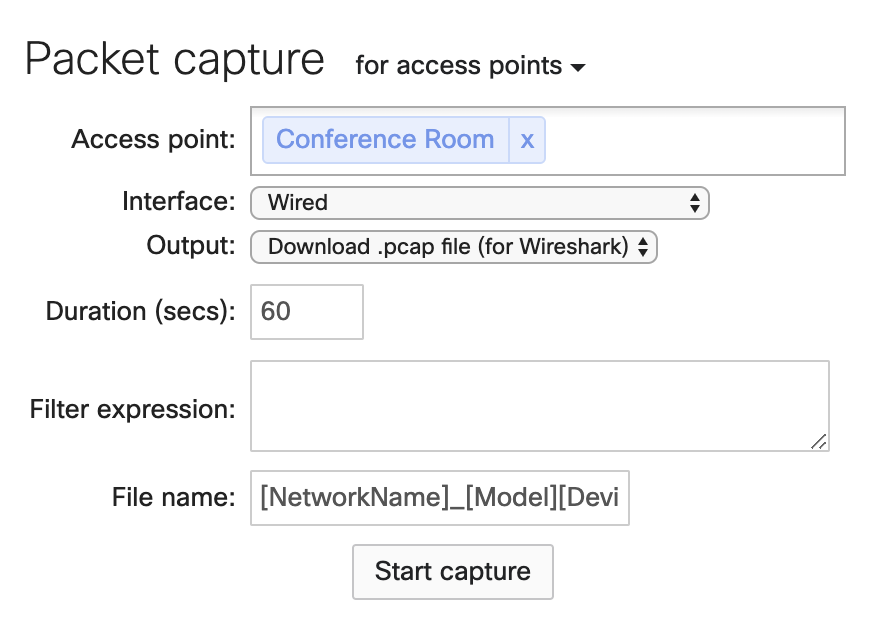
Capture only on the wired interface instead of the wireless interface. For capturing wireless traffic, refer to the Capturing Wireless Traffic from a Client Machine.
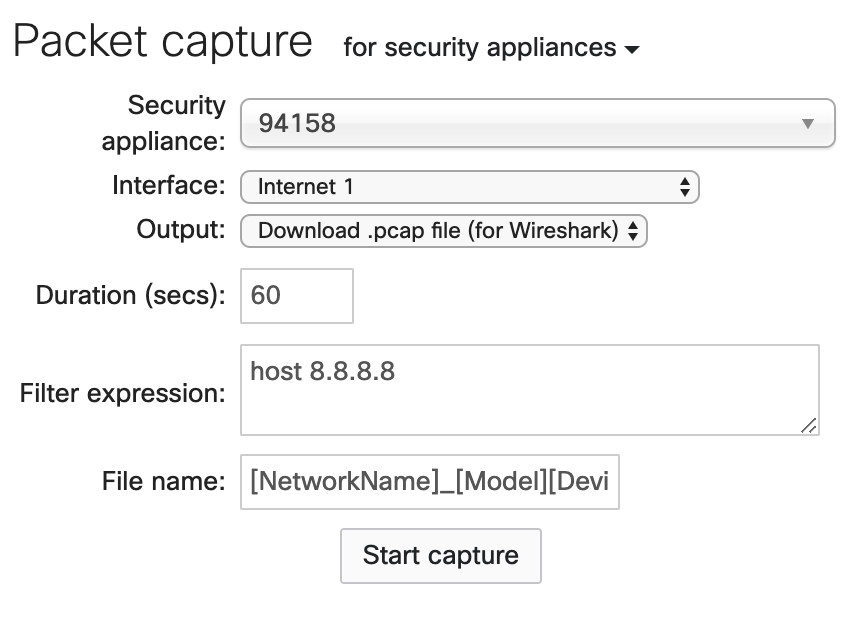
By default, packet captures will be saved with the name [NetworkName]_[Model][DeviceName]_IF-[Interface].pcap.
Step 3. Apply capture filters
Capture filters determine which packets the dashboard saves for download. Capture filters use a different syntax from display filters.
The capture filter only saves traffic that matches the specified criteria. If the filter is too narrow, the resulting capture may be empty.
General recommendations:
-
Keep capture filters as simple as possible.
-
For captures on the LAN side of the MX, use the computer's IP address.
-
For captures on the Internet interface, use the destination public IP address, as all traffic will be NATed to the MX uplink IP.
-
For all other captures, leave the filter blank and review traffic in Wireshark.
Example filters:
host 10.92.182.6 - will capture all data to and from the computer.
host 8.8.8.8 - will capture traffic going to the Google DNS server 8.8.8.8.
ether host 00:18:0a:aa:bb:cc - will only capture for a specific mac. This will not work on interfaces where traffic has been NATed like NAT mode SSID or an Internet interface.
Step 4. Apply display filters
Display filters are used within Wireshark to sort through captured traffic.
Protocol filters
The following protocol filters are commonly used:
-
tcp - will only display TCP packets
-
udp - will only display UDP packets
-
icmp - will only display ICMP (ping) packets
-
dhcp - will display DHCP packets (if you are using an old version of Wireshark you'll need to use bootp)
-
dns - will display DNS packets
Both tcp and udp can be extended even more to include the particular ports that are being used to communicate.
-
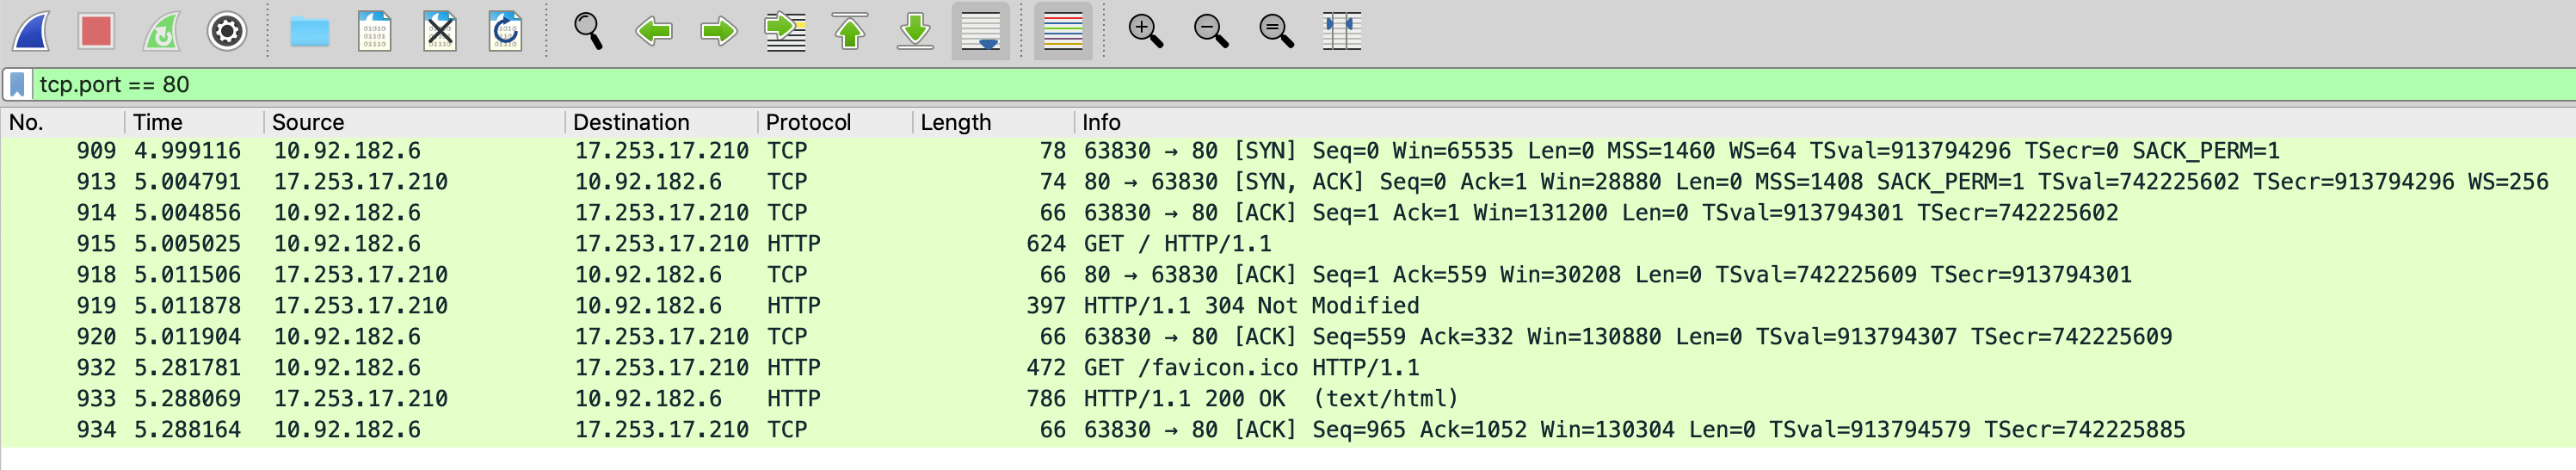
tcp.port == 80 - this will display un-encrypted TCP traffic on port 80.
-
tcp.port == 443 - this will only show encrypted TCP traffic using port 443.
-
udp.port == 53 - another way of specifying DNS traffic, this will filter off of DNS's use of UDP port 53.
Device filter
Use the following filters to identify what a particular IP address is communicating with:
ip.addr == 10.92.182.6 - will display frames that have 10.92.182.6 in either the source or destination field.
When reviewing communication between devices on the same VLAN, use filters based on the MAC address of the device. Be aware that when traffic passes a Layer 3 boundary, the MAC address changes. When capturing on the LAN, MAC address filters typically work correctly, but this may not always be the case.
eth.addr == 00:18:0a:aa:bb:cc - Display frames that have 00:18:0a:aa:bb:cc in the source or destination field.
ip.addr == 10.92.182.6 - will display frames that have 10.92.182.6 in either the source or destination field.
Logical operators
Use logical operators to combine protocol and device filters for more granular data:
-
and - this will combine two (or more) filters together, which will only display results if all of the statements are true.
Example: ip.addr == 10.92.182.6 and dns - will only show the host 10.92.182.6 and it's DNS traffic.
-
or - this will combine two (or more) filters together, displaying results if either one of the statements are true.
Example: ip.addr == 10.92.182.6 or ip.addr == 172.16.7.7 - is going to display both 10.92.182.6 as well as 172.16.7.7
-
not - Exclude specific elements from the filter.
Example: not ip.addr == 172.16.7.7 - is going to exclude all traffic that has an IP of 172.16.7.7
-
() - parentheses can be used to combine elements together. Just like in math, the order of operations matters. () allows using both and with or in the same statement.
Example: (ip.addr == 172.16.7.42 or ip.addr == 172.16.7.7) and dns - Displays DNS traffic for 172.16.7.42 OR 172.16.7.7
Example: (ip.addr == 172.16.7.42 and dns) or (172.16.7.7 and icmp) - here the parentheses are being used to combine two completely different filters. Displays DNS traffic for 172.16.7.42 and icmp traffic for 172.16.7.7.
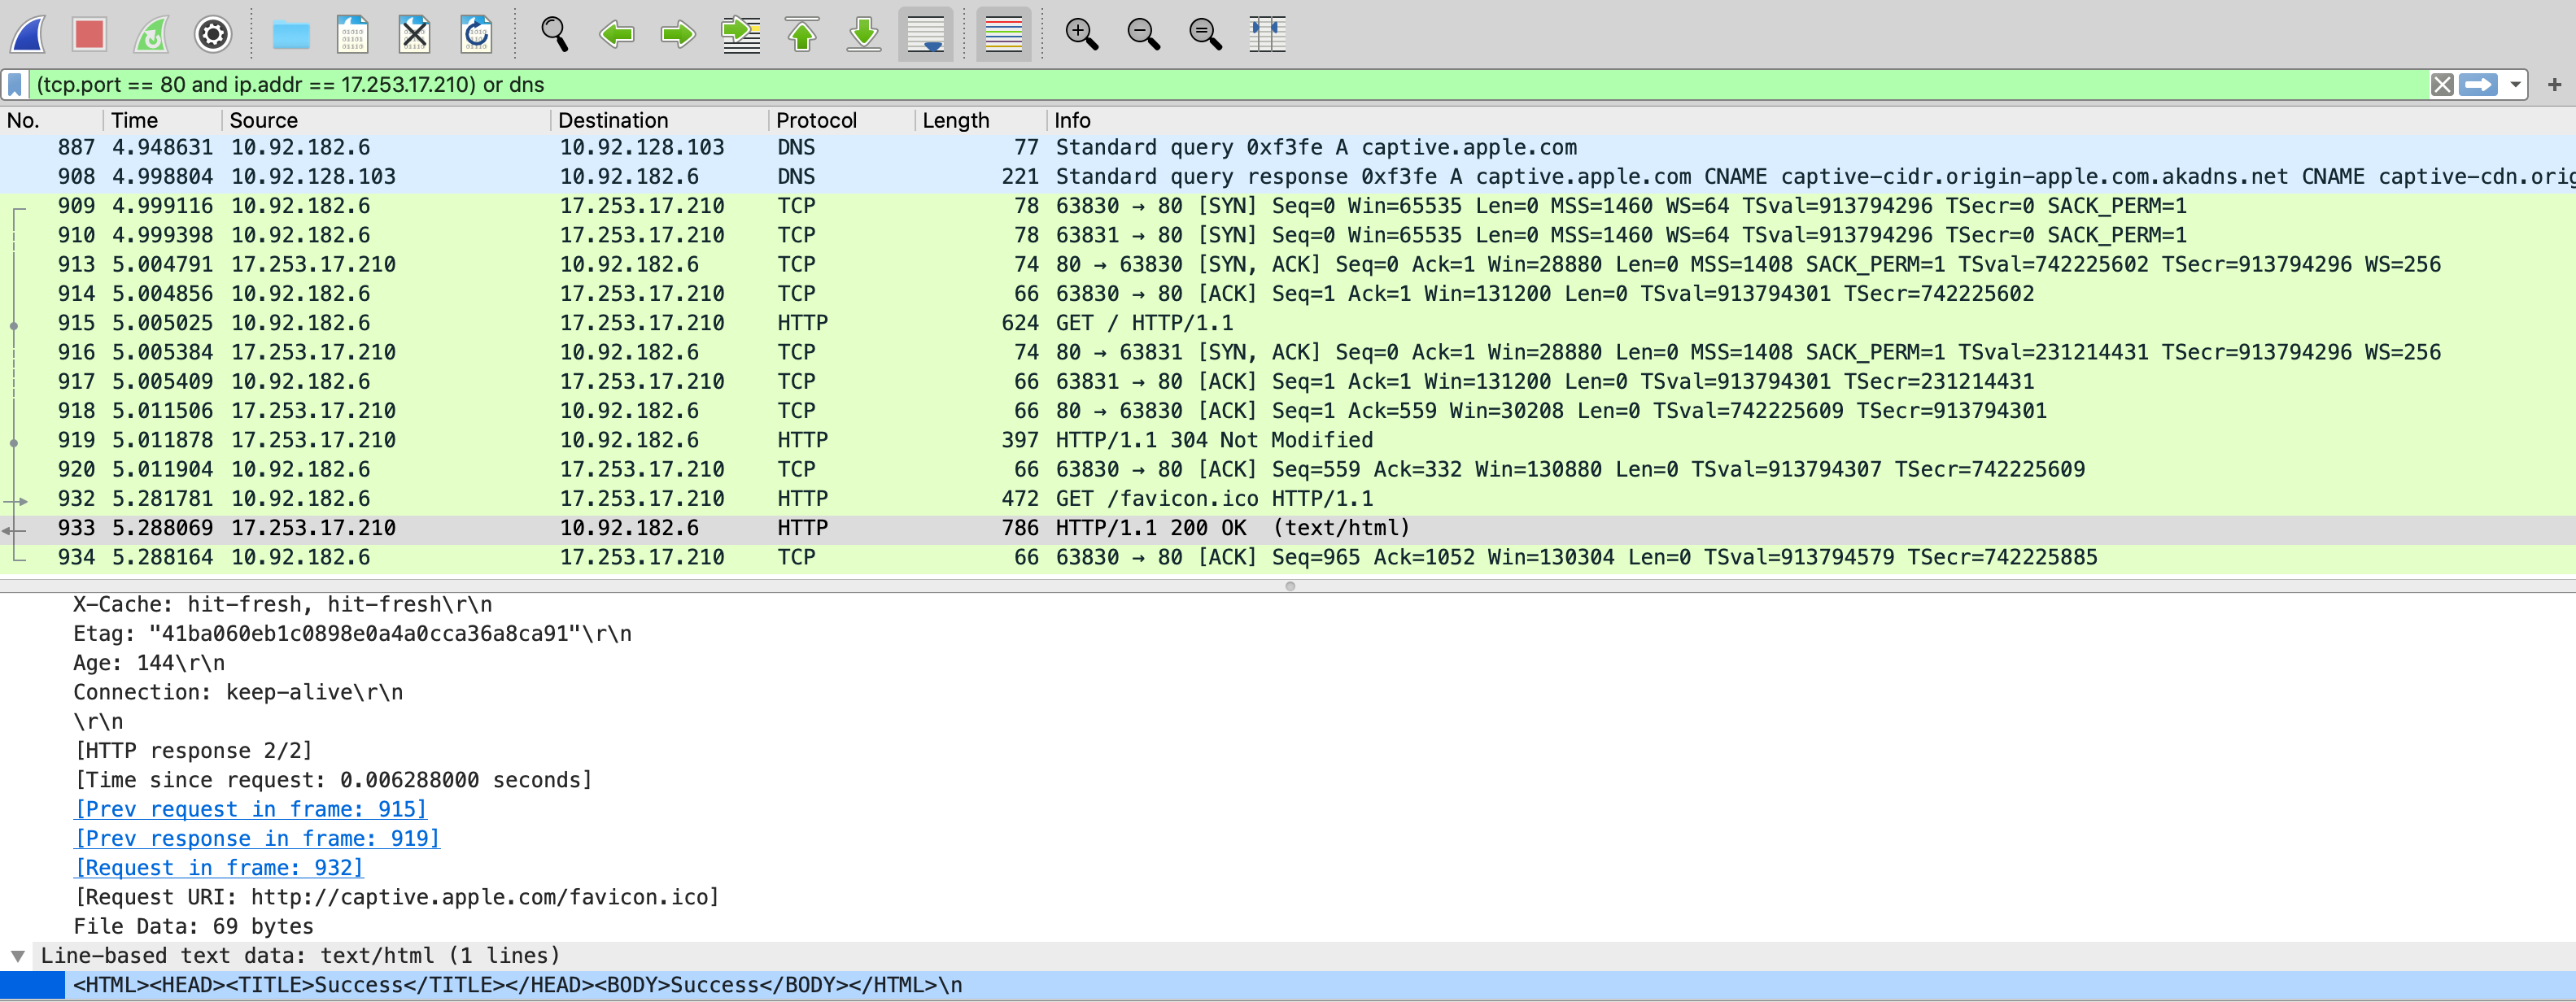
Example: Finding communication with captive.apple.com
The following example shows how to find communication between a computer and captive.apple.com. The computer performs a DNS query for captive.apple.com with a reply from the DNS server.
The filter tcp.port == 80 and ip.addr == 17.253.17.210 is going to find everything on TCP port 80 going to the IP of 17.253.17.210.
Troubleshooting
Web traffic
When filtering for web traffic, refer to the Using Chrome Devtools with Wireshark article. Filtering by the specific source port displays the TCP connection you want to investigate.
DHCP issues
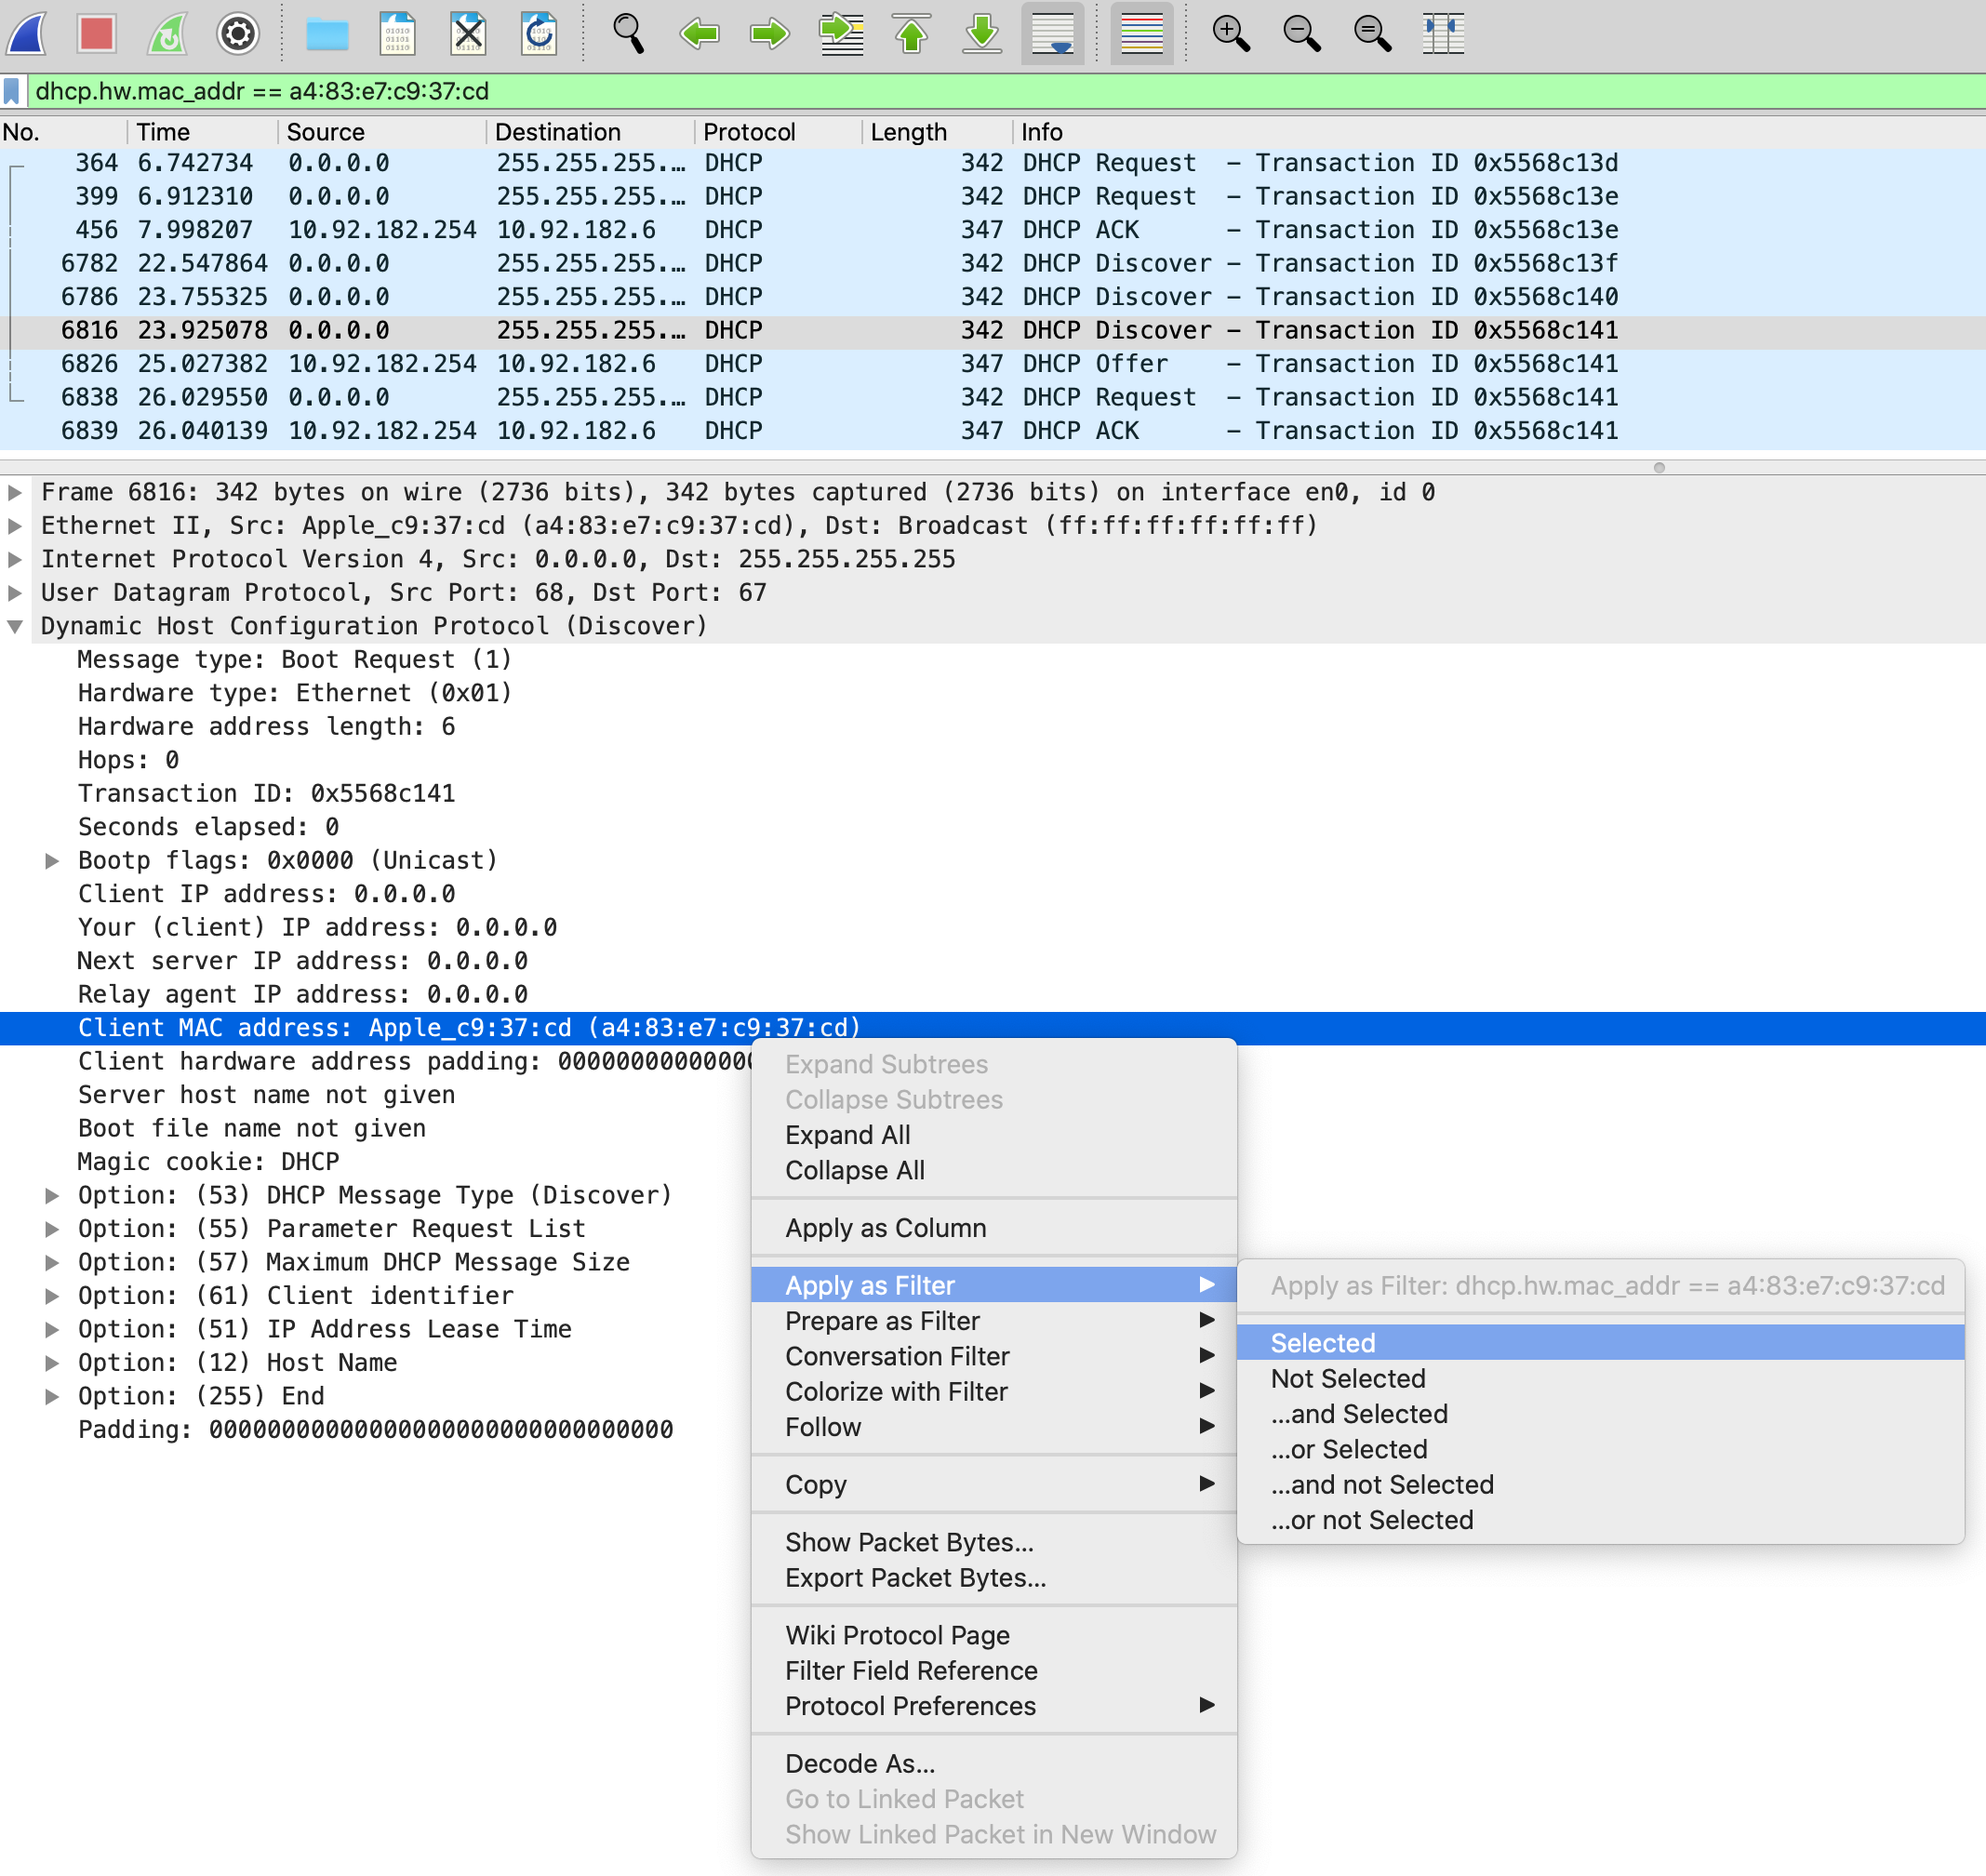
When troubleshooting DHCP problems, use the following filter to see all attempts by a client to obtain an IP address. Filtering by MAC address and DHCP alone may not show all traffic due to the way DHCP works.
dhcp.hw.mac_addr == a4:83:e7:c9:37:cd
Look for the full DORA sequence:
-
Discover
-
Offer
-
Request
-
Ack
In the packet details, right-click any field and select Apply as Filter > Selected to quickly create a filter. You can also filter by Transaction ID to isolate a specific DHCP exchange. The Transaction ID is visible in the Info column and is the same across all four DORA packets.
Following a TCP stream
Right-click a packet and select Follow TCP Stream to display only the packets belonging to that specific TCP connection. 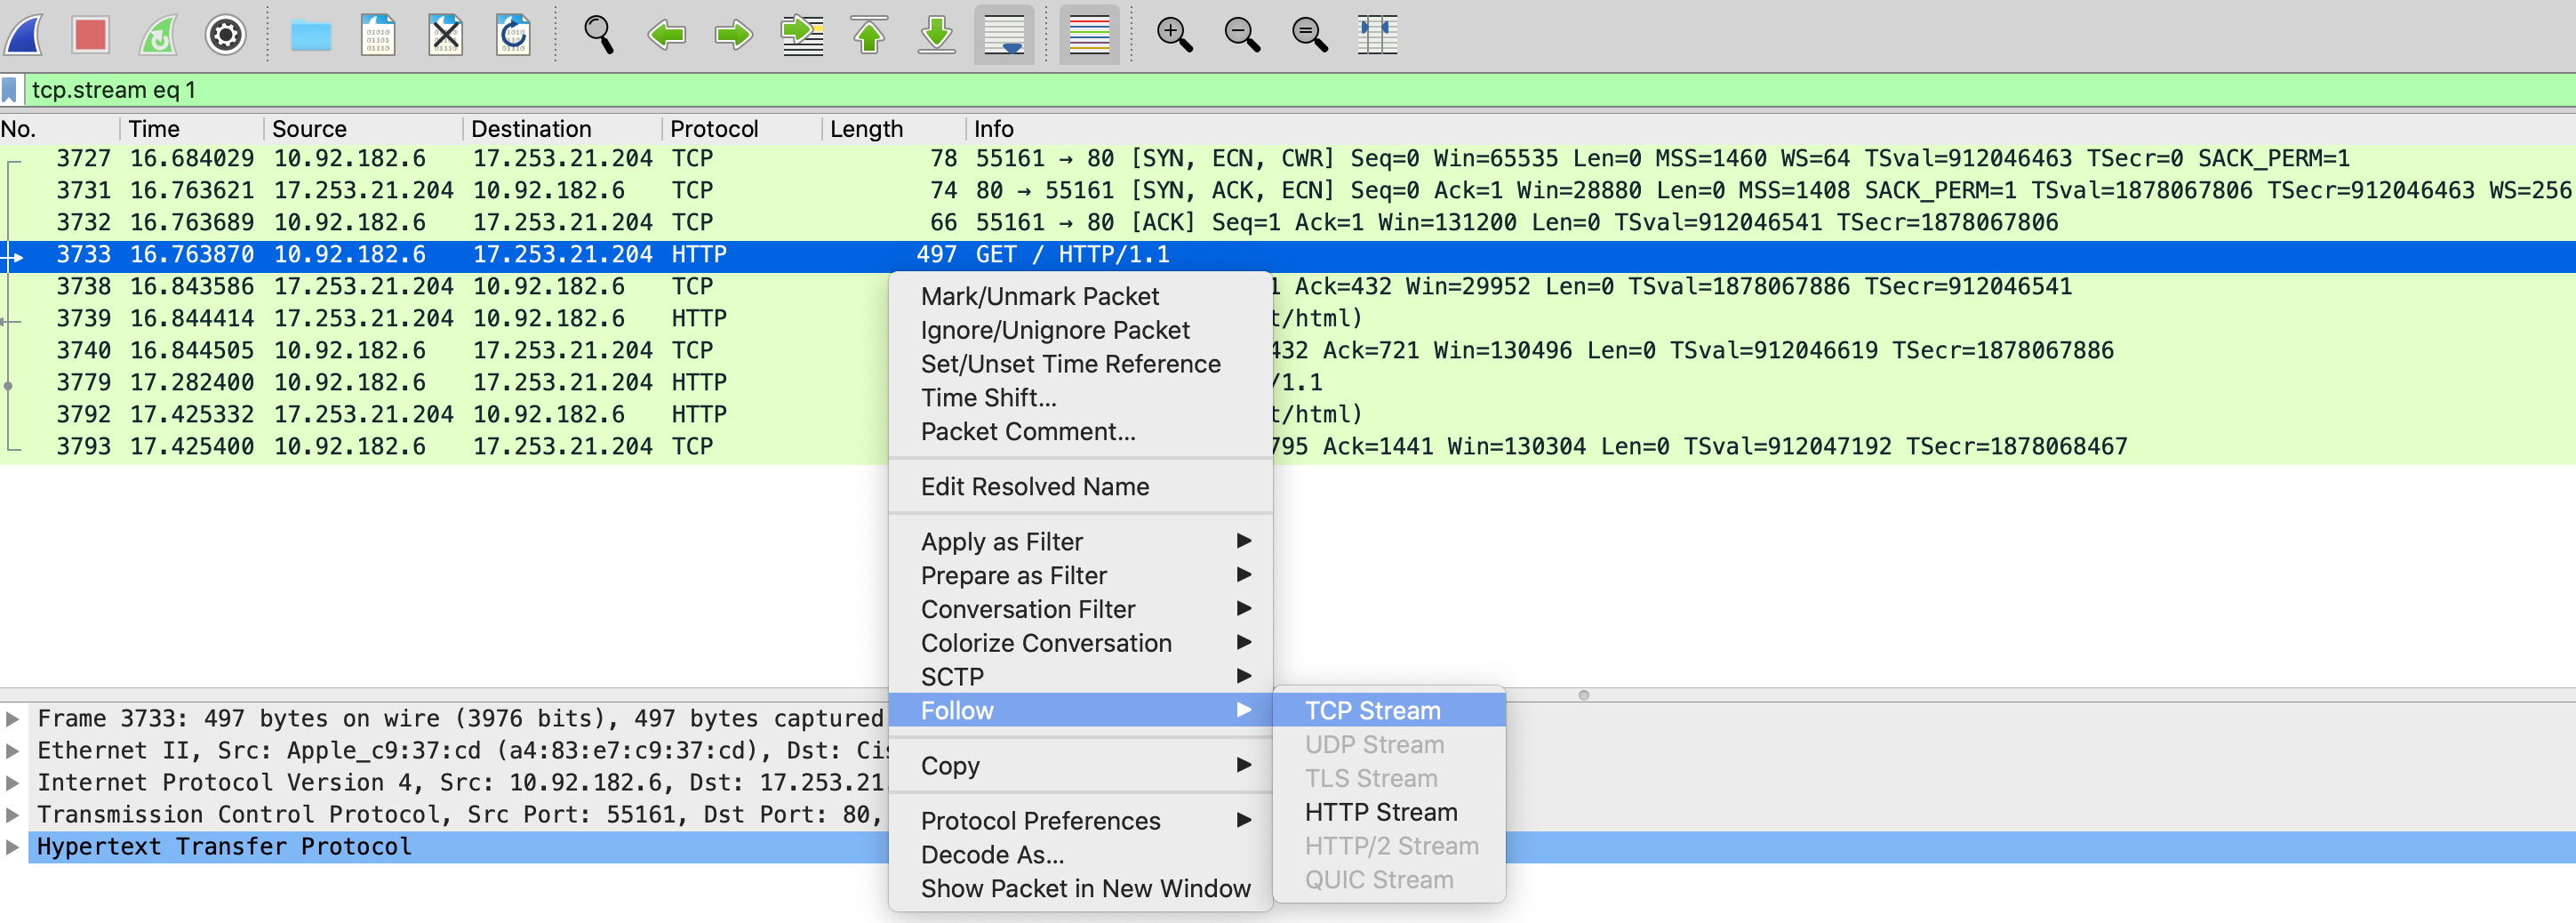
Unanswered DNS queries
Use the following filter to identify DNS queries that did not receive a response. Wireshark tracks which frame a DNS reply is received on. The filter combines the absence of a recorded reply with a check for outbound DNS queries only.
!dns.response_in and dns.flags.response == 0 and dns
Additional resources
The following resources are not officially endorsed by Cisco Meraki.
-
http://packetlife.net/media/library/...ay_Filters.pdf is a handy cheat sheet for other display filters that can be used.
- http://packetlife.net/media/library/12/tcpdump.pdf is a handy cheat sheet for other capture filters that can be used.
- Sharkfest is an annual Wireshark conference with advanced instruction sessions on using Wireshark. Many of the examples here are explained much more in-depth in this video.
- https://blog.packet-foo.com/