
Cloud Monitoring for Catalyst Onboarding
Cloud Monitoring for Catalyst is no longer available for new devices. Organizations with existing devices can continue to use Cloud Monitoring until March 31, 2026. For more details, see Cloud Monitoring End of Service - Transition to Cloud-Native IOS XE.
Cloud Monitoring functionality has been replaced by cloud management with device configuration, an enhanced solution with new features. We recommend upgrading to cloud management with device configuration as soon as possible.
Cloud Monitoring for Catalyst is no longer available to new organizations. Existing organizations can continue to use Cloud Monitoring.
Cloud Monitoring functionality has been replaced by hybrid mode, an enhanced solution with new features.
For more details, see Cloud Monitoring End of Life - Transition to Cloud-Native IOS XE.
This guide is for Cloud Monitoring for Catalyst Switches. See Connecting Catalyst 9800 Wireless Controller to Dashboard for details on how to connect Catalyst 9800 wireless controllers to dashboard and Adding Catalyst 9800 Wireless Controller and Access Points to Dashboard to add them to the Meraki dashboard.
Onboarding is the process of enabling cloud-monitoring functionality for an existing Catalyst switch. For background information regarding cloud monitoring for Catalyst, please refer to Cloud Monitoring Overview and FAQ.
Learn more with these free online training courses on the Meraki Learning Hub:
Eligible Catalyst Devices
Cloud monitoring for Catalyst currently supports the following hardware and software:
-
Catalyst 9200 series switches (including 9200L and 9200CX models).
-
Catalyst 9300 series switches (including 9300L and 9300X models).
-
Catalyst 9500 series switches.
-
Catalyst 9300 and 9500 series switches require at least 2.5 GB of free space.
-
The full list of supported Catalyst switches is available at Supported Catalyst 9000 Series Switches (Cloud Monitoring).
-
IOS-XE 17.3 - 17.10.1 (if an upgrade is needed, download is available at Cisco Software Downloads page).
-
IOS-XE 17.12.3 - 17.12.4
To enable cloud monitoring for Catalyst, the Catalyst device must be connected to, registered and provisioned by the Meraki dashboard. The Cloud Monitoring Onboarding application was created to facilitate this process. This application will help configure your Catalyst device to establish a TLS connection to the Cisco cloud infrastructure and register it to your dashboard organization. To utilize Cloud Monitoring, all Catalyst switches that will be added to the dashboard must have an active DNA Essentials or DNA Advantage license. From there, dashboard will configure the necessary services on your Catalyst device to enable cloud monitoring. See Cloud Monitoring Detailed Device Configurations for additional details.
NOTE: Devices labeled with -M such as the C9300-M do not need to be onboarded. They can be claimed like any Meraki device using the Meraki Serial number which is labeled as Cloud ID physically on the device
Pre-Onboarding
-
Confirm that the switch(es) designated for onboarding are one of the following:
-
Catalyst 9200, 9300, or 9500 series hardware.
-
Running IOS-XE 17.3 - 17.10.1
-
Running IOS-XE 17.12.3 - 17.12.4
IOS-XE upgrade instructions and release notes: Release Notes for Cisco Catalyst 9300 Series Switches
Current recommended IOS-XE release information can be found at: Recommended Releases for Catalyst 9200/9300/9400/9500/9600 and Catalyst 3650/3850 Platforms
A full list of supported hardware can be found at: Supported Catalyst 9000 Series Switches (Cloud Monitoring)
- Have access to the Meraki dashboard:
-
Verify the ability to log in to the dashboard.
-
Or create a free account. Instructions are available at: Creating a dashboard Account and Organization.
-
From My Profile, choose Generate new API key or use an existing key. Note that a full admin account must be used. SAML log-in is not supported for API key creation.
- The API key must have full read/write access for the organization to which switches will be onboarded.
- Additional documentation regarding enabling API access is available at Cisco Meraki Dashboard API: Enable API Access.
If an "invalid API key" error message appears, confirm the key and try again. API keys may take up to 15 minutes to become active in the onboarding application after creation.
-
The computer from which the onboarding application is run must be able to reach api.meraki.com and meraki-cloud-monitoring-onboarding-app.s3.amazonaws.com on TCP port 443.
-
Version updates for the application are automatically checked at meraki-cloud-monitoring-onboarding-app.s3.amazonaws.com.
-
The onboarding application is a stand-alone executable file; security settings on your local device must permit running this application and accessing the indicated hostnames above.
-
HTTPS proxy servers that modify the certificate in transit are not currently supported.
-
-
The Catalyst devices to onboard need access to the Cisco cloud:
-
Ensure any firewall rules in place allow communication with the gateway corresponding with the dashboard region on TCP port 443:
-
Americas: us.tlsgw.meraki.com.
-
EMEA: eu.tlsgw.meraki.com.
-
Asia Pacific and Japan: ap.tlsgw.meraki.com.
-
When translating ports through a firewall, the connection to the TLS gateway must be sourced from ephemeral ports TCP 1024 and above.
-
-
-
Telnet required for connectivity pre-check:
-
The onboarding application will test connectivity to the regional gateway on TCP 443 using a Telnet connection from the switch CLI, for example telnet us.tlsgw.meraki.com 443.
-
This requires that the "line vty" section of the configuration allows outgoing Telnet connections from the switch. The "transport output" line must contain "telnet" or "all" to allow this check to succeed.
-
- HTTPS proxies to access the API endpoint and the TLS gateway are not currently supported. If necessary, ensure rules are in place to allow direct HTTPS connections to each.
- Connectivity must be via a front-panel port (not the management interface).
- Only the default VRF is supported.
- Ensure routes are in place to reach external addresses including a default route (use of ip default-gateway is not supported).
- IP routing (ip routing) must be enabled on the switch or will be enabled as part of onboarding.
- Ensure DNS is enabled on the switch (ip name-server {DNS server IP} configured).
- Ensure DNS lookup is enabled (ip domain lookup).
- NTP needs to be enabled on the switch (ntp server {address}), and the switch clock must reflect the correct time.
- AAA on the switch must be configured using aaa new-model.
- RADIUS authentication is not currently supported.
- SSH access to the switch CLI must be enabled and accessible via the computer used for onboarding.
- The user account for onboarding must have privilege-15 level access on the switch.
- Determine which dashboard networks to put onboarded switches into:
- The network must be "switch" or "combined" type (Note: if "combined" then it must already include a "switch" network).
- If not already configured as such, the onboarding process will automatically enable "Unique Client Identifier" tracking method for that network.
- See Client-Tracking in IOS-XE for the further information on Device Tracking in Cloud Monitoring.
Information about creating a new network is available at: https://documentation.meraki.com/General_Administration/Organizations_and_Networks/Creating_and_Deleting_Dashboard_Networks#Creating_a_Network
When the tracking method is changed, clients may appear to be duplicated until previously collected data ages out and is no longer valid. For more information, see: https://documentation.meraki.com/MX/Monitoring_and_Reporting/Client-Tracking_Options.
- Back up the current running configuration on the switch prior to beginning onboarding (i.e., copy run flash:config-backup.txt).
Downloading the Onboarding Application
The onboarding application is no longer available for download. If your organization was not added to Cloud Monitoring prior to May 1, 2025, this solution is no longer accessible. Instead, we encourage you to explore our new offering and select "device configuration" during the onboarding process.
Organizations added before this date may continue onboarding devices using their existing app download until November 1, 2025. For more information and important upcoming dates, please refer to the End of Service Announcement.
Onboarding
In order for a Catalyst device to be recognized and added to dashboard, that device must go through onboarding. The Onboarding application will assist in verifying device compatibility and connectivity, configure the device to build a secure TLS tunnel connection to the Cisco cloud infrastructure, and initiate registration to your dashboard organization. Once registered on dashboard all further configuration and updates to support cloud monitoring functions will be managed by dashboard and communicated to the device through the secure tunnel. See the section Onboarding Configuration Changes for additional details.
Note, once onboarded and as long as that device has an active TLS connection to the Cisco Meraki cloud infrastructure, it no longer needs the Onboarding application. Additional changes, features, or fixes will be managed by dashboard through the secure tunnel. Only if the TLS configuration were modified will you need to re-onboard that device.
Using the Onboarding Application
The onboarding tool is a stand-alone application that runs natively on Windows, MacOS, or Linux. If running on Linux, note that this is a GUI application, and a CLI version is not currently available.
We recommend making a backup of your existing running configuration on switches before making any changes.
Upon launching the onboarding application, it will automatically check and download the latest version. First-time users will also need to read and accept the terms and conditions for this cloud service.
On the main page, paste in the API key that you previously copied from the dashboard (refer to the checklist above if you do not have this saved).
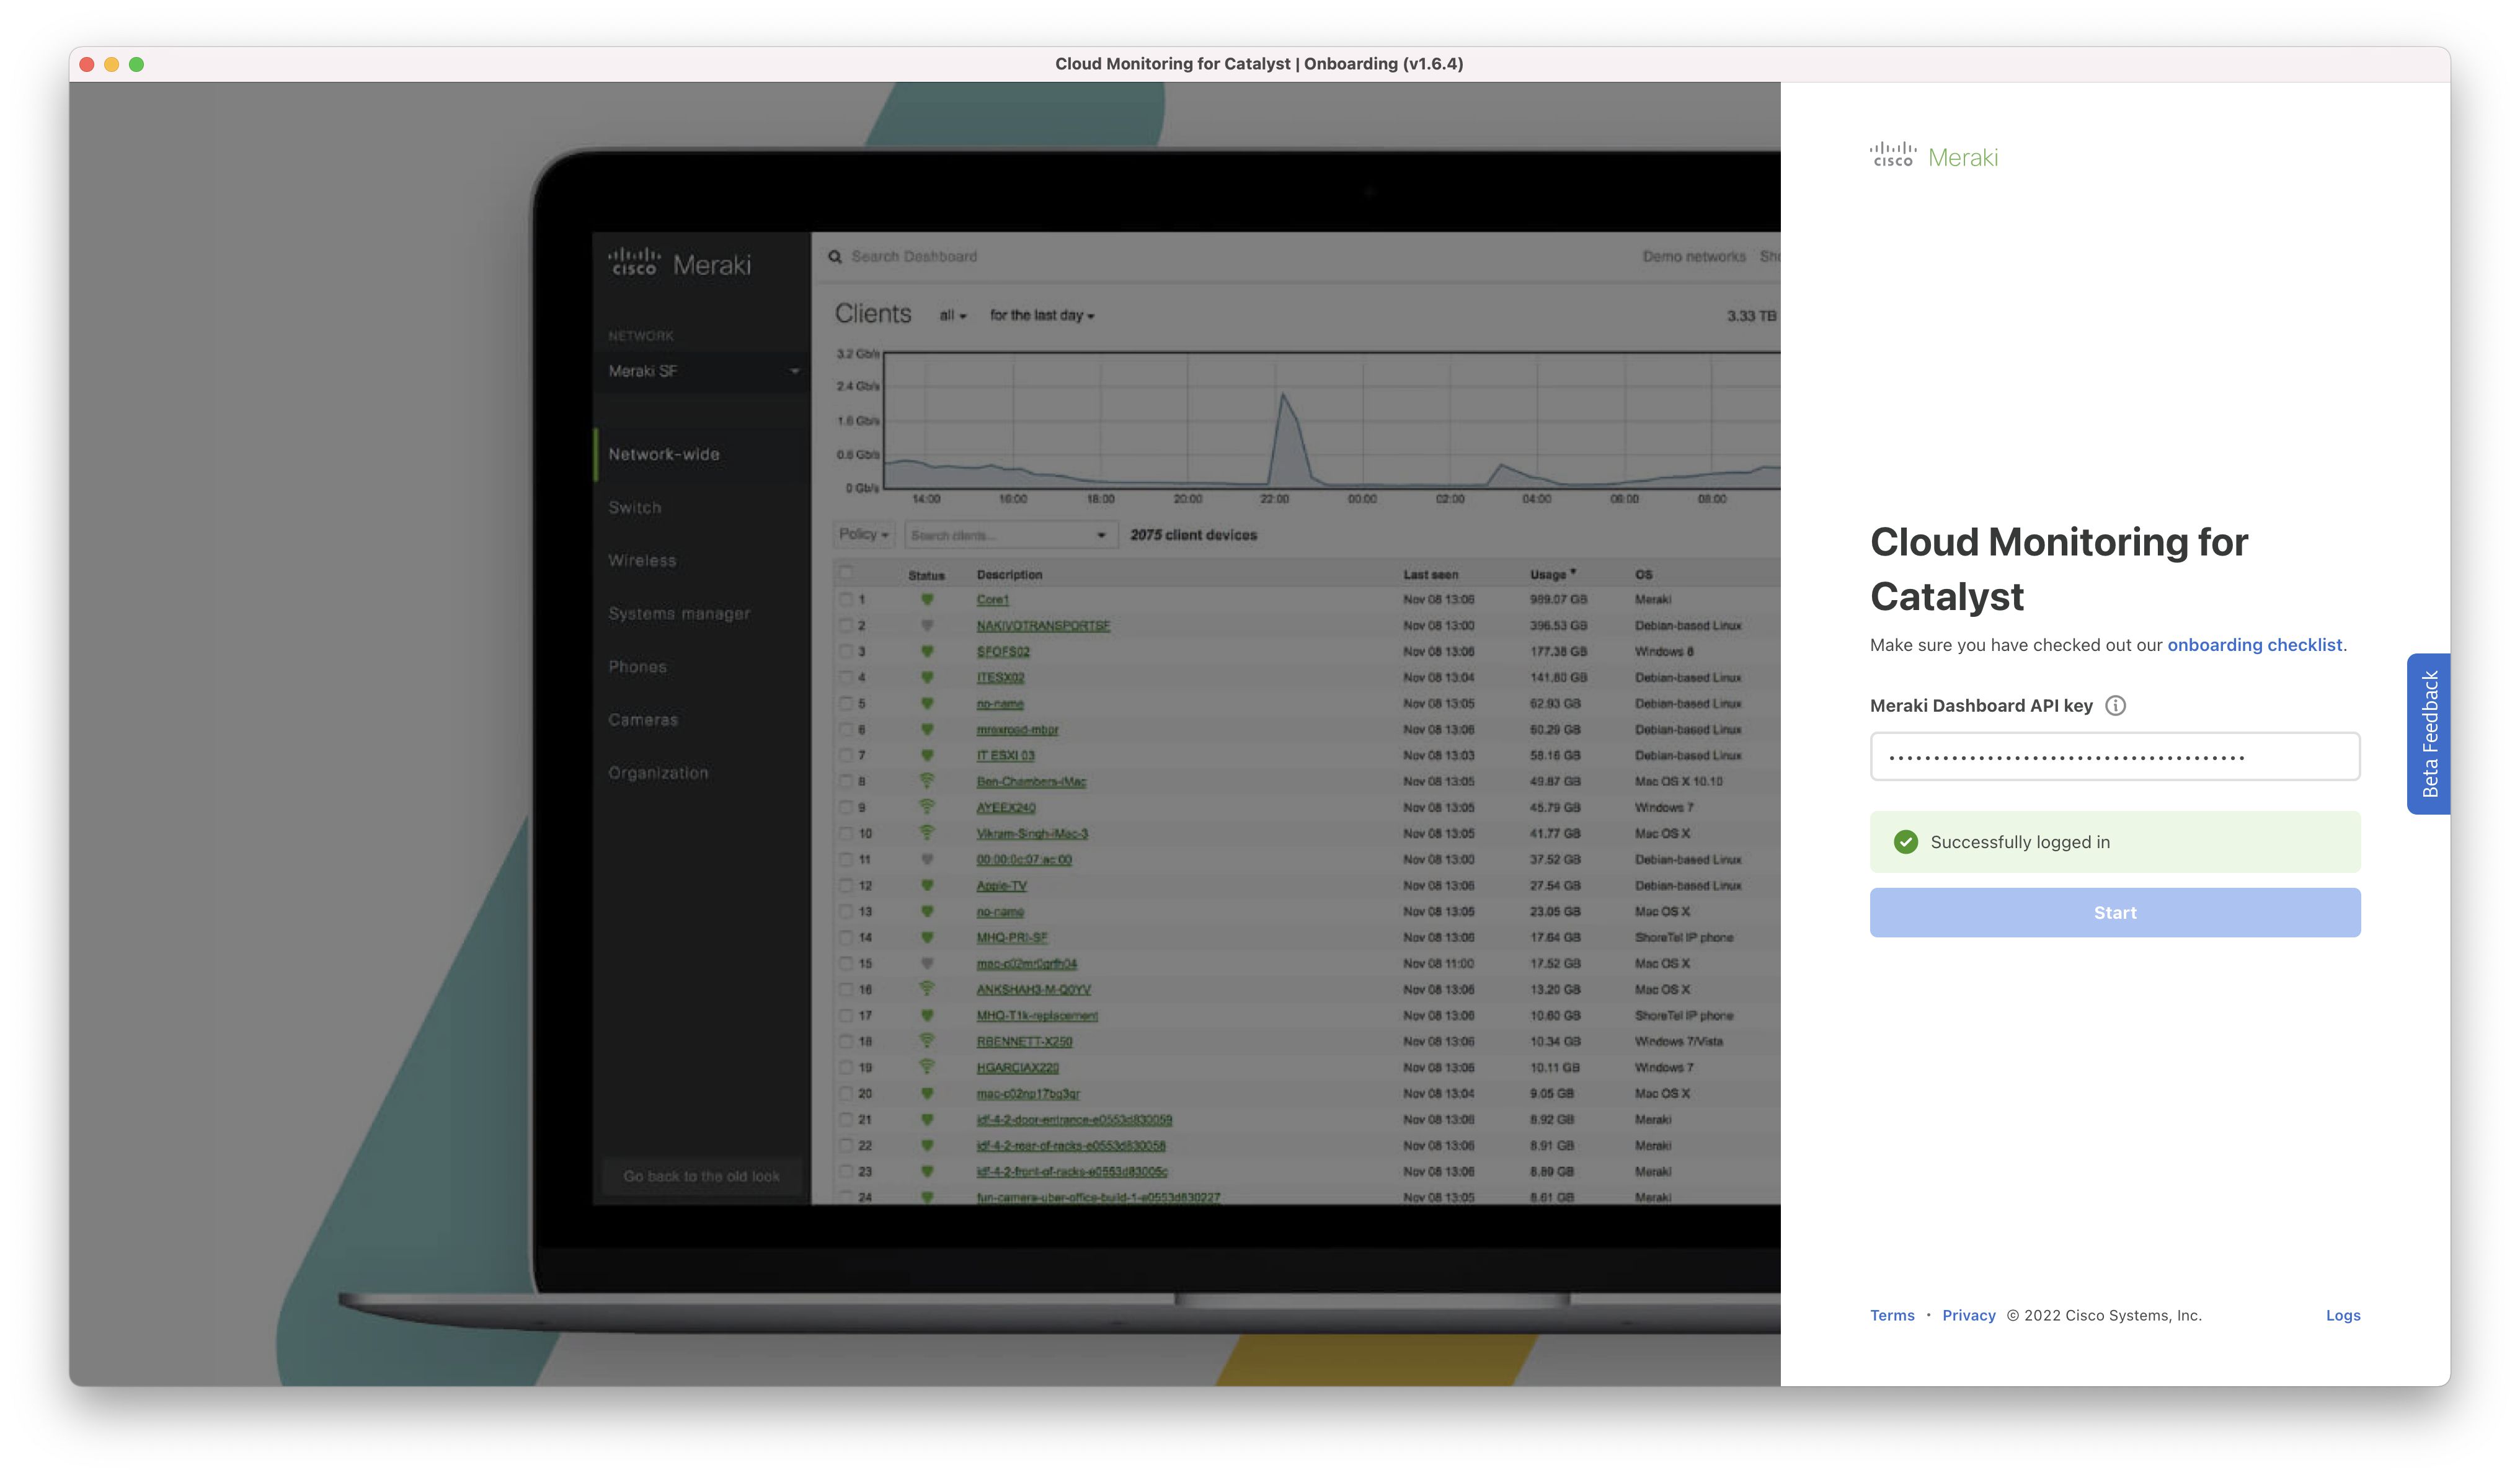
To continue, a valid dashboard API key from an account with write access must be entered.
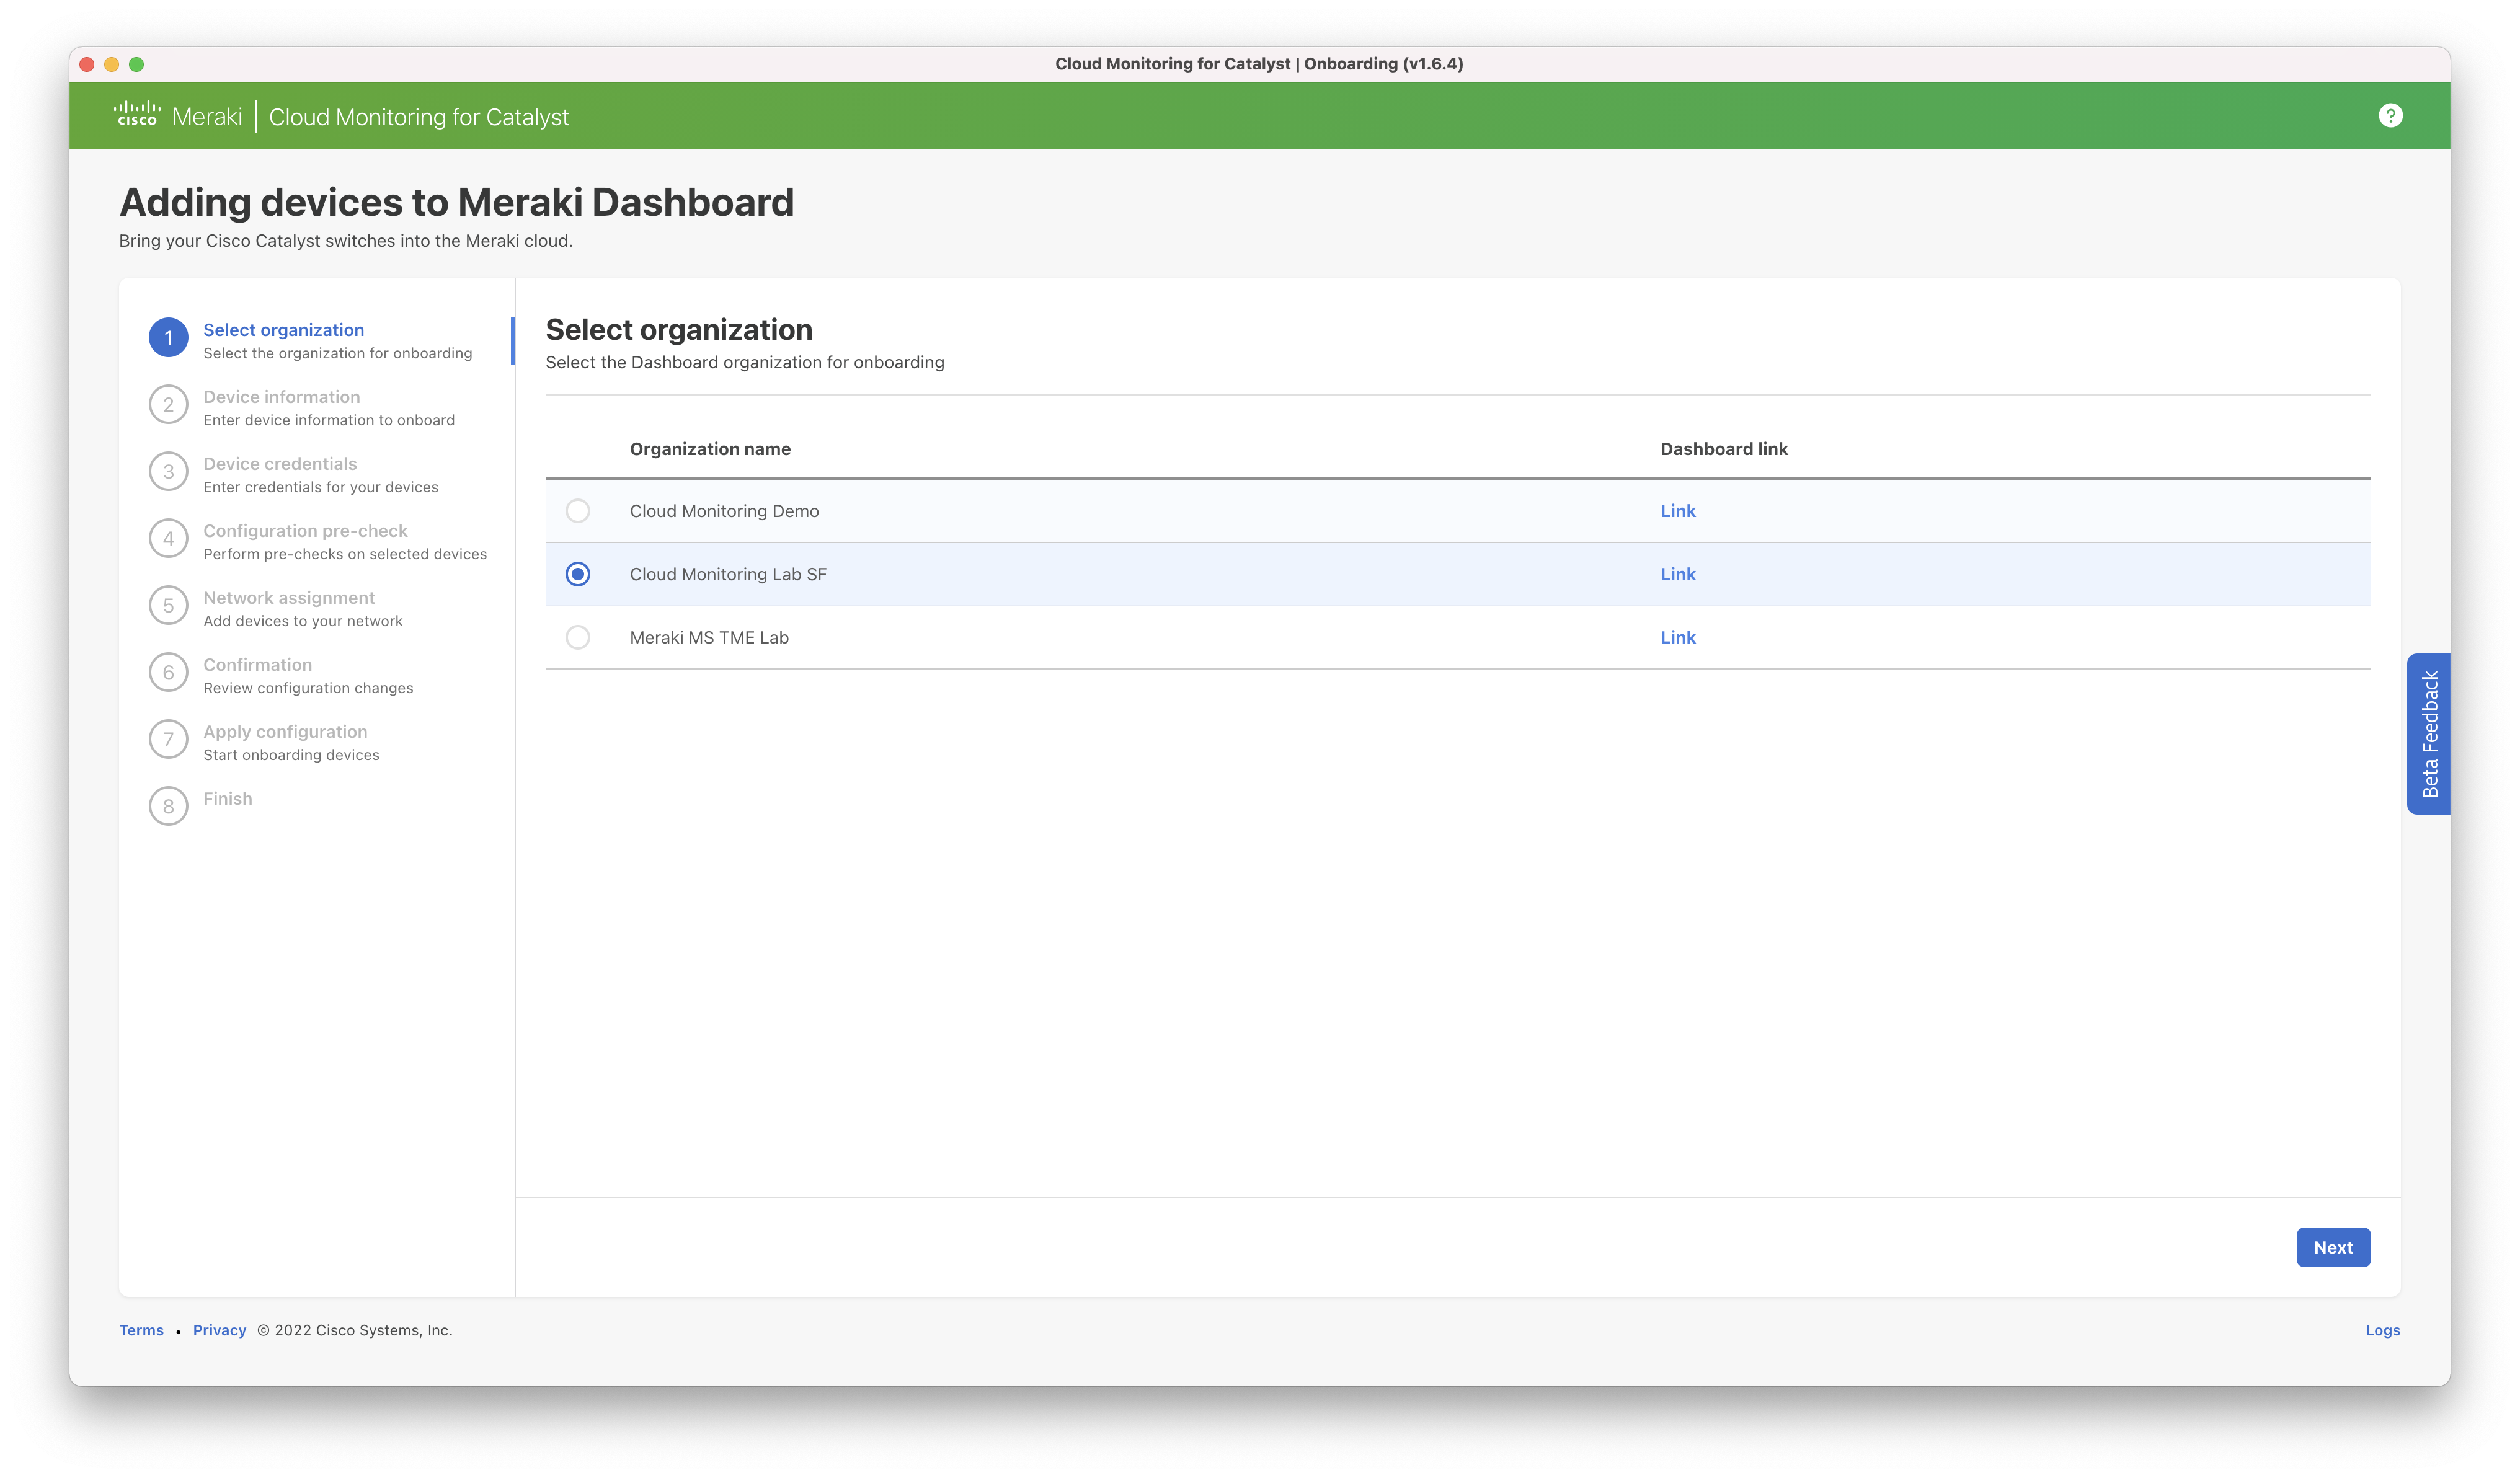
Step 1: Confirm the organization associated with the API key the switch(es) should be added to. The link can be used to access the dashboard for that organization. If you have multiple organizations you wish to onboard switches to, you will need to run the app separately for each organization.
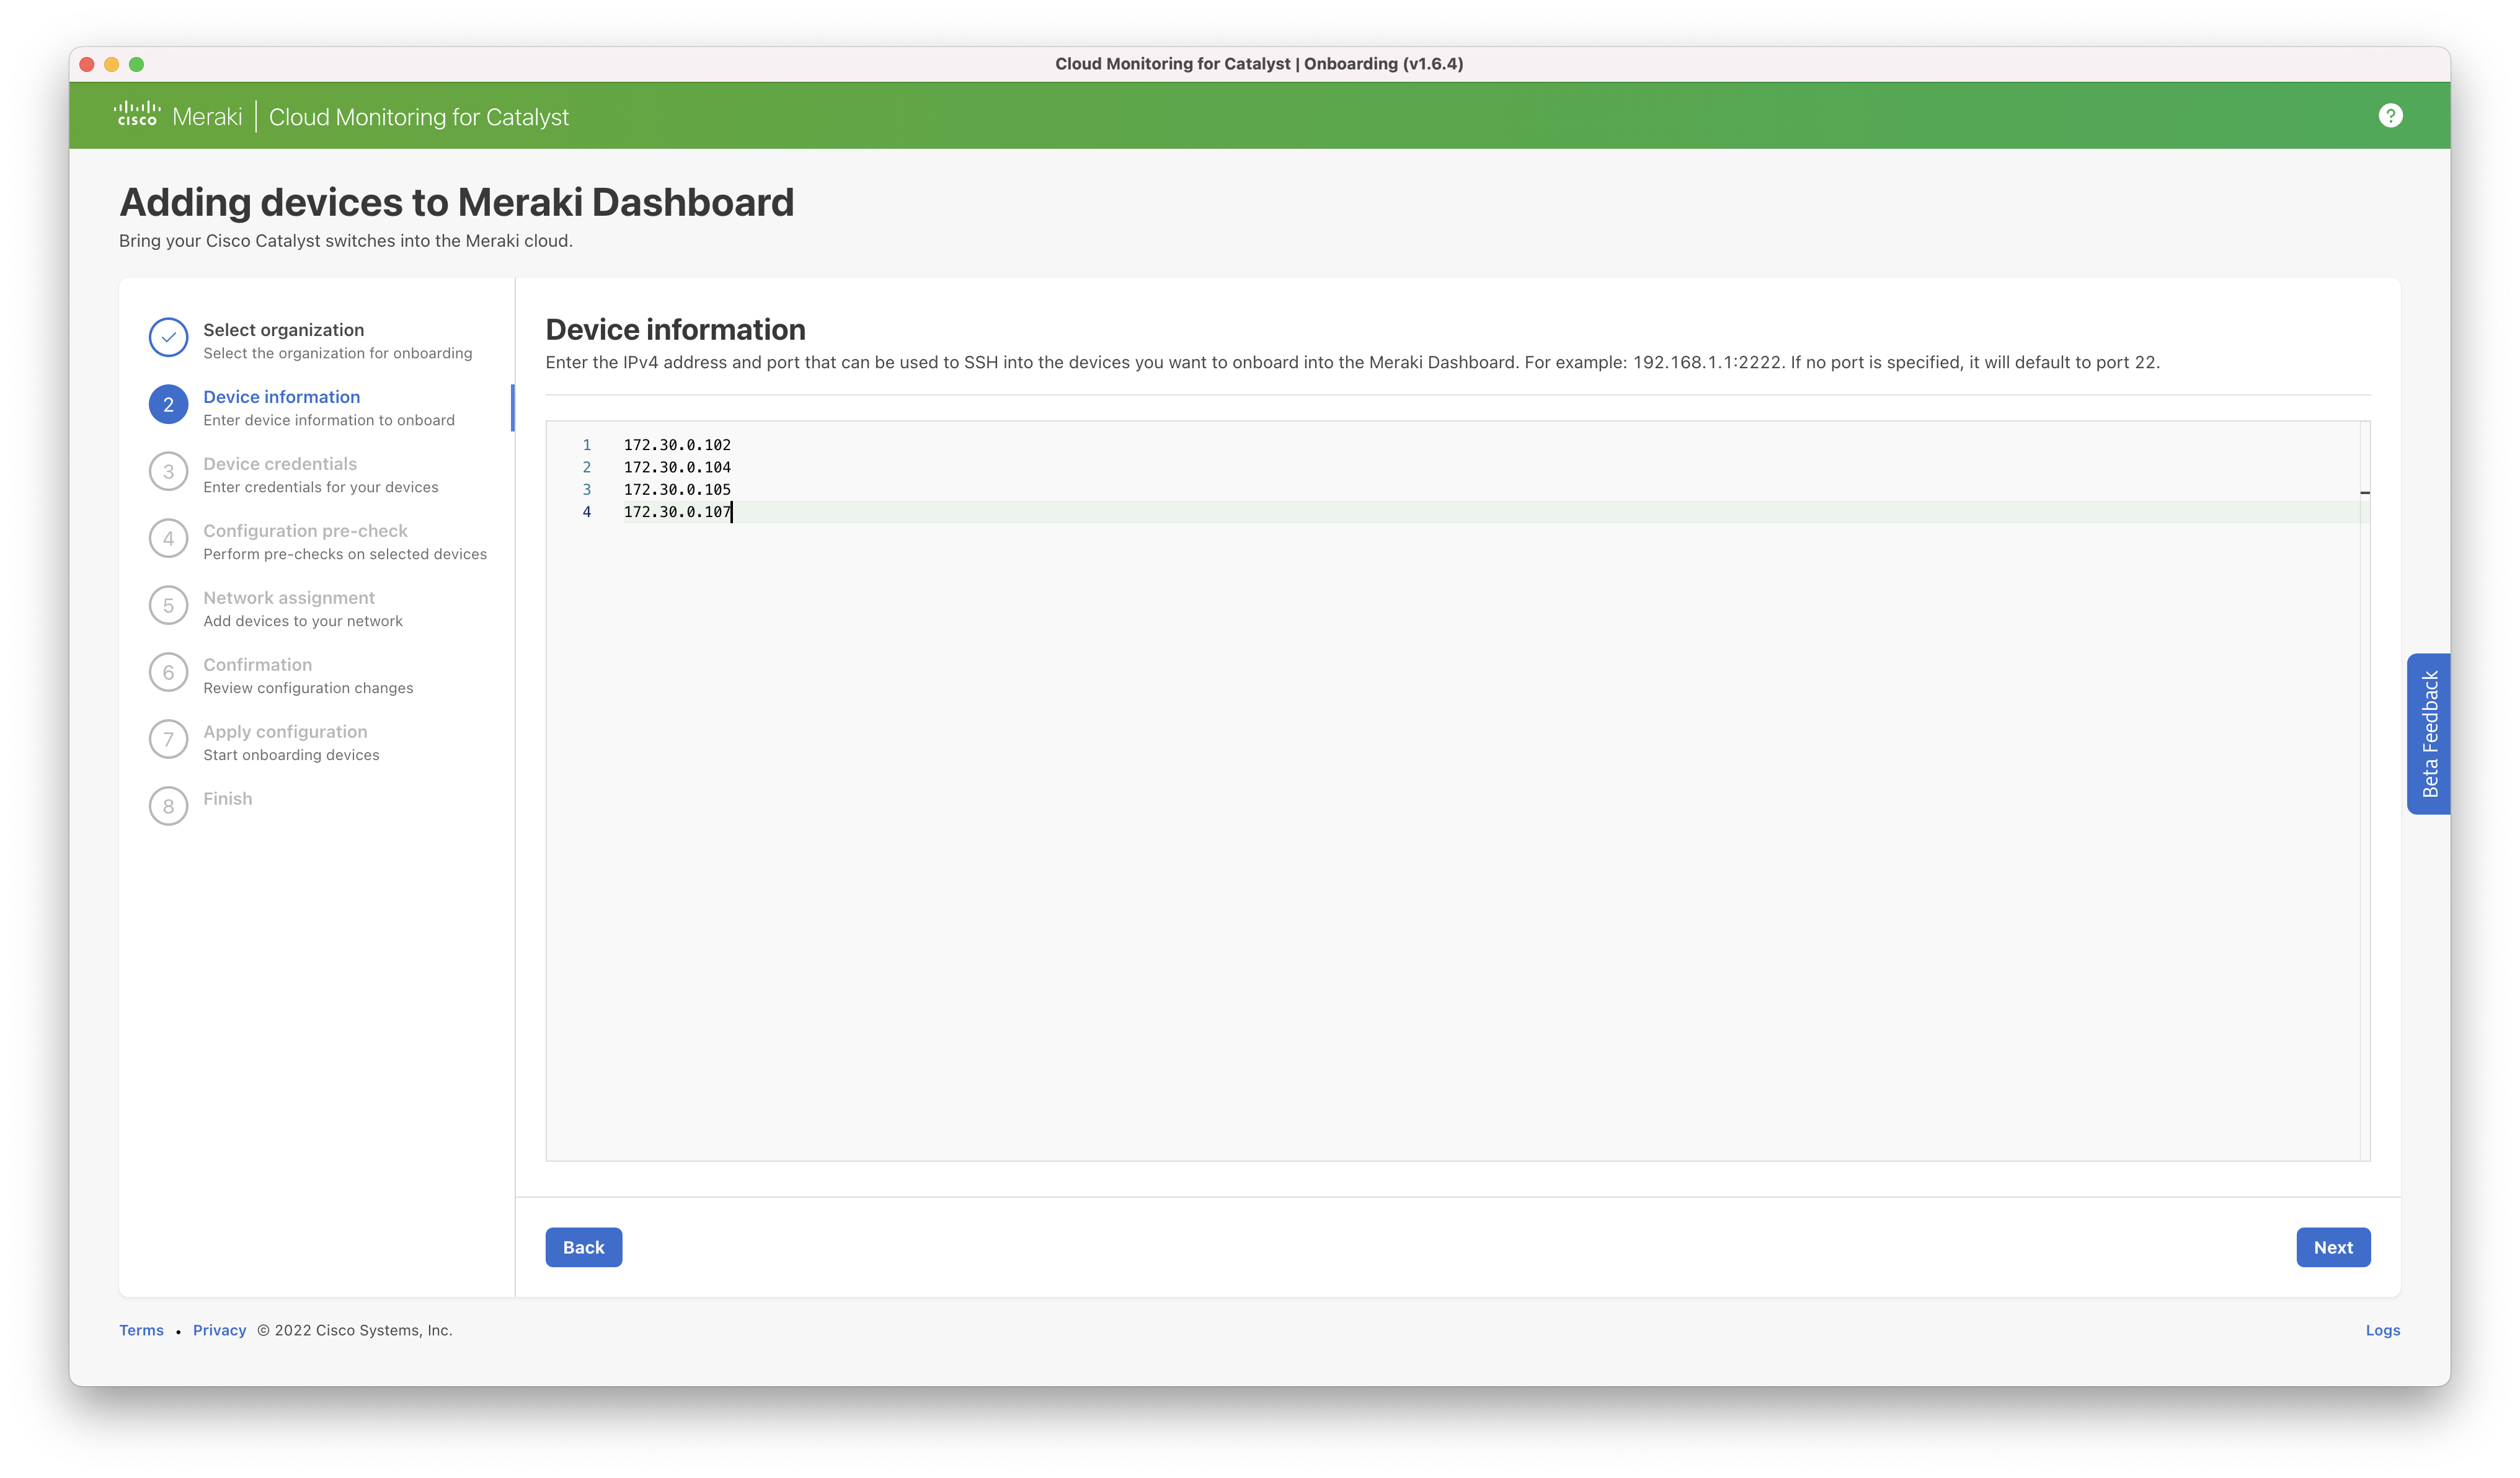
Step 2: Enter the IPv4 address of the switch(es) to be onboarded. This should be the local address that is accessible from the computer on which the onboarding tool is run. A port number can be specified if other than the default (TCP 22). For example: 192.168.1.10:3421.
Note: As Cisco stacks share the same IP address across all members, the single IP should be entered which will onboard the entire stack.
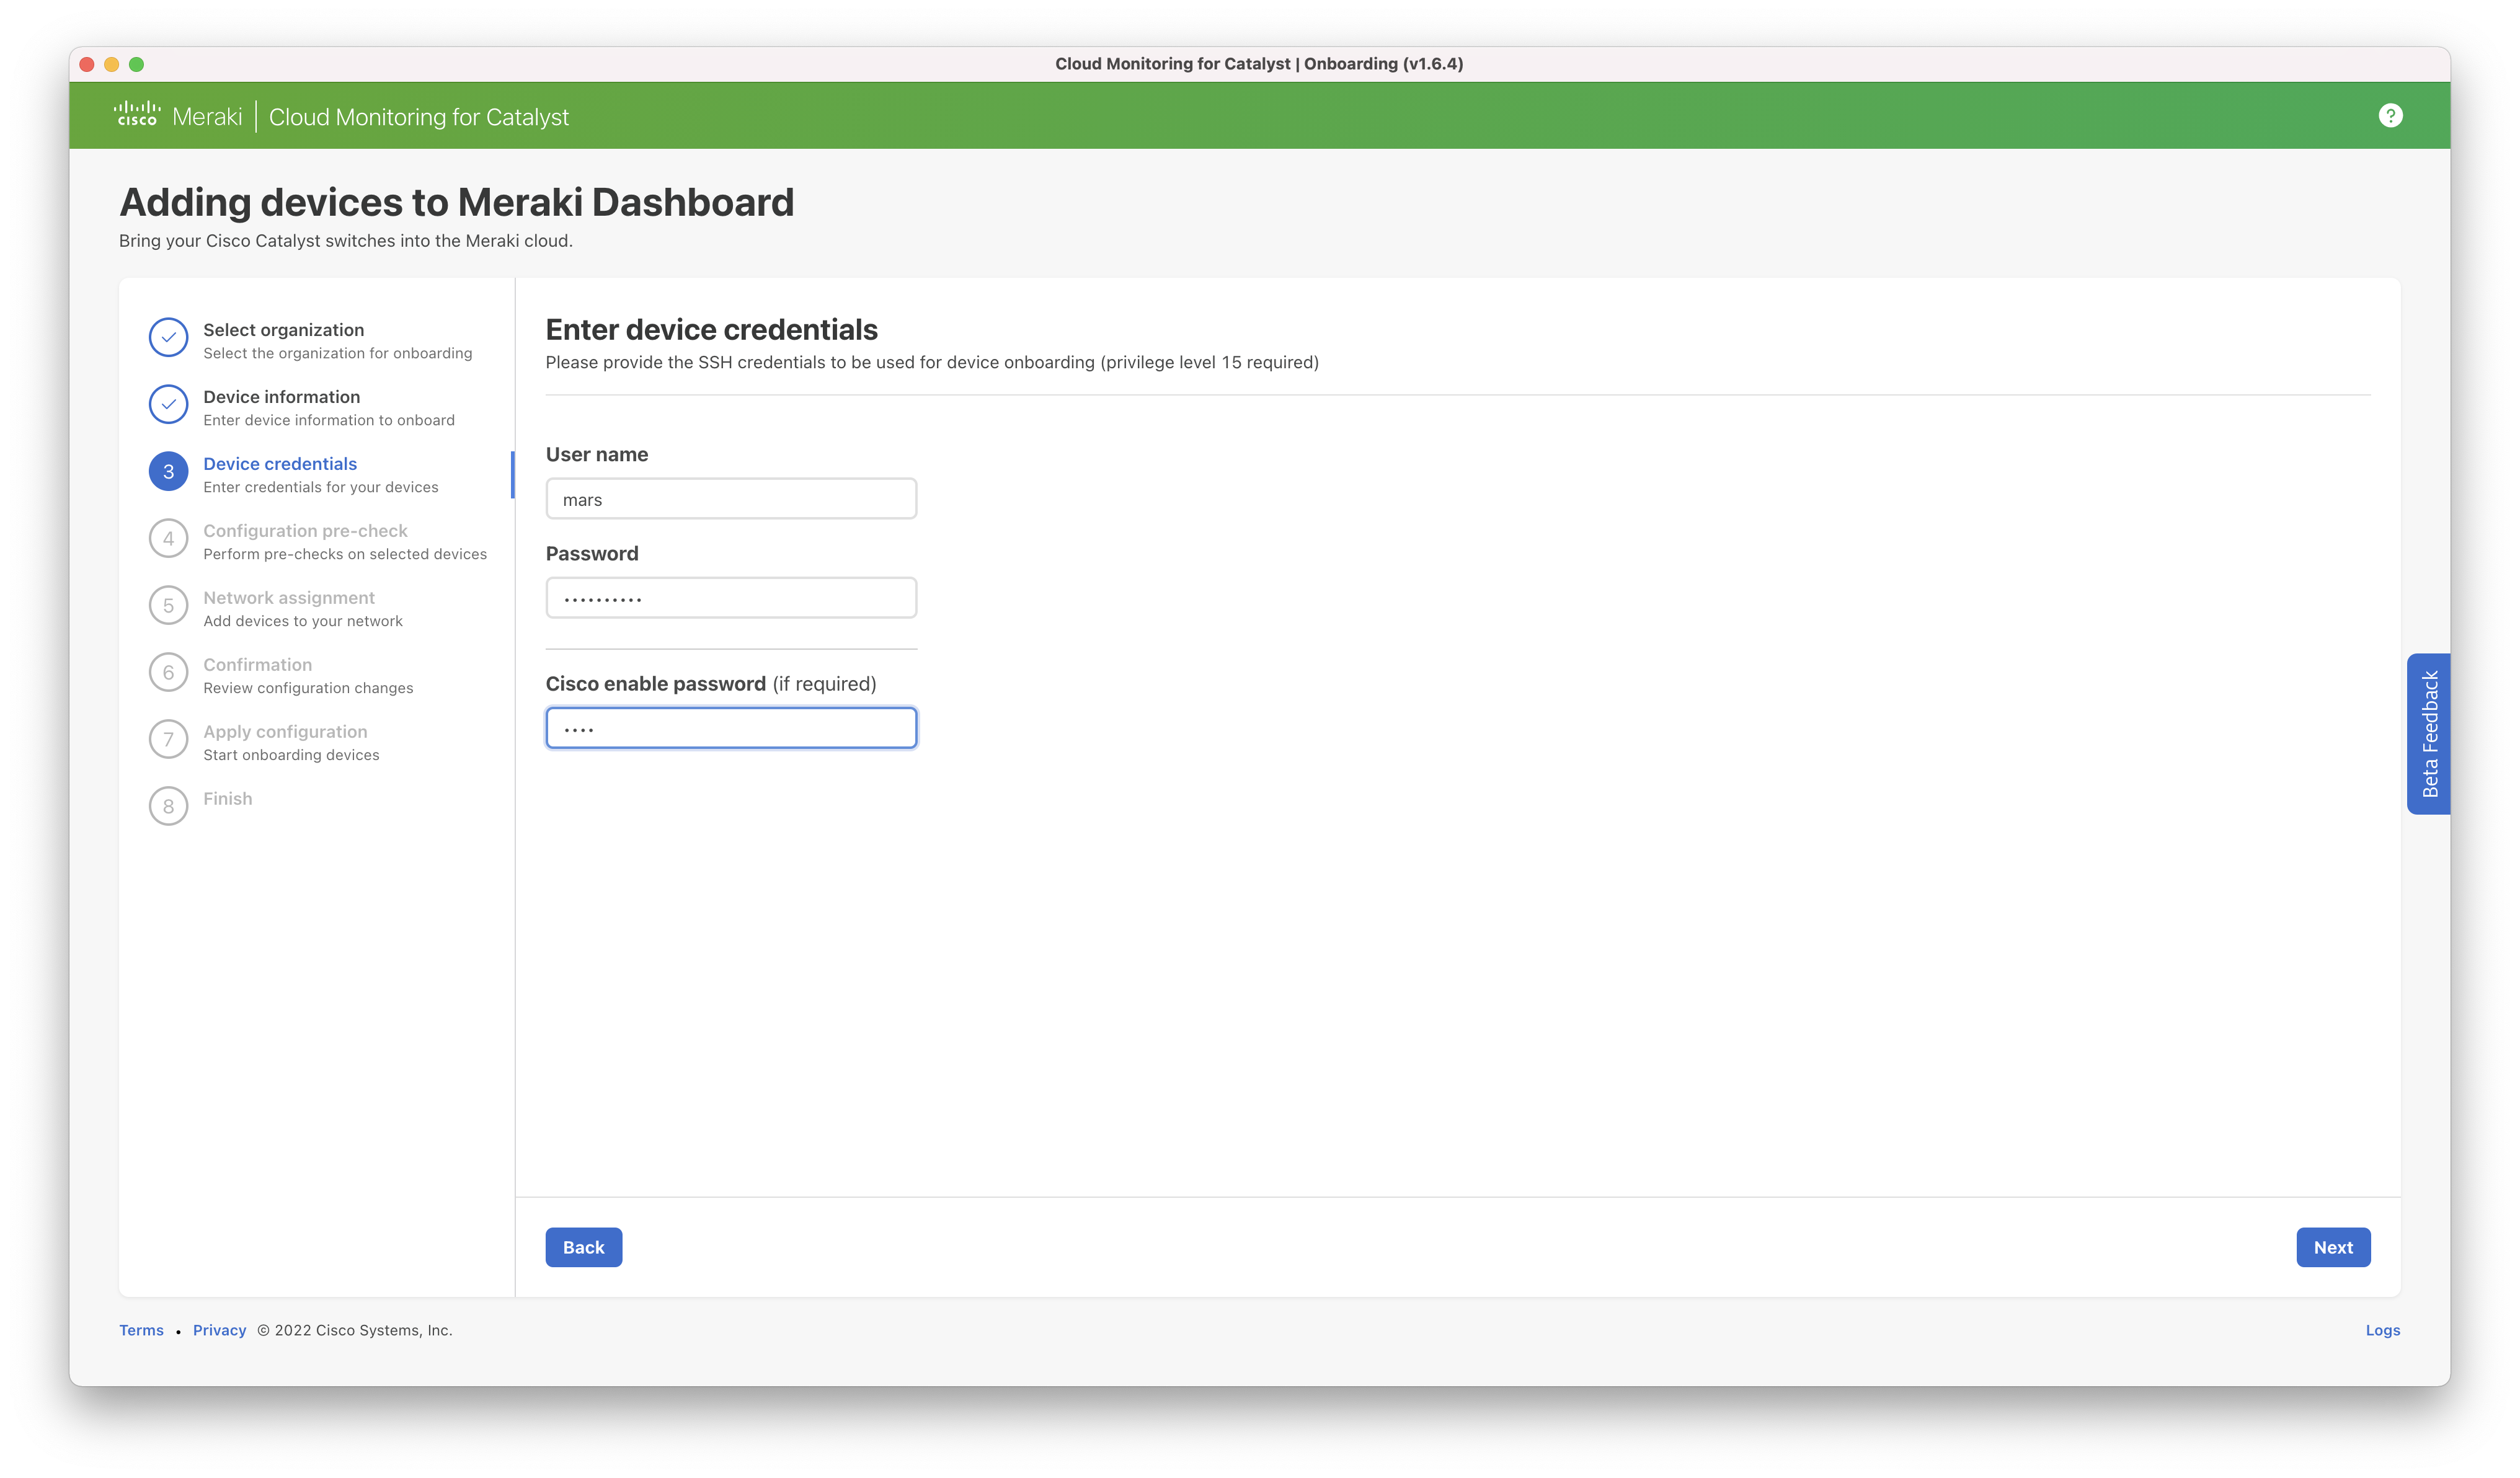
Step 3: Enter the SSH credentials of the switch(es) to be onboarded. The credentials must be the same for all switches. If different credentials are required, the onboarding process must be restarted after completion.
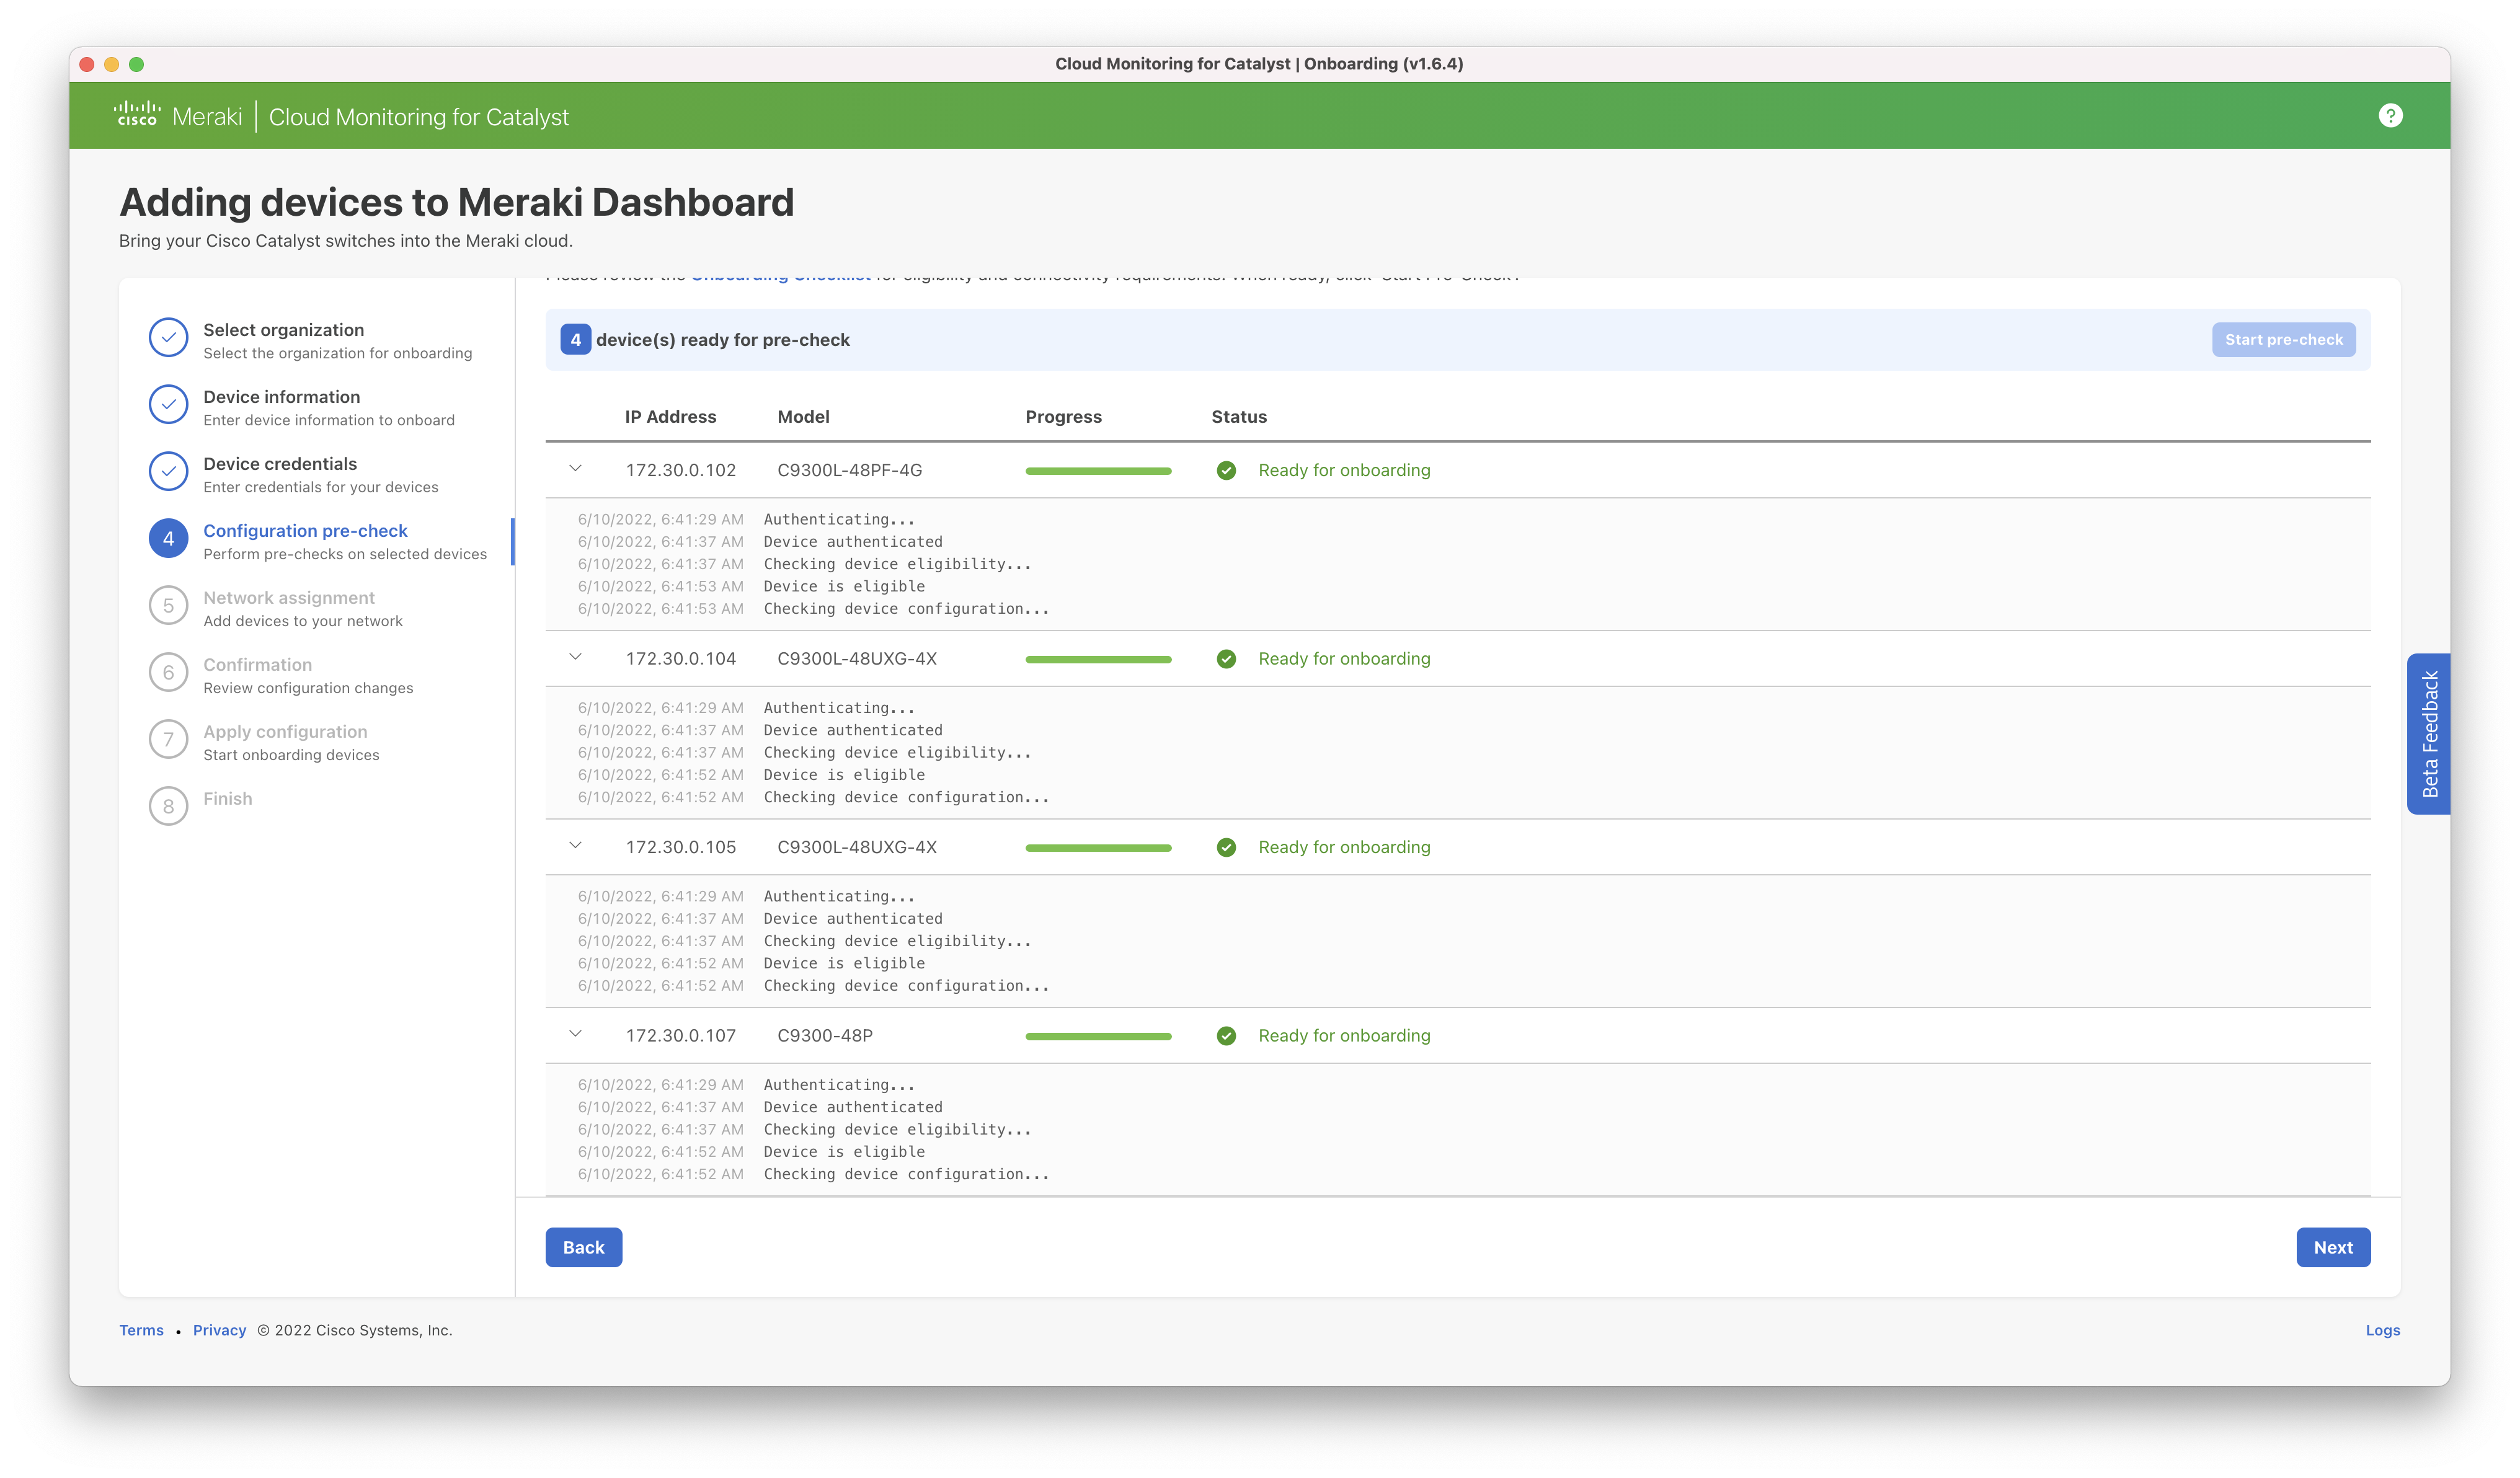
Step 4: Pre-checks will be completed to verify that the hardware, software, and configuration is eligible for cloud monitoring.
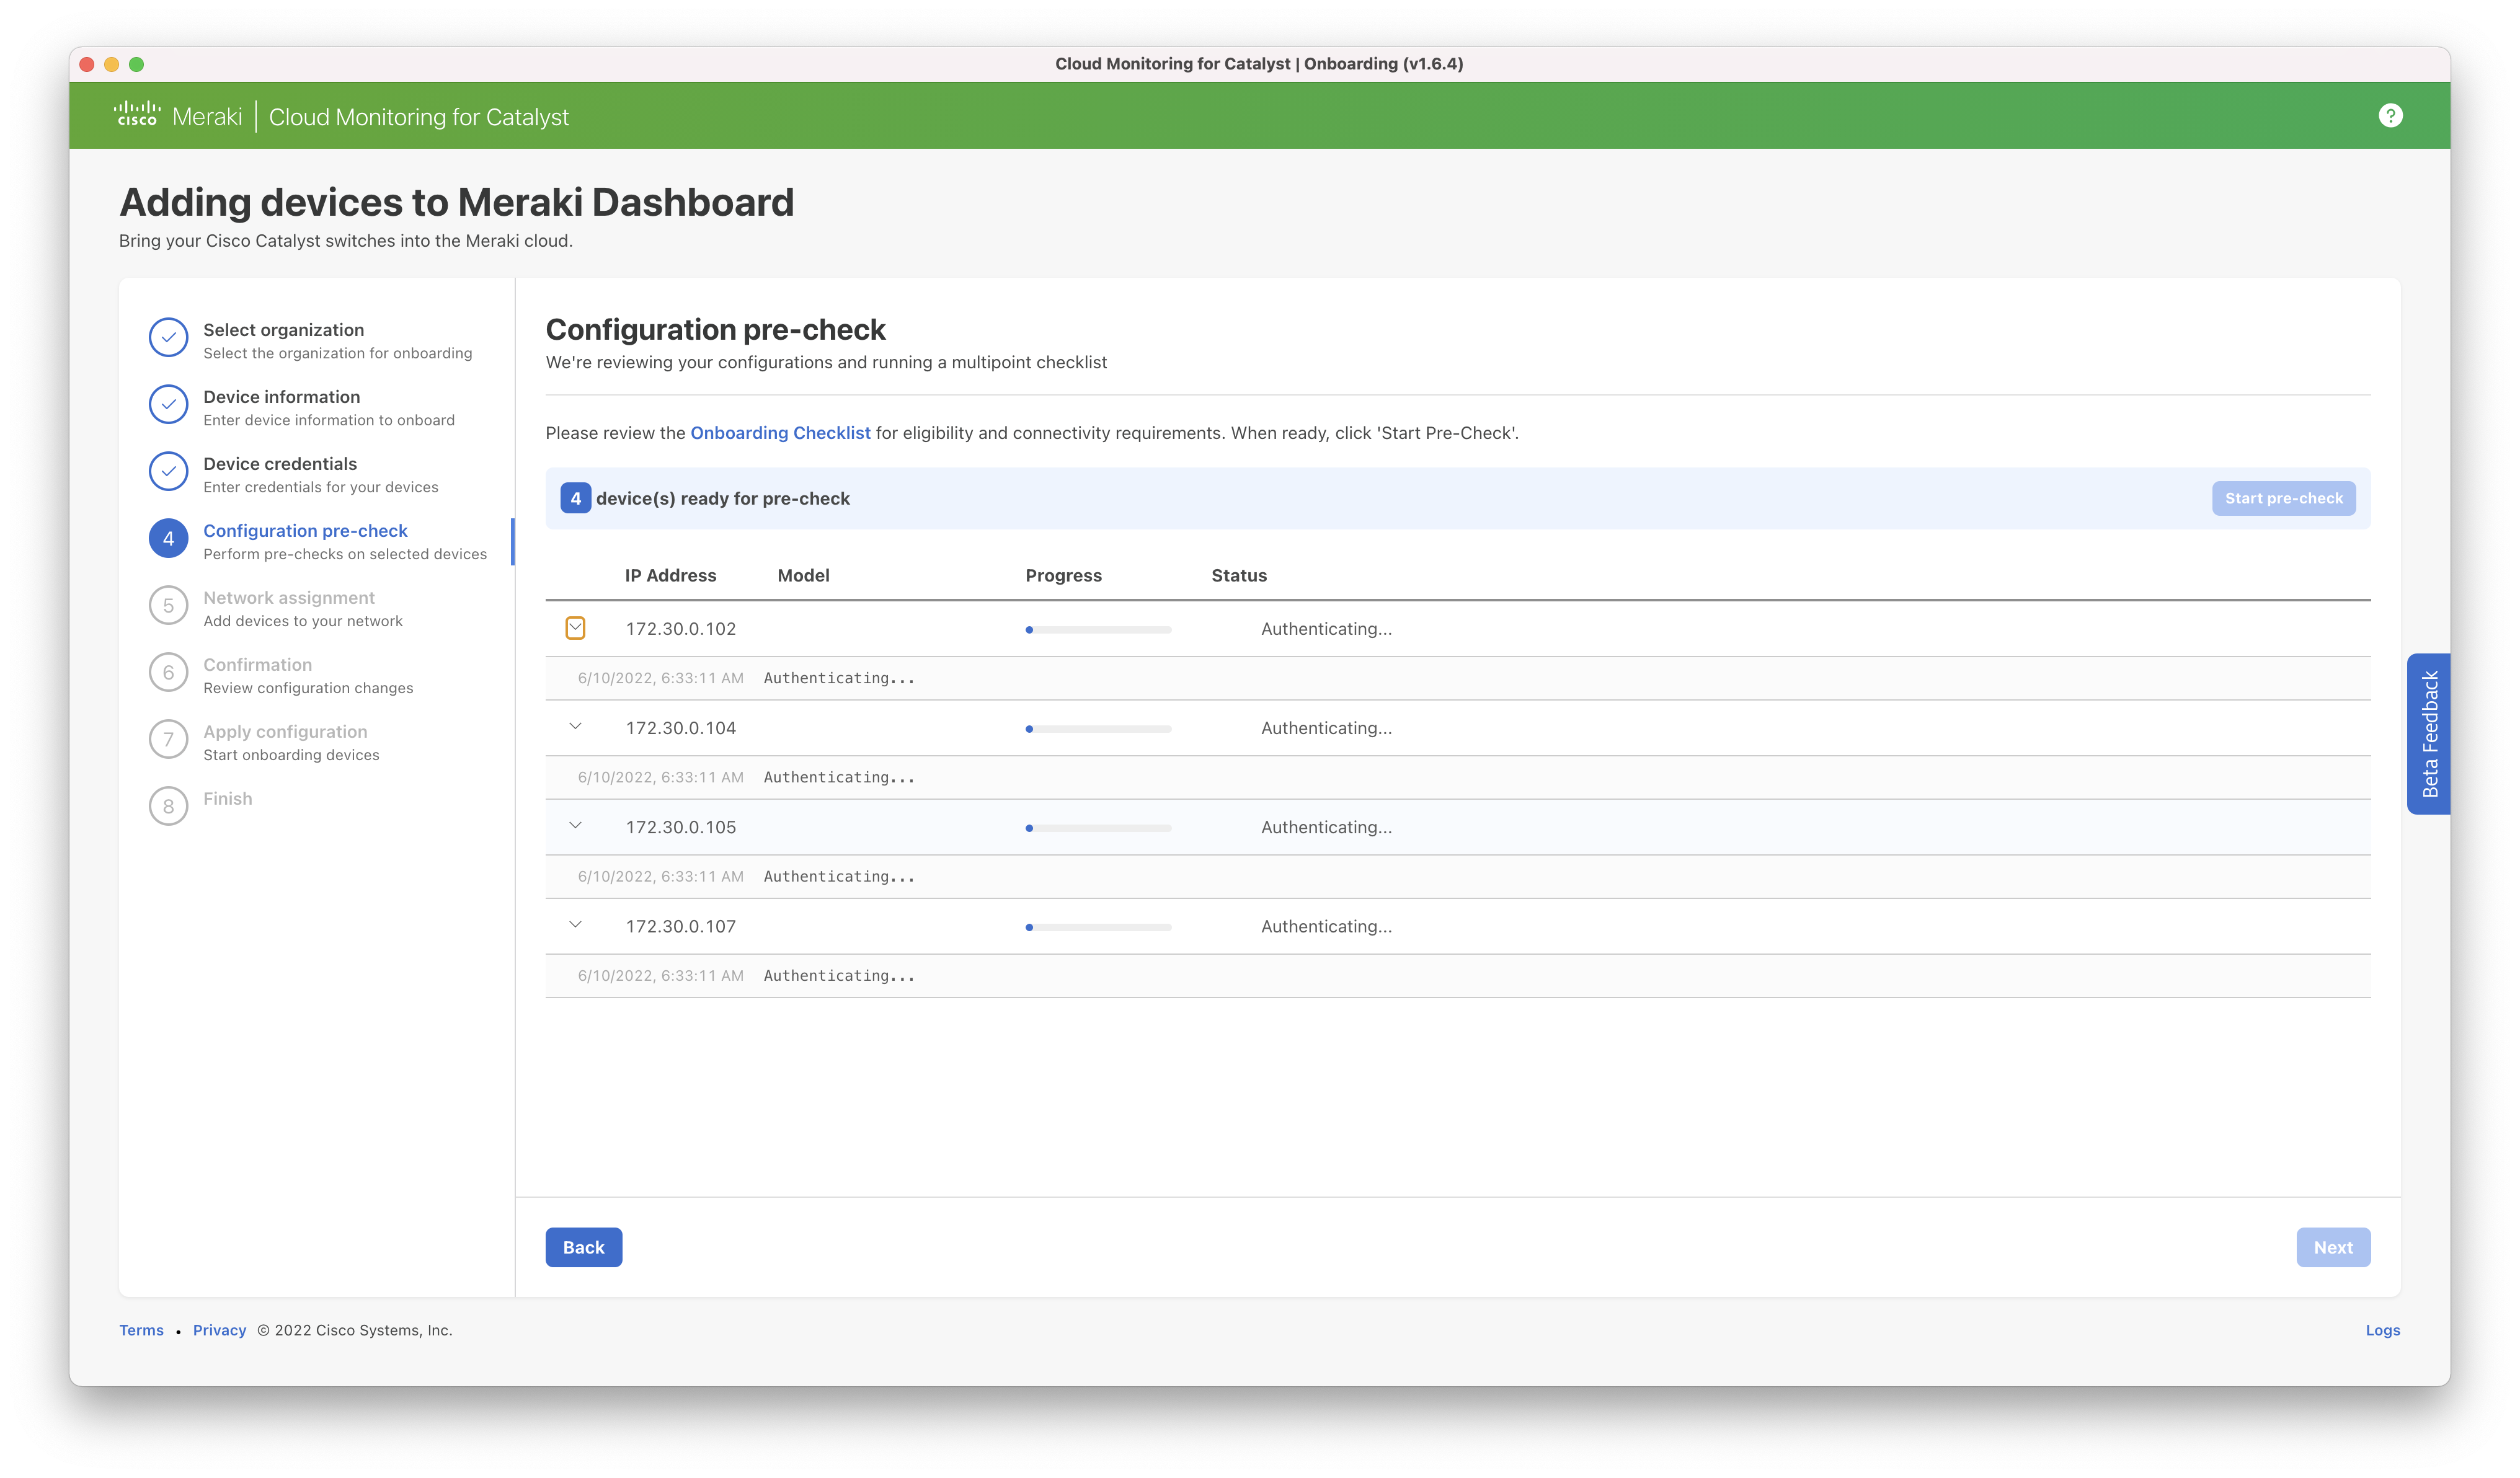
Note that at this time, only "password" authentication is supported, to verify that connectivity is not using pubkey as the authentication type, verify you can SSH with ssh -o PubkeyAuthentication=no -p <port> <username>@<ip>
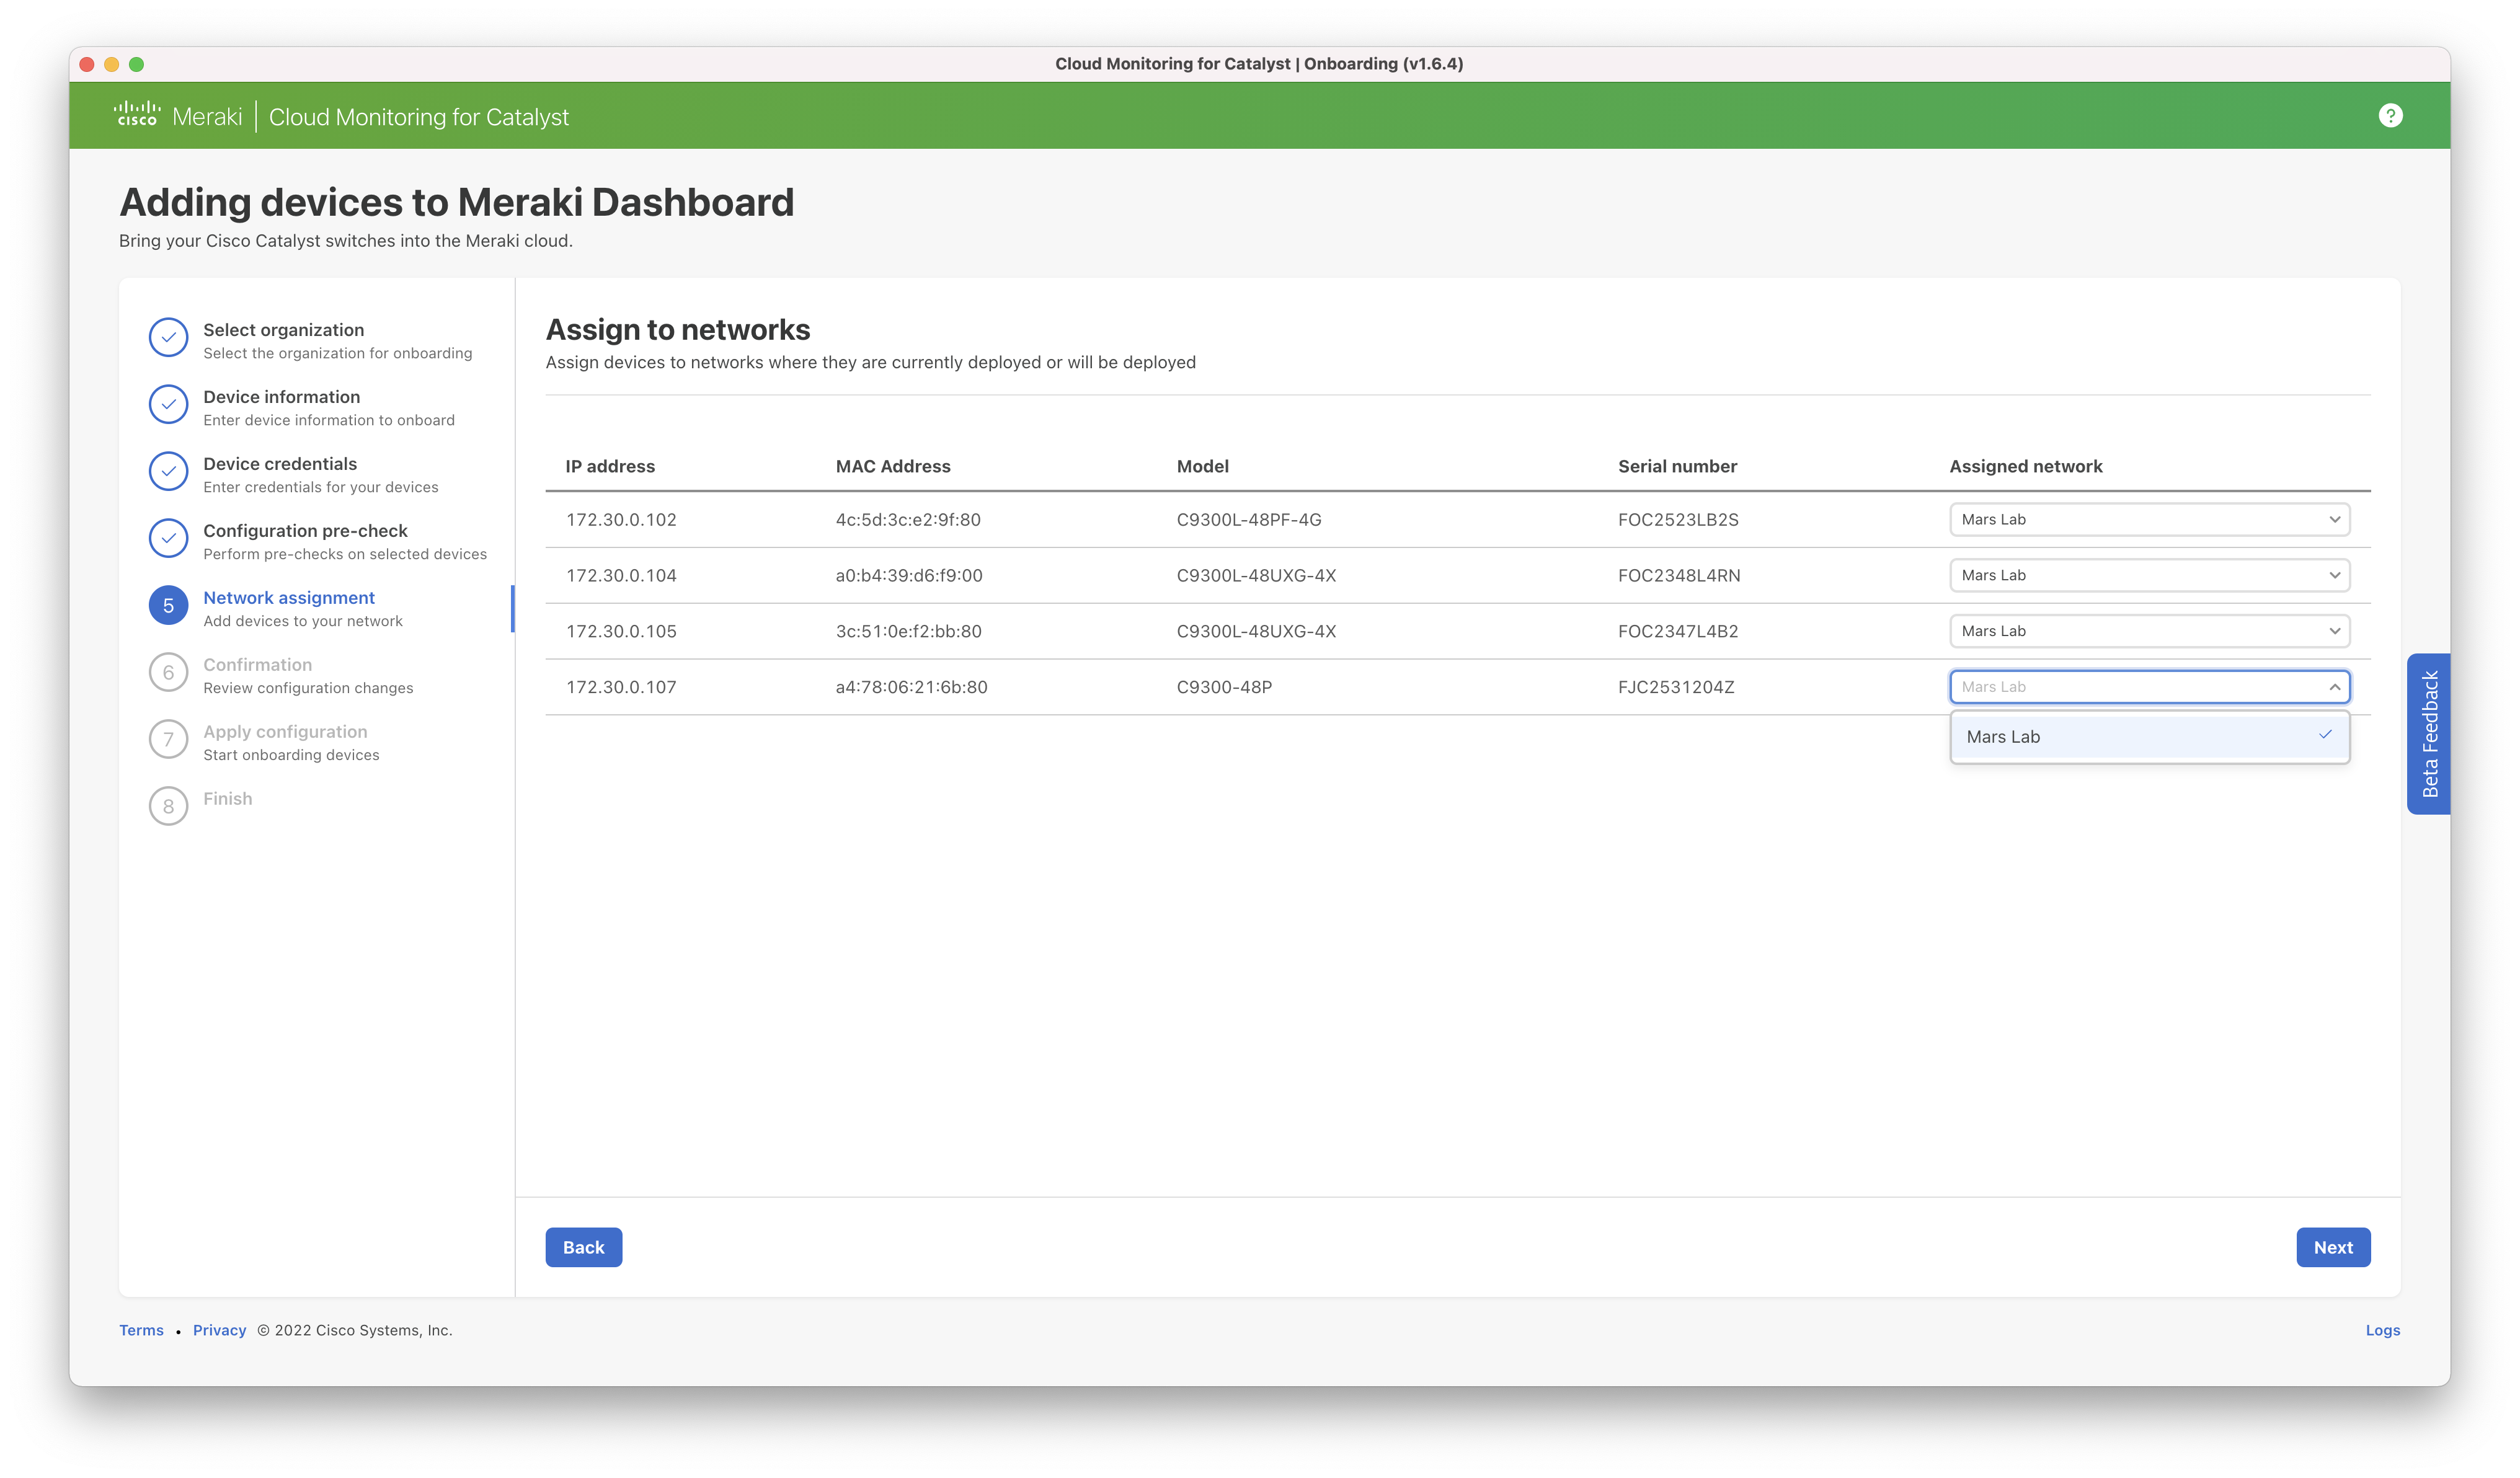
Step 5: The user is provided a list of networks in their organization and can select which one they would like to use for onboarding. Note that a switching network or combined network including switching must be used and a different network can be selected per switch being onboarded.
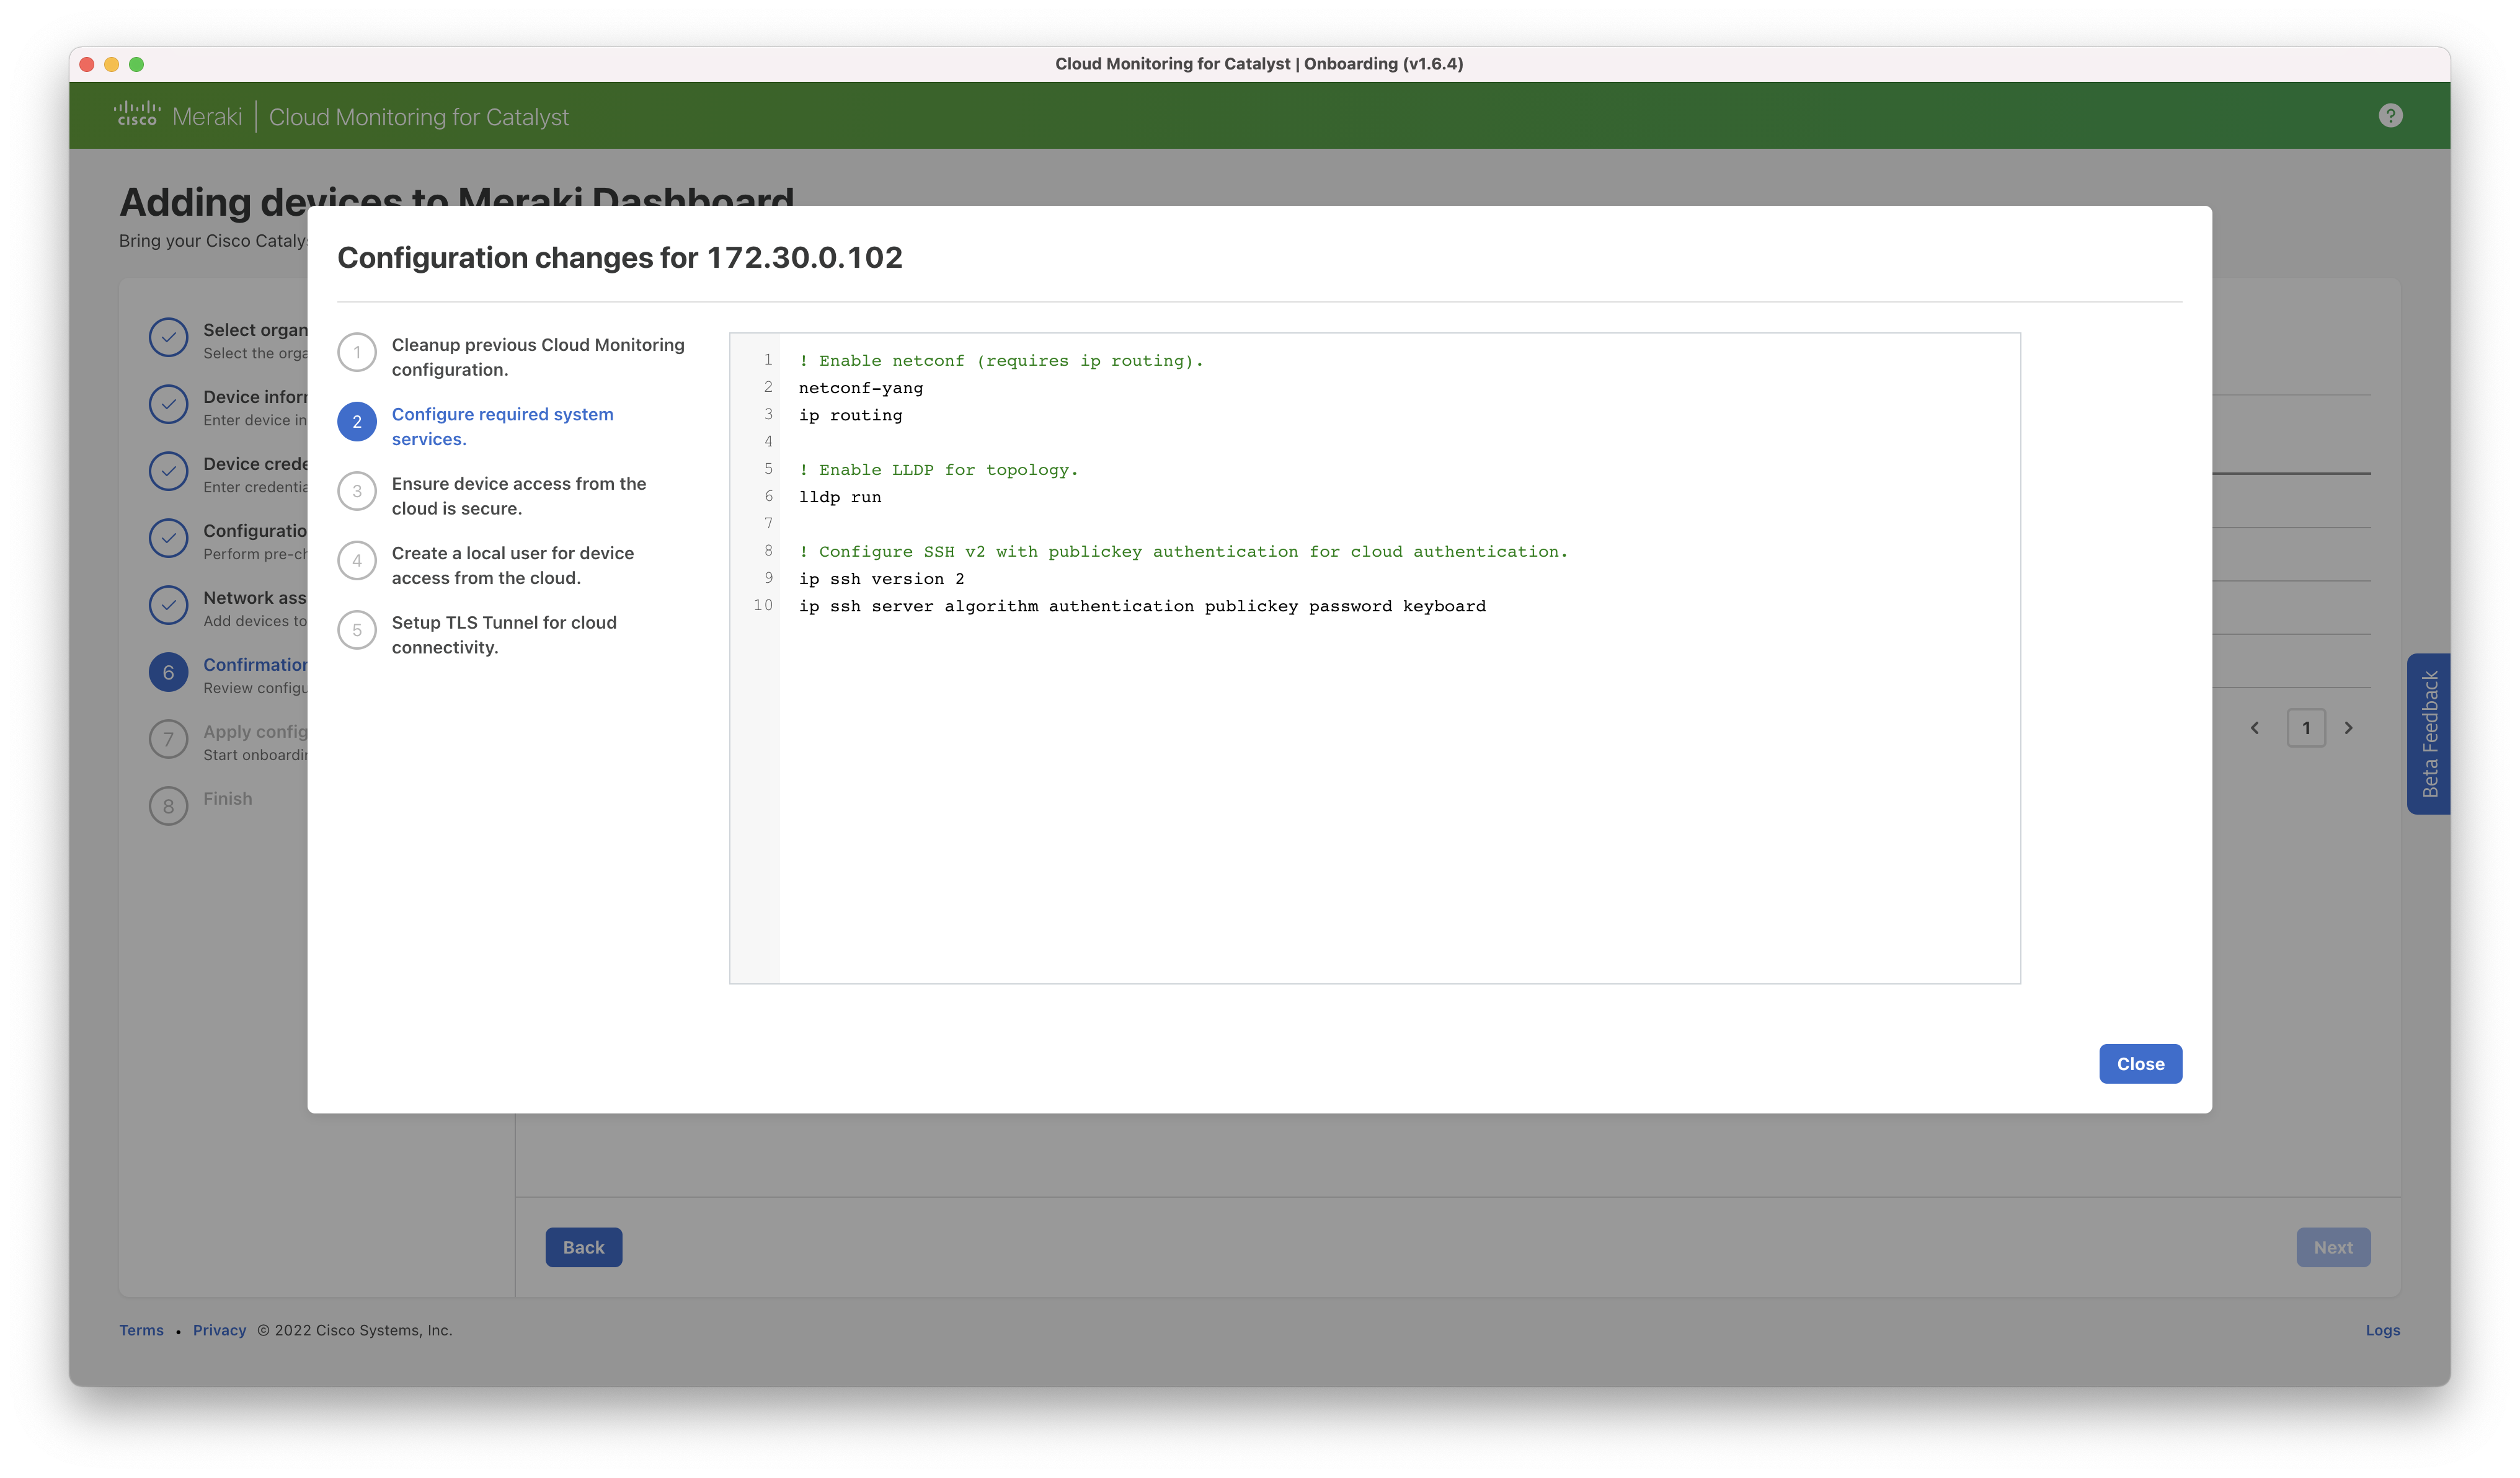
Step 6: The proposed configuration changes are presented to the user for review. The user must check the box next to each switch to confirm they would like to make the change.
Additional detail on the configurations that will be applied is available at: Cloud Monitoring Required Configuration.
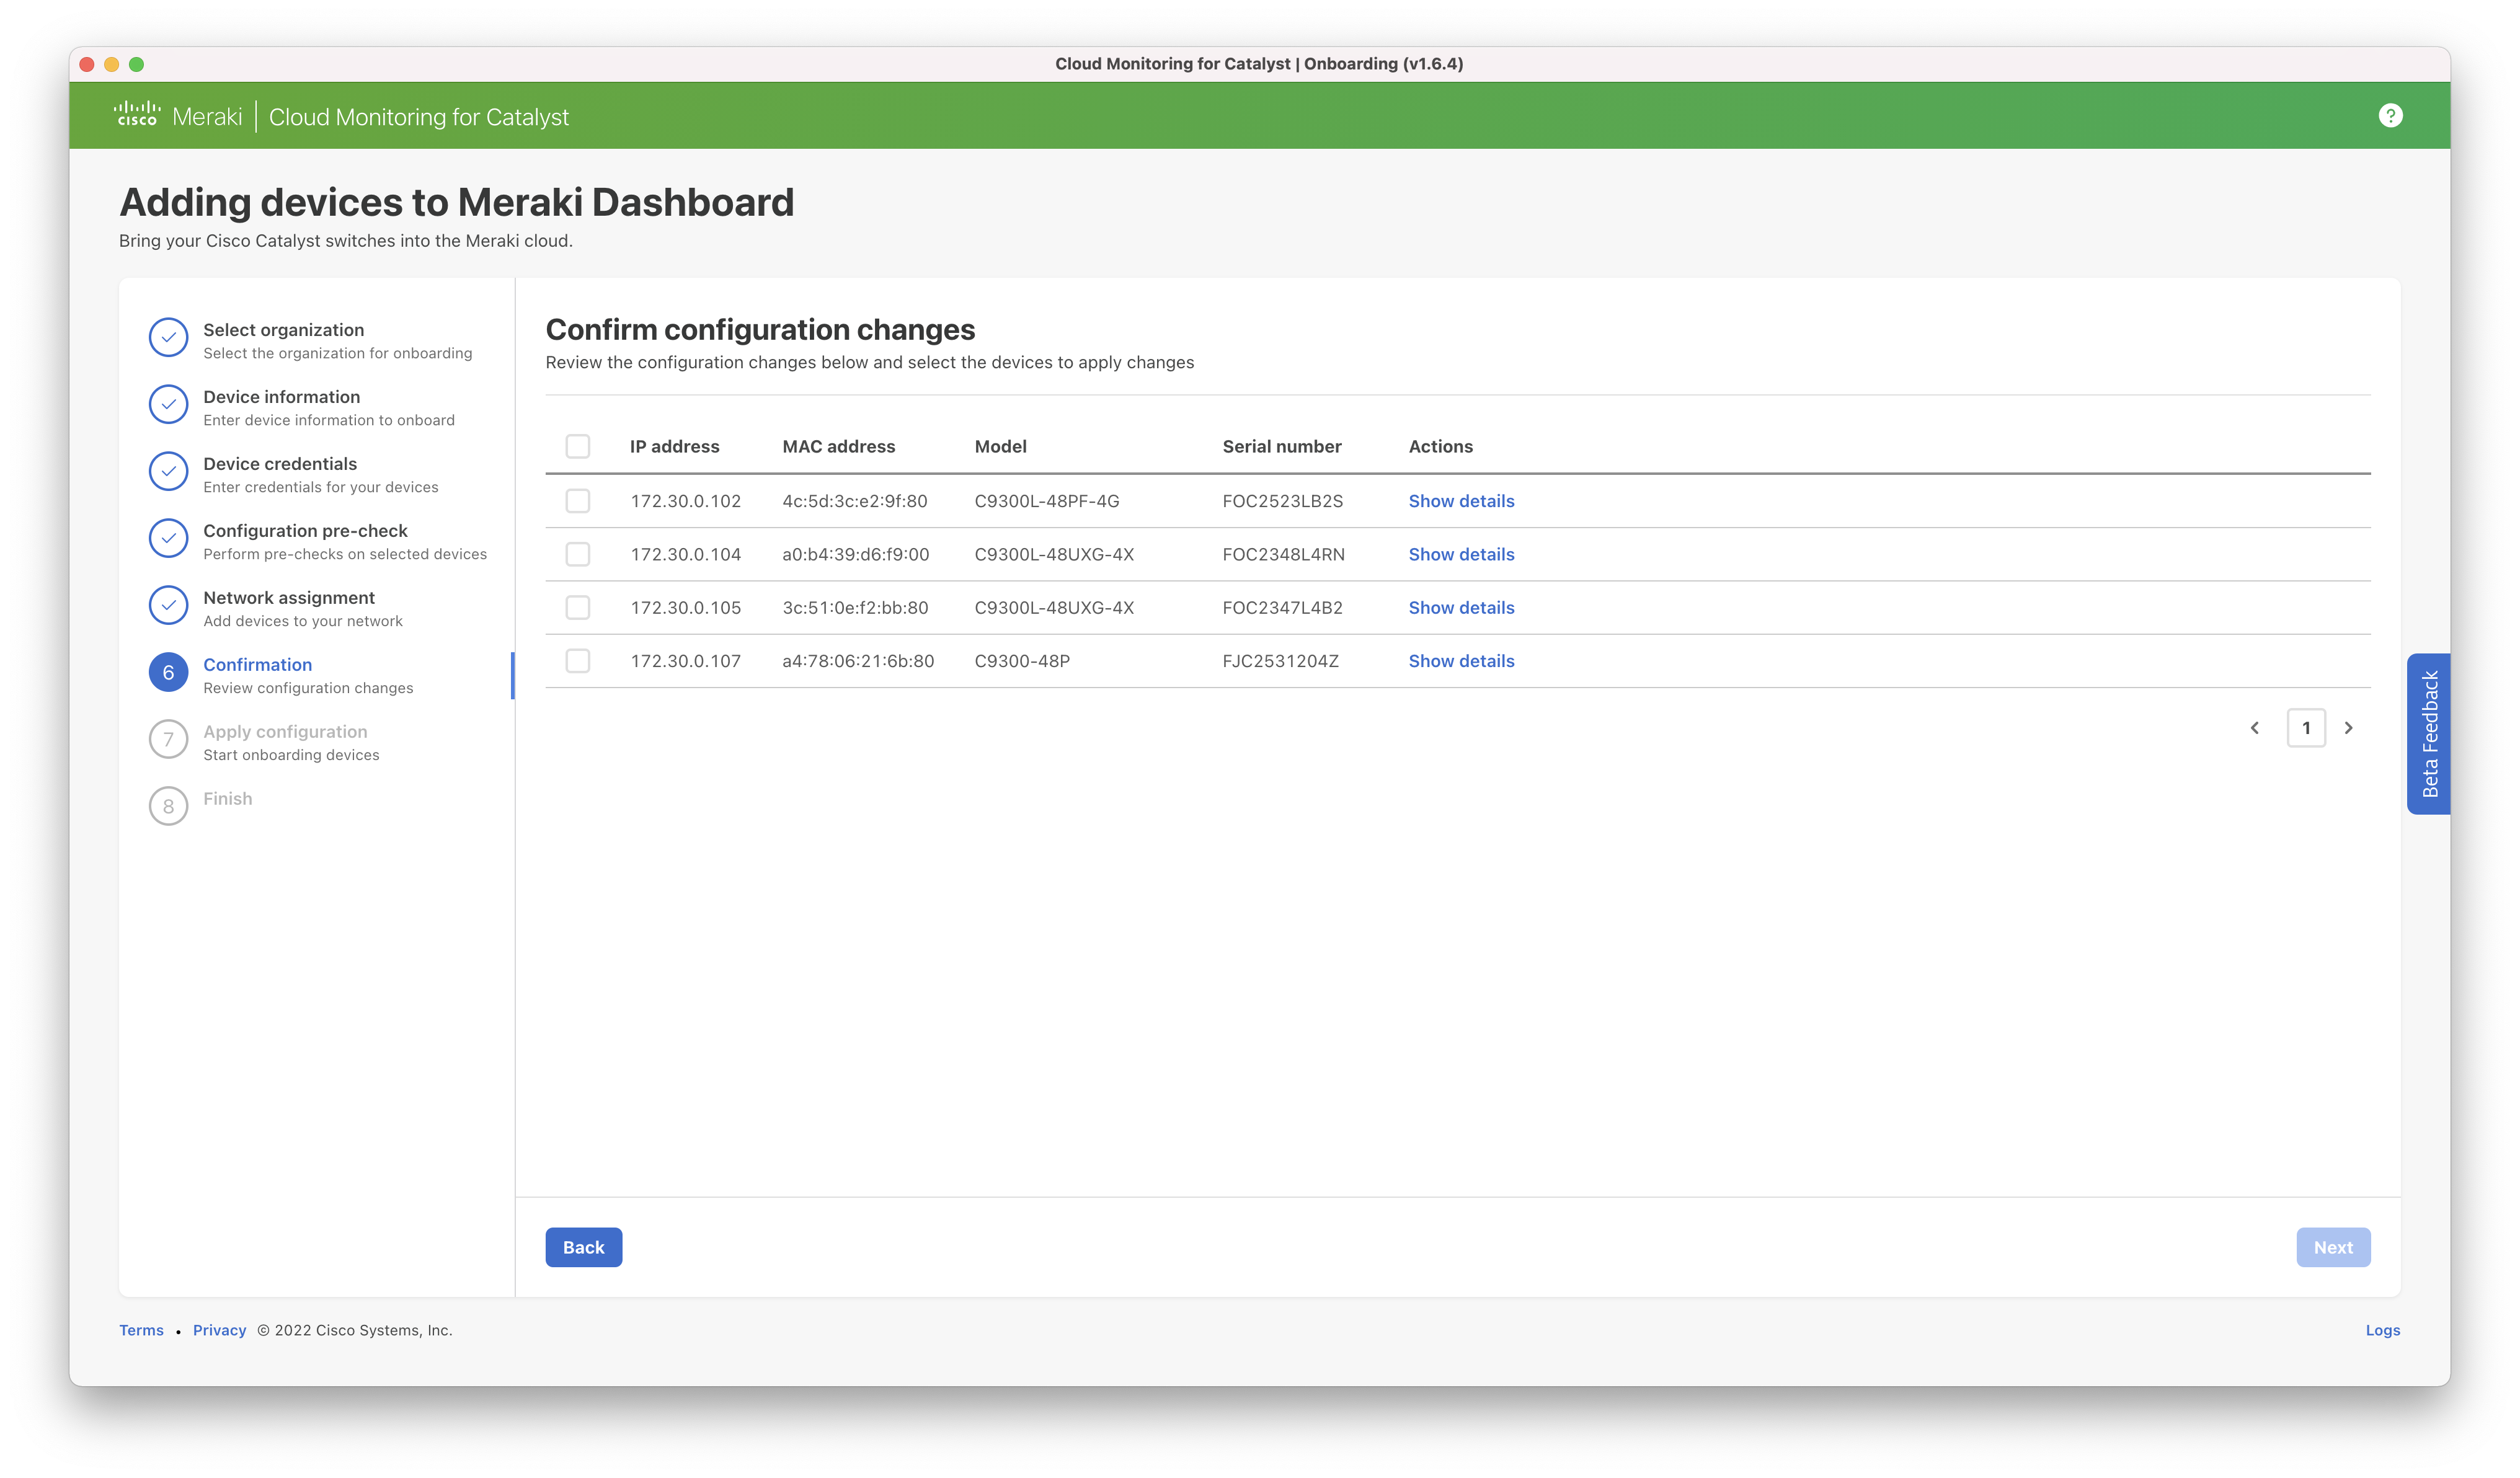
Details of all changes can be seen using the “show details” link.
Step 7: The configuration is applied.
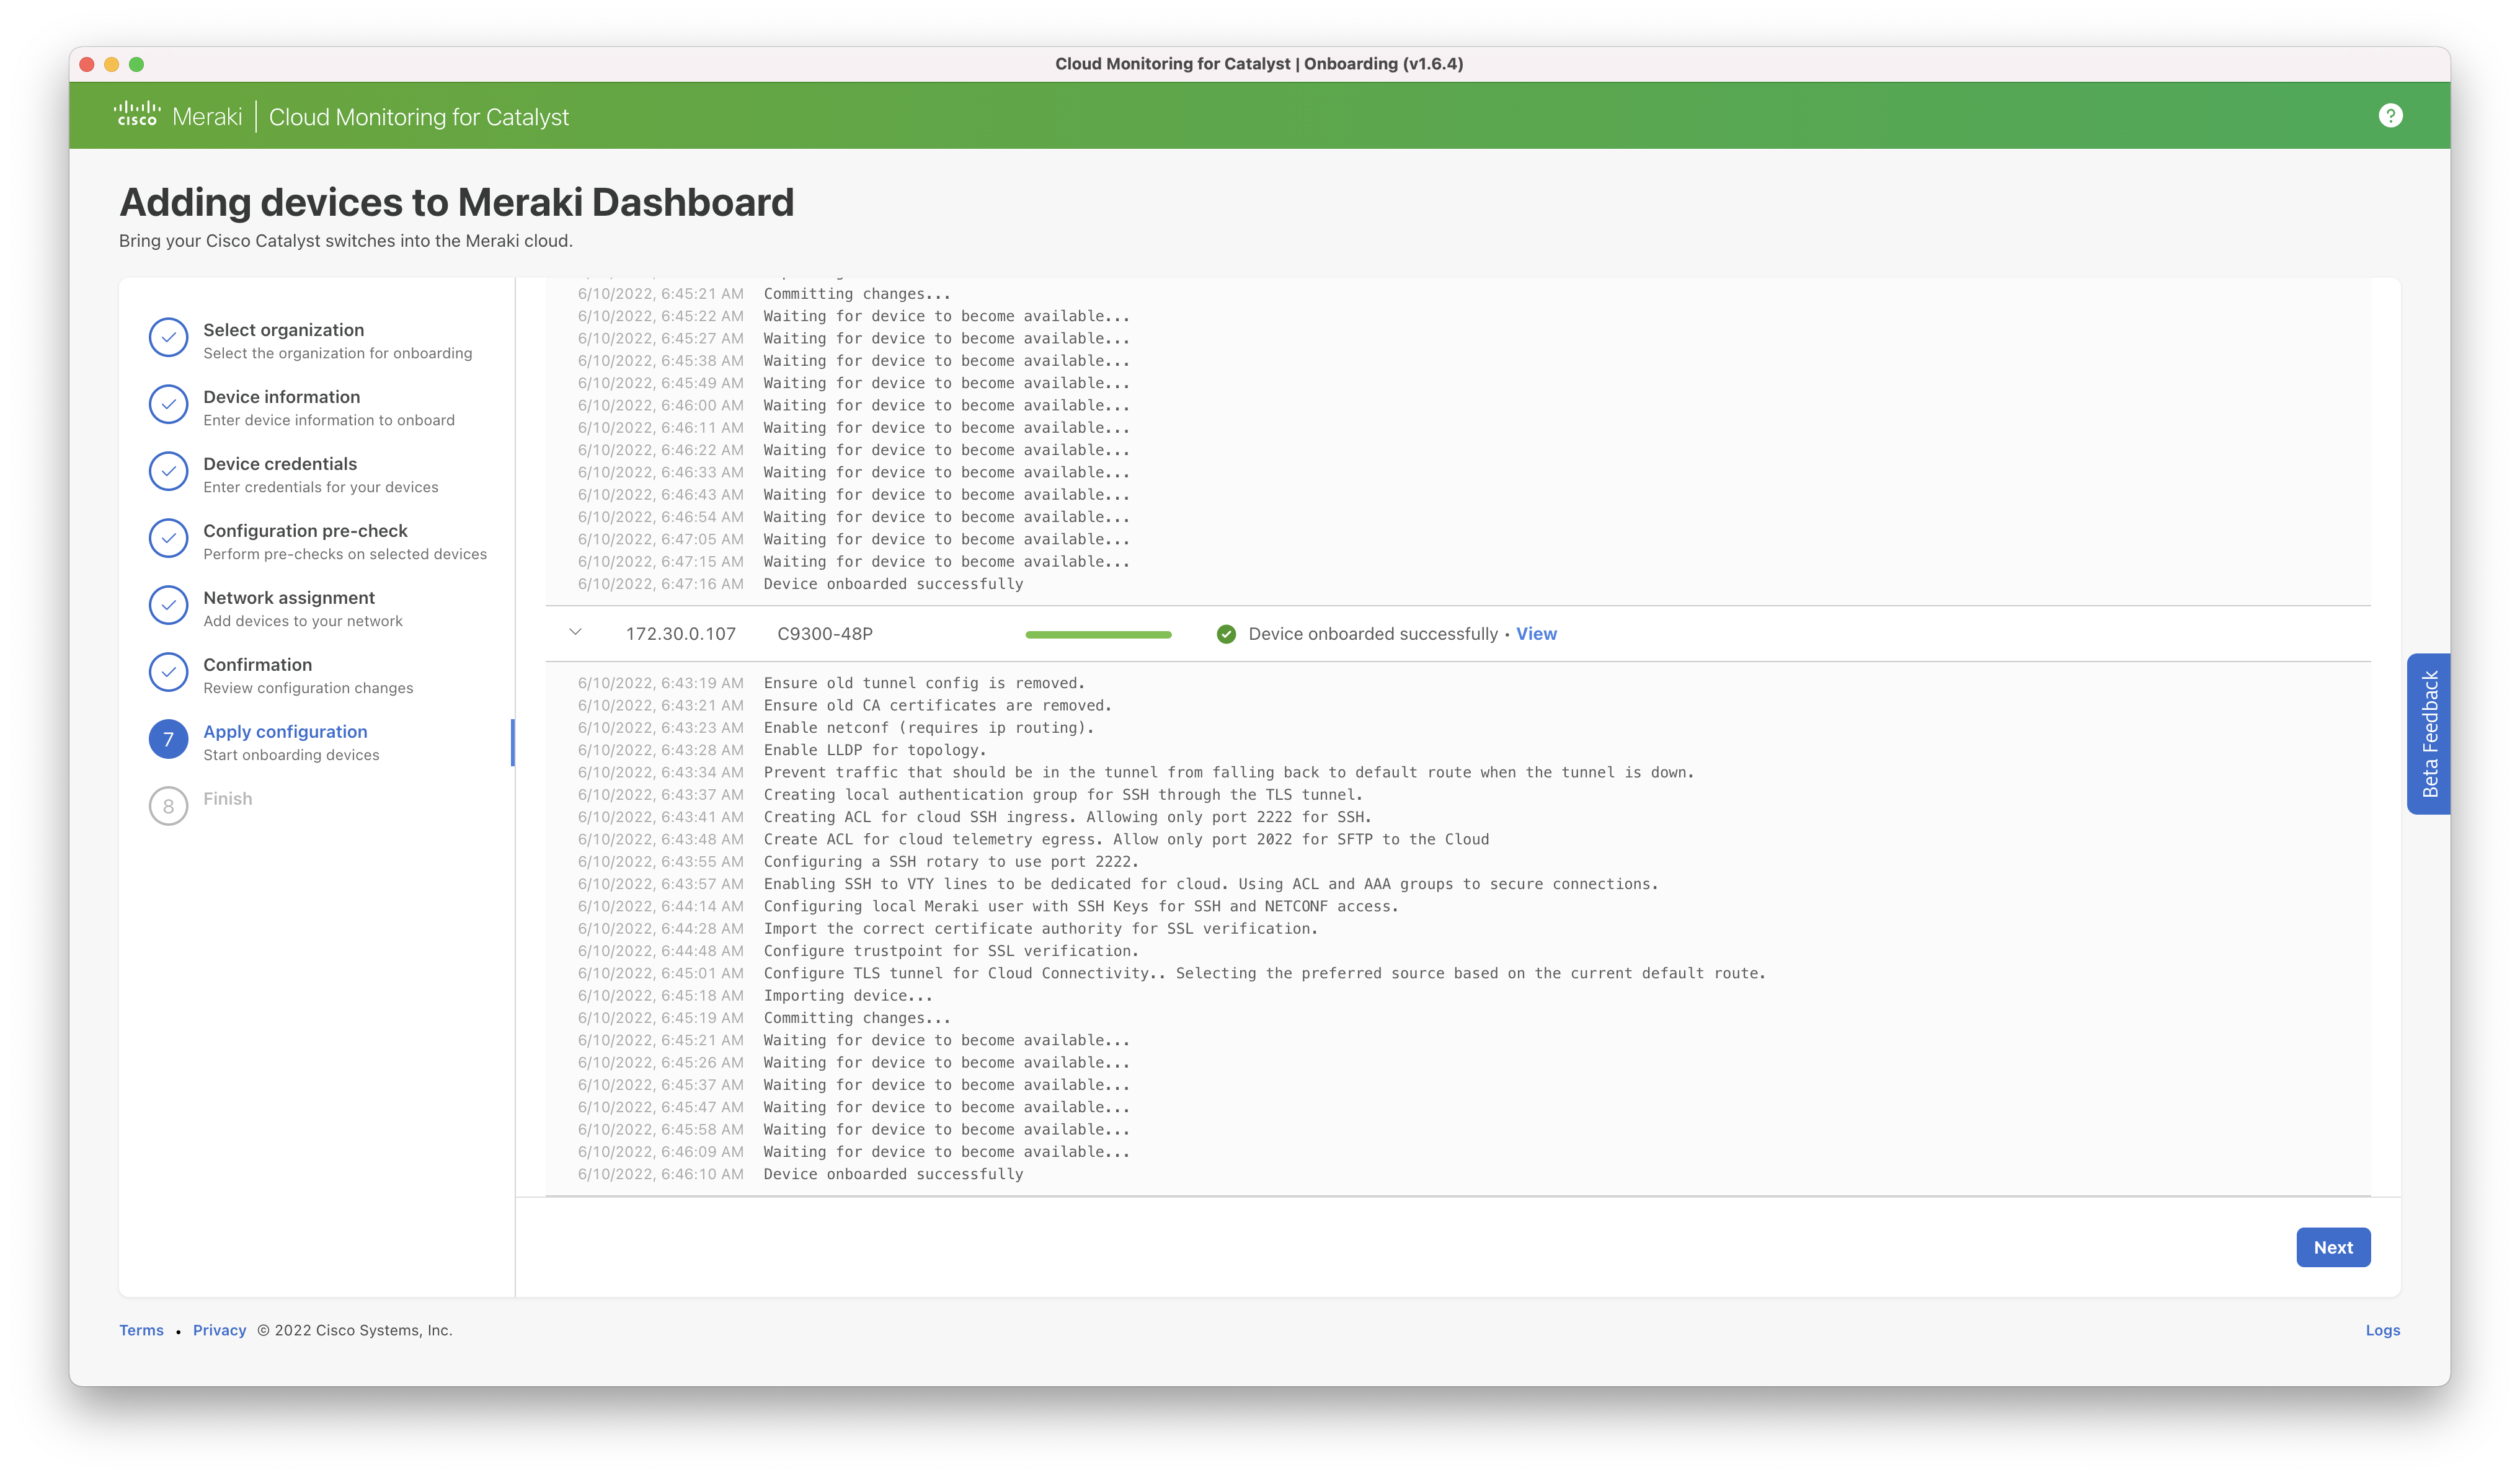
After completion, the switch may take a few minutes to appear in the dashboard. Additional data will take time to populate.
Dashboard page after onboarding:

Offboarding/Removing Switches from Cloud Monitoring
Manual Cleanup Required: Switches Not Migrated Before March 31
Switches not migrated to device configuration mode before March 31 (Cloud Monitoring decommission) will not have their configurations removed automatically as part of the offboarding or removal process and will require manual cleanup of the cloud monitoring specific configuration.
Click HERE for the enhanced EEM scripts and step-by-step instructions. These scripts will automatically remove all Cloud Monitoring configurations, including AAA.
Standard Offboarding Process for Cloud Monitored Switches (Only applicable before March 31)
To remove a switch from the dashboard and cloud monitoring, follow the standard process for removing a device from a Meraki network seen in the article, Adding and Removing Devices from Dashboard Networks.
From the switches page, select the checkbox next to the desired switch(es) and then click Edit > Remove from network. You will be asked to confirm the removal of the selected switch(es). Once confirmed, this action will trigger an Embedded Event Manager (EEM) script on each affected switch. The script is designed to automatically clear all configurations previously applied for integration with the dashboard. This effectively severs any active tunnel connections to the cloud, ensuring that the switch(es) will no longer be managed by the Meraki Cloud.
AAA configurations added specifically for Cloud Monitoring will not be automatically removed.
After March 31, once Cloud Monitoring is decommissioned, clicking Remove from network in the dashboard will no longer trigger automatic configuration cleanup on the switch. Any remaining Cloud Monitoring configurations must be removed manually. See the Manual Cleanup Required: Switches Not Migrated Before March 31 section for instructions.
Cloud Monitoring Onboarding Error Messages
Invalid API key. A full (read/write) key is required. The API key is validated by the onboarding application by connecting to the API server at api.meraki.com.
This message indicates that the API key could not be validated with the server. Check that the key is entered correctly. If this still does not work, a new API key must be created following the instructions in our Dashboard API article.
Note that a full admin account is required and that the key must be read/write (not read-only). Accounts using SAML are unable to generate API keys, and a dashboard account with Meraki credentials should be used instead.
Unable to validate your API key. A full (read/write) key is required. Please try again.
Ensure connectivity from the local computer to api.meraki.com on TCP 443. HTTPS proxies in the path are not currently supported.
If connectivity has been validated and this error is still seen, a new key can be generated following the instructions above.
Error: Timed out while waiting for handshake. Confirm you can reach the switch via SSH from this computer.
The onboarding application will attempt to connect via SSH on the IP address and port provided. Confirm that the switch can be reached from the same computer using a terminal connection on the same IP address and port. Ensure there are no firewall rules in place preventing connections from the onboarding application.
Error: All configured authentication methods failed. Confirm your username and password are correct.
The credentials provided are returned as invalid from the switch. Ensure that the username and password are correct. If an enable password is required to have elevated rights (privilege level 15), this must be provided as well.
Device is not eligible for onboarding. Reason: [reason]
Review the reason shown. Confirm that the hardware, IOS-XE version, and DNA license are supported according to the onboarding documentation.
Error checking device [configuration]
Ensure the switch is reachable on the IP address and port provided. Confirm that the credentials provided have privilege level 15 to read all information from the switch.
The credentials you provided do not have permission to proceed with the onboarding process. Please provide an enable password.
An enable password must be provided if the username/password do not provide privilege level 15 rights.
A device with specified serial number and model already exists and is in use by different account.
Remove the switch from the existing dashboard network. Steps are available in the Offboarding/Removing Switches from Cloud Monitoring section of this article above.
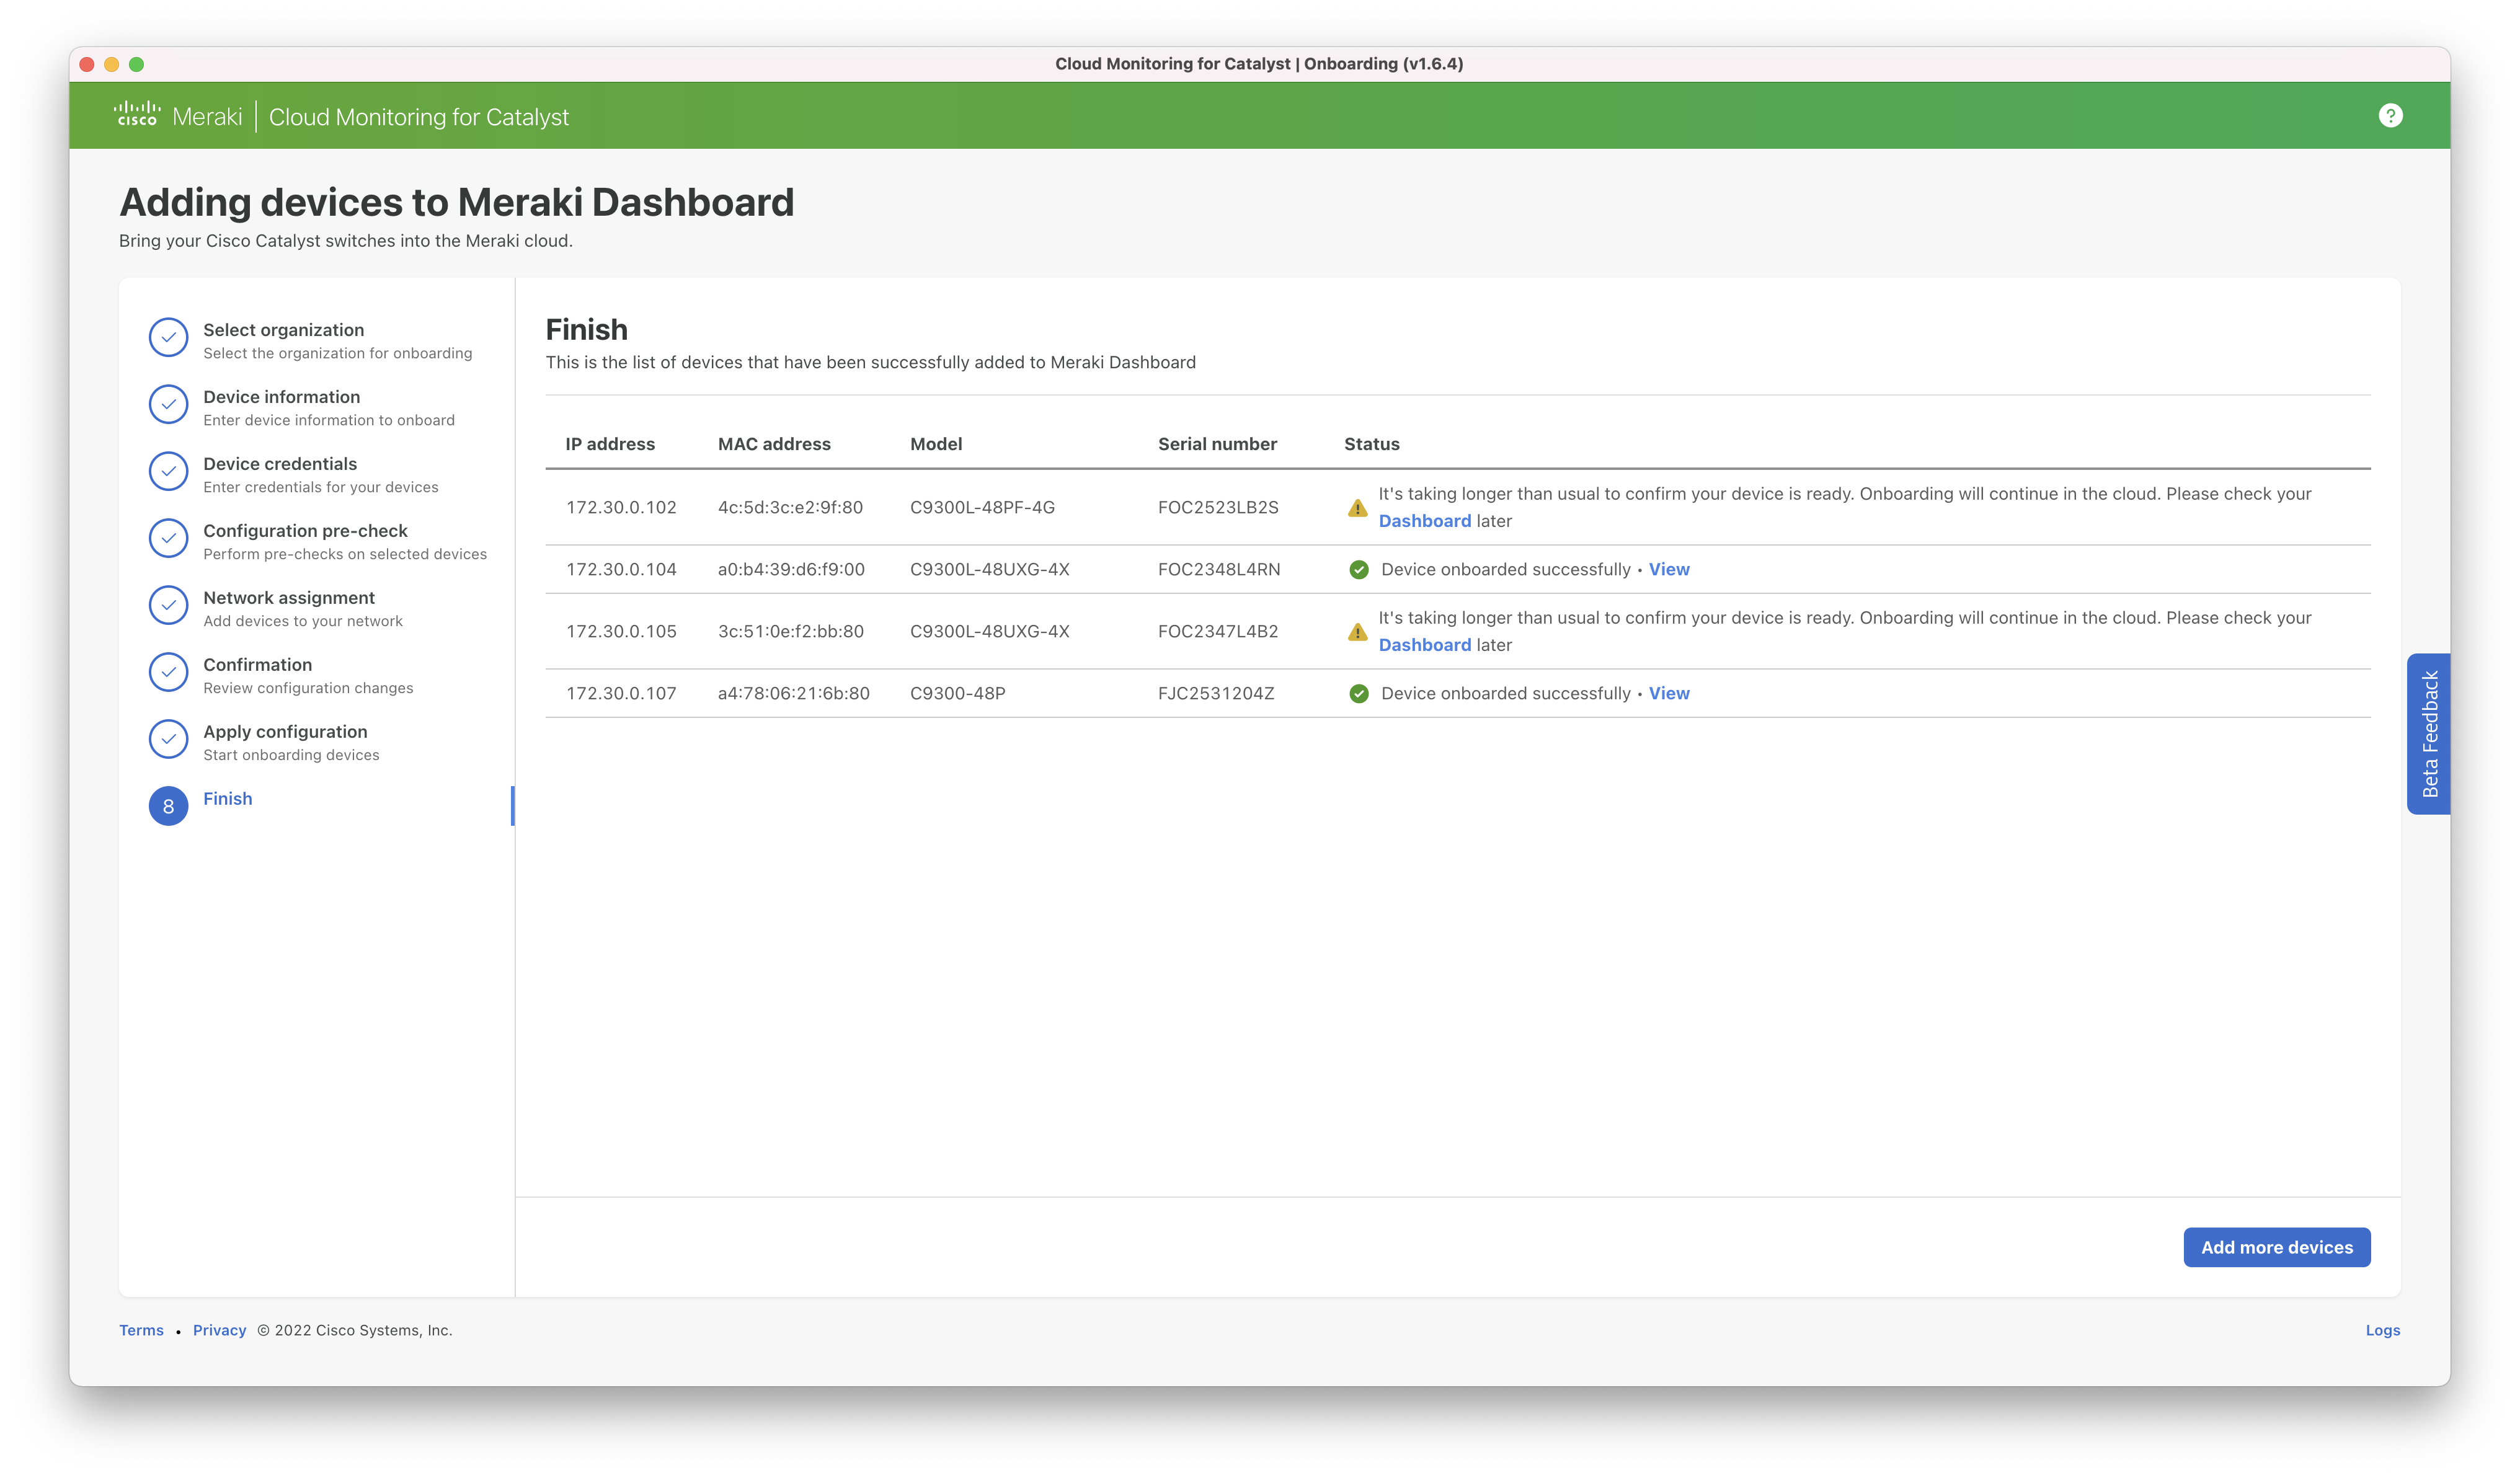
It’s taking longer than usual to confirm your device is ready. Onboarding will continue in the cloud. Please check your dashboard later.
The onboarding process on the switch has been completed, but additional back-end processing in the cloud is required. The switch should be available in the dashboard after 15 minutes. If it does not appear after one hour, attempt onboarding again or contact support.
Device has not established a TLS connection to the cloud.
The TLS connection for the encrypted tunnel could not be established between the switch and the cloud. Review "Ensure reachability" in the pre-onboarding checklist.
Device tried to connect, but the tunnel did not stay up.
The tunnel was established successfully but disconnected before communication could be established. Review the switch log for additional information.
Cloud is not able to connect to the device through the tunnel.
The cloud has attempted to initiate a connection to the device over the tunnel but is unable to establish communication. Review the switch log (show log) on the switch for additional information.
Cloud is not able to login to device.
The cloud is not able to authenticate with the switch using the meraki-user account (MERAKI method list). AAA settings on the switch must permit the meraki-user account to authenticate. Additional information may be available in the switch log.
Cloud is not authorized to access the device.
The cloud has been able to authenticate with the switch using the meraki-user account (MERAKI method list) but is not authorized to access information needed for Cloud Monitoring. AAA authorization settings must allow the meraki-user account to run required commands. Review switch logs for additional information.
Device is connected, but remote access has not been verified.
Review the switch log for additional errors. Onboarding can be attempted again. Contact support if this error does not resolve.
Dashboard Error Messages
It’s taking longer than usual to confirm your device is ready. Onboarding will continue in the cloud. Please check your dashboard later.
The onboarding process on the switch has been completed, but additional back-end processing in the cloud is required. The switch should be available in the dashboard after 15 minutes. If it does not appear after one hour, attempt onboarding again or contact support.
Known Issues/Caveats for Onboarding
AAA/TACACS
-
Configuration of “aaa new-model” must be implemented in configuration prior to running onboarding. This will not be added automatically by the onboarding tool in order to prevent unexpected changes in the authentication process on the network.
The aaa new-model command immediately applies local authentication to all lines and interfaces (except console line line con 0). If a telnet / SSH session is opened to the switch after this command is enabled (or if a connection times out and has to reconnect), then the user has to be authenticated with the local database of the switch. It is recommended to define a username and password on the switch before you start the AAA configuration, so you are not locked out of the switch.
-
RADIUS authentication is not currently supported (yields error 'Device auth mode is not supported')
-
For authorization only (not authentication), local must be first in the list to allow the local Meraki user to have sufficient permissions to establish the tunnel and connect.
-
This change will be presented for review prior to application in the onboarding tool
-
If command authorization is used (via "aaa authorization commands <level> ..."), authorization commands will be added to the cloud connection VTY line: authorization commands <level> MERAKI, where <level> is 0-15 inclusive.
-
HTTPS proxy
-
HTTPS proxies that perform TLS decryption are not currently supported. Both the onboarding tool and the switches enabled for cloud monitoring require direct access to the respective resources on TCP 443. For more detail, review the Cloud Monitoring Overview and FAQ.
Cisco DNA Center deployments
-
Cloud monitoring is not currently supported on switches attached to a Cisco DNA Center appliance. The additional telemetry feeds required for cloud monitoring may conflict with those needed for DNA Center. The onboarding tool will not prevent switches attached to DNA Center from being added for cloud monitoring. However, this configuration has not been fully tested and is not officially supported at this time.
Stealthwatch or other pre-existing NetFlow destination
-
To avoid conflicts or issues when onboarding a switch that has a pre-existing NetFlow configuration, the cloud monitoring NetFlow configuration will not be applied to the device. This means that traffic and application data will not be available in the dashboard.
Onboarding configuration changes
Once the tunnel is established, the cloud back end adds additional configuration to the switch to receive telemetry information. This process occurs automatically and does not require user intervention.
An example of the added IOS-XE configuration is:
! Clean up pre-existing configuration
no crypto tls-tunnel MERAKI-PRIMARY
no crypto pki trustpoint MERAKI_TLSGW_CA
yes
no interface Loopback55
yes

! Removing existing Line VTY Using Same Rotary
no line vty 16 17

! Certificates to trust for Cloud Connectivity
crypto pki trustpoint MERAKI_TLSGW_CA
enrollment terminal
crypto pki authenticate MERAKI_TLSGW_CA
-----BEGIN CERTIFICATE-----
ce1XR2bFuAJKZTRei9AqPCCcUZlM51Ke92sRKw2Sfh3oius2FkOH6ipjv3U/697E
A7sKPPcw7+uvTPyLNhBzPvOk…
-----END CERTIFICATE-----
quit
yes

! Set trustpoint storage location and turn off certificate revocation check
crypto pki trustpoint MERAKI_TLSGW_CA
  enrollment url flash://MERAKI_TLSGW_CA
  revocation-check none

! Create Loopback interface for TLS tunnel overlay
interface Loopback55
description Meraki TLS Connection
exit

! Enable routing (required for Netconf)
ip routing
ip route 18.232.x.x 255.255.255.255 Null 0

! Create local auth group
aaa authentication login MERAKI_VTY_AUTH_N local
aaa authorization exec MERAKI_VTY_AUTH_Z local

! Create ACL for cloud SSH ingress
ip access-list extended MERAKI_VTY_IN
10 permit tcp host 18.232.x.x any eq 2222
20 deny   tcp any any

! Create ACL for cloud telemetry egress
ip access-list extended MERAKI_VTY_OUT
10 permit tcp any host 18.232.x.x eq 2022
20 deny   tcp any any

! Enable SSH to VTY lines
line vty 16 17
  access-class MERAKI_VTY_IN in
  access-class MERAKI_VTY_OUT out
  authorization exec MERAKI_VTY_AUTH_Z
  login authentication MERAKI_VTY_AUTH_N
  rotary 50
  transport input ssh
  exit

! Configure SSH v2 with publickey authentication
ip ssh version 2
ip ssh server algorithm authentication publickey password keyboard

ip ssh port 2222 rotary 50

! Configure a user for SSH and Netconf access
username meraki-user privilege 15 secret 9 $9$1XUfj8vd…
ip ssh pubkey-chain
username meraki-user
key-string
AAAAB3N…
exit
exit
exit

! enable NETCONF YANG globally
netconf-yang

! enable LLDP for non-CDP network discovery
lldp run

! Configure a TLS tunnel for Cloud Connectivity
! Using GigabitEthernet1/0/1 as the preferred source based on the current default route
crypto tls-tunnel MERAKI-PRIMARY
  server url us.tlsgw.meraki.com port 443
  overlay interface Loopback55
  local-interface GigabitEthernet1/0/1 priority 1
  pki trustpoint CISCO_IDEVID_SUDI sign
  pki trustpoint MERAKI_TLSGW_CA verify
  no shut
exit
Example of full change in configuration following onboarding:
aaa authentication login MERAKI local
aaa authorization exec default local
aaa authorization exec MERAKI local
!
!
!
aaa session-id common
!
ip routing
!
device-tracking policy MERAKI_POLICY
security-level glean
no protocol udp
tracking enable
!
!
flow record MERAKI_AVC_HTTP_SSL_IPV4
match application name
match connection client ipv4 address
match connection server ipv4 address
match connection server transport port
match flow observation point
match ipv4 protocol
match ipv4 version
collect application http host
collect application ssl common-name
collect connection client counter bytes network long
collect connection client counter packets long
collect connection initiator
collect connection new-connections
collect connection server counter bytes network long
collect connection server counter packets long
collect datalink mac source address input
collect datalink mac source address output
collect flow direction
collect timestamp absolute first
collect timestamp absolute last
!
!
flow exporter MERAKI_AVC
destination local file-export default
export-protocol ipfix
option interface-table timeout 300
option application-table
option application-attributes
!
!
flow monitor MERAKI_AVC_IPV4
exporter MERAKI_AVC
cache timeout inactive 60
cache timeout active 300
cache entries 65536
record MERAKI_AVC_HTTP_SSL_IPV4
!
flow file-export default
destination 18.232.x.x transport http dest-port 18088 up
file max-size 10
file max-count 2
file max-create-interval 5
crypto pki trustpoint MERAKI_TLSGW_CA
enrollment url flash://MERAKI_TLSGW_CA
revocation-check none
   quit
crypto pki certificate chain MERAKI_TLSGW_CA
certificate ca 06D8D904D5584346F68A2FA754227EC4
  308204BE 308203A6 A0030201 02021006 D8D904D5 584346F6 8A2FA
  0D06092A 864886F7 0D01010B 05003061 310B3009 06035504 06130
  13060355 040A130C 44696769 43657274 20496E63 31193017 06035
...
   quit
!
username meraki-user privilege 15 secret 9 $9$lQXSZ...$
lldp run
!
!
!

crypto tls-tunnel MERAKI-PRIMARY
server url us.tlsgw.meraki.com port 443
overlay interface Loopback1000
local-interface GigabitEthernet1/0/1 priority 1
pki trustpoint CISCO_IDEVID_SUDI sign
pki trustpoint MERAKI_TLSGW_CA verify
interface Loopback1000
description Meraki TLS Connection
ip address 20.0.x.x 255.255.255.255
!
device-tracking attach-policy MERAKI_POLICY
ip flow monitor MERAKI_AVC_IPV4 input
ip flow monitor MERAKI_AVC_IPV4 output
device-tracking attach-policy MERAKI_POLICY
ip flow monitor MERAKI_AVC_IPV4 input
ip flow monitor MERAKI_AVC_IPV4 output
device-tracking attach-policy MERAKI_POLICY
ip flow monitor MERAKI_AVC_IPV4 input
ip flow monitor MERAKI_AVC_IPV4 output
device-tracking attach-policy MERAKI_POLICY
ip flow monitor MERAKI_AVC_IPV4 input
ip flow monitor MERAKI_AVC_IPV4 output
device-tracking attach-policy MERAKI_POLICY
ip flow monitor MERAKI_AVC_IPV4 input
ip flow monitor MERAKI_AVC_IPV4 output
device-tracking attach-policy MERAKI_POLICY
ip flow monitor MERAKI_AVC_IPV4 input
ip flow monitor MERAKI_AVC_IPV4 output
device-tracking attach-policy MERAKI_POLICY
ip flow monitor MERAKI_AVC_IPV4 input
ip flow monitor MERAKI_AVC_IPV4 output
device-tracking attach-policy MERAKI_POLICY
ip flow monitor MERAKI_AVC_IPV4 input
ip flow monitor MERAKI_AVC_IPV4 output
device-tracking attach-policy MERAKI_POLICY
ip flow monitor MERAKI_AVC_IPV4 input
ip flow monitor MERAKI_AVC_IPV4 output
device-tracking attach-policy MERAKI_POLICY
ip flow monitor MERAKI_AVC_IPV4 input
ip flow monitor MERAKI_AVC_IPV4 output
device-tracking attach-policy MERAKI_POLICY
ip flow monitor MERAKI_AVC_IPV4 input
ip flow monitor MERAKI_AVC_IPV4 output
device-tracking attach-policy MERAKI_POLICY
ip flow monitor MERAKI_AVC_IPV4 input
ip flow monitor MERAKI_AVC_IPV4 output
device-tracking attach-policy MERAKI_POLICY
ip flow monitor MERAKI_AVC_IPV4 input
ip flow monitor MERAKI_AVC_IPV4 output
device-tracking attach-policy MERAKI_POLICY
ip flow monitor MERAKI_AVC_IPV4 input
ip flow monitor MERAKI_AVC_IPV4 output
device-tracking attach-policy MERAKI_POLICY
ip flow monitor MERAKI_AVC_IPV4 input
ip flow monitor MERAKI_AVC_IPV4 output
device-tracking attach-policy MERAKI_POLICY
ip flow monitor MERAKI_AVC_IPV4 input
ip flow monitor MERAKI_AVC_IPV4 output
!
device-tracking attach-policy MERAKI_POLICY
ip flow monitor MERAKI_AVC_IPV4 input
ip flow monitor MERAKI_AVC_IPV4 output
device-tracking attach-policy MERAKI_POLICY
ip flow monitor MERAKI_AVC_IPV4 input
ip flow monitor MERAKI_AVC_IPV4 output
device-tracking attach-policy MERAKI_POLICY
ip flow monitor MERAKI_AVC_IPV4 input
ip flow monitor MERAKI_AVC_IPV4 output
device-tracking attach-policy MERAKI_POLICY
ip flow monitor MERAKI_AVC_IPV4 input
ip flow monitor MERAKI_AVC_IPV4 output
device-tracking attach-policy MERAKI_POLICY
ip flow monitor MERAKI_AVC_IPV4 input
ip flow monitor MERAKI_AVC_IPV4 output
device-tracking attach-policy MERAKI_POLICY
ip flow monitor MERAKI_AVC_IPV4 input
ip flow monitor MERAKI_AVC_IPV4 output
device-tracking attach-policy MERAKI_POLICY
ip flow monitor MERAKI_AVC_IPV4 input
ip flow monitor MERAKI_AVC_IPV4 output
device-tracking attach-policy MERAKI_POLICY
ip flow monitor MERAKI_AVC_IPV4 input
ip flow monitor MERAKI_AVC_IPV4 output
device-tracking attach-policy MERAKI_POLICY
ip flow monitor MERAKI_AVC_IPV4 input
ip flow monitor MERAKI_AVC_IPV4 output
device-tracking attach-policy MERAKI_POLICY
ip flow monitor MERAKI_AVC_IPV4 input
ip flow monitor MERAKI_AVC_IPV4 output
device-tracking attach-policy MERAKI_POLICY
ip flow monitor MERAKI_AVC_IPV4 input
ip flow monitor MERAKI_AVC_IPV4 output
device-tracking attach-policy MERAKI_POLICY
ip flow monitor MERAKI_AVC_IPV4 input
ip flow monitor MERAKI_AVC_IPV4 output
device-tracking attach-policy MERAKI_POLICY
ip flow monitor MERAKI_AVC_IPV4 input
ip flow monitor MERAKI_AVC_IPV4 output
device-tracking attach-policy MERAKI_POLICY
ip flow monitor MERAKI_AVC_IPV4 input
ip flow monitor MERAKI_AVC_IPV4 output
device-tracking attach-policy MERAKI_POLICY
ip flow monitor MERAKI_AVC_IPV4 input
ip flow monitor MERAKI_AVC_IPV4 output
device-tracking attach-policy MERAKI_POLICY
ip flow monitor MERAKI_AVC_IPV4 input
ip flow monitor MERAKI_AVC_IPV4 output
device-tracking attach-policy MERAKI_POLICY       |
ip flow monitor MERAKI_AVC_IPV4 input
ip flow monitor MERAKI_AVC_IPV4 output
!
device-tracking attach-policy MERAKI_POLICY
ip flow monitor MERAKI_AVC_IPV4 input
ip flow monitor MERAKI_AVC_IPV4 output
device-tracking attach-policy MERAKI_POLICY
ip flow monitor MERAKI_AVC_IPV4 input
ip flow monitor MERAKI_AVC_IPV4 output
device-tracking attach-policy MERAKI_POLICY
ip flow monitor MERAKI_AVC_IPV4 input
ip flow monitor MERAKI_AVC_IPV4 output
device-tracking attach-policy MERAKI_POLICY
ip flow monitor MERAKI_AVC_IPV4 input
ip flow monitor MERAKI_AVC_IPV4 output
device-tracking attach-policy MERAKI_POLICY
ip flow monitor MERAKI_AVC_IPV4 input
ip flow monitor MERAKI_AVC_IPV4 output
device-tracking attach-policy MERAKI_POLICY       |
ip flow monitor MERAKI_AVC_IPV4 input
ip flow monitor MERAKI_AVC_IPV4 output
!
device-tracking attach-policy MERAKI_POLICY
ip flow monitor MERAKI_AVC_IPV4 input
ip flow monitor MERAKI_AVC_IPV4 output
device-tracking attach-policy MERAKI_POLICY
ip flow monitor MERAKI_AVC_IPV4 input
ip flow monitor MERAKI_AVC_IPV4 output
ip route 18.232.x.x 255.255.255.255 Null0
ip ssh port 2222 rotary 50
ip ssh version 2
ip ssh pubkey-chain
  username meraki-user
   key-hash ssh-rsa 8CDF9A4C836A3D74673...
ip ssh server algorithm authentication publickey password key
!
ip access-list extended MERAKI_VTY_IN
10 permit tcp host 18.232.x.x any eq 2222
20 deny   tcp any any
ip access-list extended MERAKI_VTY_OUT
10 permit tcp any host 18.232.x.x eq 2022
20 deny   tcp any any
logging host 18.232.x.x
!
snmp-server enable traps smart-license
snmp-server enable traps config-copy
snmp-server enable traps config
snmp-server enable traps config-ctid
snmp-server host 18.232.x.x version 2c public
!
      > login local
      > login local
line vty 16 17
access-class MERAKI_VTY_IN in
access-class MERAKI_VTY_OUT out
rotary 50
transport input ssh
line vty 18 19
access-class MERAKI_VTY_IN in
access-class MERAKI_VTY_OUT out
authorization exec MERAKI
login authentication MERAKI
rotary 50
transport input ssh

!
netconf-yang
telemetry ietf subscription 1001
encoding encode-tdl
filter tdl-uri /services;serviceName=sman_oper/control_proce
stream native
update-policy periodic 30000
receiver ip address 18.232.x.x 25103 protocol cloud-nati
telemetry ietf subscription 1002
encoding encode-tdl
filter tdl-transform MERAKI_INTF_STATS_DELTA
stream native
update-policy periodic 30000
receiver ip address 18.232.x.x 25103 protocol cloud-nati
telemetry ietf subscription 1003
encoding encode-tdl
filter tdl-uri /services;serviceName=ios_oper/cdp_neighbor_d
stream native
update-policy on-change
receiver ip address 18.232.x.x 25103 protocol cloud-nati
telemetry ietf subscription 1004
encoding encode-tdl
filter nested-uri /services;serviceName=sman_oper/control_pr
stream native
update-policy periodic 30000
receiver ip address 18.232.x.x 25103 protocol cloud-nati
telemetry ietf subscription 1007
encoding encode-tdl
filter tdl-uri /services;serviceName=ios_oper/platform_compo
stream native
update-policy periodic 30000
receiver ip address 18.232.x.x 25103 protocol cloud-nati
telemetry ietf subscription 1011
encoding encode-tdl
filter tdl-uri /services;serviceName=smevent/sessionevent
stream native
update-policy on-change
receiver ip address 18.232.x.x 25103 protocol cloud-nati
telemetry ietf subscription 1012
encoding encode-tdl
filter tdl-uri /services;serviceName=sessmgr_oper/session_co
stream native
update-policy periodic 360000
receiver ip address 18.232.x.x 25103 protocol cloud-nati
telemetry ietf subscription 1013
encoding encode-tdl
filter tdl-uri /services;serviceName=iosevent/sisf_mac_oper_
stream native
update-policy on-change
receiver ip address 18.232.x.x 25103 protocol cloud-nati
telemetry ietf subscription 1014
encoding encode-tdl
filter tdl-uri /services;serviceName=ios_oper/sisf_db_wired_
stream native
update-policy periodic 360000
receiver ip address 18.232.x.x 25103 protocol cloud-nati
telemetry ietf subscription 1015
encoding encode-tdl
filter tdl-uri /services;serviceName=ios_oper/poe_port_detai
stream native
update-policy periodic 30000
receiver ip address 18.232.x.x 25103 protocol cloud-nati
telemetry ietf subscription 1016
encoding encode-tdl
filter tdl-uri /services;serviceName=ios_oper/poe_module
stream native
update-policy periodic 60000
receiver ip address 18.232.x.x 25103 protocol cloud-nati
telemetry ietf subscription 1018
encoding encode-tdl
filter tdl-uri /services;serviceName=ios_oper/cdp_neighbor_d
stream native
update-policy periodic 360000
receiver ip address 18.232.x.x 25103 protocol cloud-nati
telemetry ietf subscription 1020
encoding encode-tdl
filter tdl-uri /services;serviceName=stkmevent/stkmevent
stream native
update-policy on-change
receiver ip address 18.232.x.x 25103 protocol cloud-nati
telemetry ietf subscription 1021
encoding encode-tdl
filter tdl-uri /services;serviceName=ios_oper/switch_oper_in
stream native
update-policy on-change
receiver ip address 18.232.x.x 25103 protocol cloud-nati
telemetry ietf subscription 1030
encoding encode-tdl
filter tdl-uri /services;serviceName=iosevent/platform_compo
stream native
update-policy on-change
receiver ip address 18.232.x.x 25103 protocol cloud-nati
telemetry ietf subscription 1031
encoding encode-tdl
filter tdl-uri /services;serviceName=ios_emul_oper/entity_in
stream native
update-policy periodic 30000
receiver ip address 18.232.x.x 25103 protocol cloud-nati
telemetry ietf subscription 2002
encoding encode-tdl
filter tdl-transform MERAKI_PORTCHANNEL_STATS_DELTA
stream native
update-policy periodic 30000
receiver ip address 18.232.x.x 25103 protocol cloud-nati
telemetry transform MERAKI_INTF_STATS_DELTA
input table tbl_interfaces_state
  field ipv4
  field name
  field speed
  field if_index
  field description
  field oper_status
  field admin_status
  field phys_address
  field interface_type
  field statistics.rx_pps
  field statistics.tx_pps
  field statistics.in_octets
  field statistics.out_errors
  field ether_state.media_type
  field statistics.in_errors_64
  field statistics.out_discards
  field statistics.in_crc_errors
  field statistics.out_octets_64
  field intf_ext_state.error_type
  field statistics.in_discards_64
  field statistics.in_unicast_pkts
  field statistics.out_unicast_pkts
  field ether_stats.in_jabber_frames
  field statistics.in_broadcast_pkts
  field statistics.in_multicast_pkts
  field statistics.out_broadcast_pkts
  field statistics.out_multicast_pkts
  field ether_stats.in_fragment_frames
  field ether_stats.in_oversize_frames
  field ether_stats.in_mac_pause_frames
  field statistics.in_unknown_protos_64
  field ether_stats.out_mac_pause_frames
  field intf_ext_state.port_error_reason
  field ether_state.negotiated_port_speed
  field ether_state.negotiated_duplex_mode
  field ether_stats.dot3_counters.dot3_error_counters_v2.dot3
  field ether_stats.dot3_counters.dot3_error_counters_v2.dot3
  field ether_stats.dot3_counters.dot3_error_counters_v2.dot3
  field ether_stats.dot3_counters.dot3_error_counters_v2.dot3
  field ether_stats.dot3_counters.dot3_error_counters_v2.dot3
  field ether_stats.dot3_counters.dot3_error_counters_v2.dot3
  field ether_stats.dot3_counters.dot3_error_counters_v2.dot3
  field ether_stats.dot3_counters.dot3_error_counters_v2.dot3
  field ether_stats.dot3_counters.dot3_error_counters_v2.dot3
  field ether_stats.dot3_counters.dot3_error_counters_v2.dot3
  field ether_stats.dot3_counters.dot3_error_counters_v2.dot3
  field ether_stats.dot3_counters.dot3_error_counters_v2.dot3
  join-key name
  logical-op and
  type mandatory
  uri /services;serviceName=ios_emul_oper/interface
operation 1
  output-field 1
   field tbl_interfaces_state.name
  output-field 2
   field tbl_interfaces_state.if_index
  output-field 3
   field tbl_interfaces_state.interface_type
  output-field 4
   field tbl_interfaces_state.description
  output-field 5
   field tbl_interfaces_state.admin_status
  output-field 6
   field tbl_interfaces_state.oper_status
  output-field 7
   field tbl_interfaces_state.speed
  output-field 8
   field tbl_interfaces_state.ipv4
  output-field 9
   field tbl_interfaces_state.phys_address
  output-field 10
   field tbl_interfaces_state.statistics.in_unknown_protos_64
  output-field 11
   field tbl_interfaces_state.statistics.in_octets
  output-field 12
   field tbl_interfaces_state.statistics.out_octets_64
  output-field 13
   field tbl_interfaces_state.statistics.in_errors_64
  output-field 14
   field tbl_interfaces_state.statistics.out_errors
  output-field 15
   field tbl_interfaces_state.statistics.in_unicast_pkts
  output-field 16
   field tbl_interfaces_state.statistics.out_unicast_pkts
  output-field 17
   field tbl_interfaces_state.statistics.in_multicast_pkts
  output-field 18
   field tbl_interfaces_state.statistics.out_multicast_pkts
  output-field 19
   field tbl_interfaces_state.statistics.in_broadcast_pkts
  output-field 20
   field tbl_interfaces_state.statistics.out_broadcast_pkts
  output-field 21
   field tbl_interfaces_state.statistics.in_discards_64
  output-field 22
   field tbl_interfaces_state.statistics.out_discards
  output-field 23
   field tbl_interfaces_state.statistics.tx_pps
  output-field 24
   field tbl_interfaces_state.statistics.rx_pps
  output-field 25
   field tbl_interfaces_state.ether_state.media_type
  output-field 26
   field tbl_interfaces_state.ether_stats.dot3_counters.dot3_
  output-field 27
   field tbl_interfaces_state.ether_stats.dot3_counters.dot3_
  output-field 28
   field tbl_interfaces_state.ether_stats.dot3_counters.dot3_
  output-field 29
   field tbl_interfaces_state.ether_stats.dot3_counters.dot3_
  output-field 30
   field tbl_interfaces_state.ether_stats.dot3_counters.dot3_
  output-field 31
   field tbl_interfaces_state.ether_stats.dot3_counters.dot3_
  output-field 32
   field tbl_interfaces_state.ether_stats.dot3_counters.dot3_
  output-field 33
   field tbl_interfaces_state.ether_stats.dot3_counters.dot3_
  output-field 34
   field tbl_interfaces_state.ether_stats.dot3_counters.dot3_
  output-field 35
   field tbl_interfaces_state.ether_stats.dot3_counters.dot3_
  output-field 36
   field tbl_interfaces_state.ether_stats.dot3_counters.dot3_
  output-field 37
   field tbl_interfaces_state.ether_stats.dot3_counters.dot3_
  output-field 38
   field tbl_interfaces_state.ether_stats.in_mac_pause_frames
  output-field 39
   field tbl_interfaces_state.ether_stats.out_mac_pause_frame
  output-field 40
   field tbl_interfaces_state.ether_stats.in_oversize_frames
  output-field 41
   field tbl_interfaces_state.ether_stats.in_jabber_frames
  output-field 42
   field tbl_interfaces_state.ether_stats.in_fragment_frames
  output-field 43
   field tbl_interfaces_state.ether_state.negotiated_duplex_m
  output-field 44
   field tbl_interfaces_state.ether_state.negotiated_port_spe
  output-field 45
   field tbl_interfaces_state.statistics.in_crc_errors
  output-field 46
   field tbl_interfaces_state.intf_ext_state.error_type
  output-field 47
   field tbl_interfaces_state.intf_ext_state.port_error_reaso
specified
telemetry transform MERAKI_PORTCHANNEL_STATS_DELTA
input table tbl_interfaces_state
  field ipv4
  field name
  field speed
  field if_index
  field description
  field oper_status
  field admin_status
  field phys_address
  field interface_type
  field interface_class
  field statistics.rx_pps
  field statistics.tx_pps
  field statistics.in_octets
  field statistics.out_errors
  field statistics.in_errors_64
  field statistics.out_discards
  field statistics.out_octets_64
  field statistics.in_discards_64
  field statistics.in_unicast_pkts
  field statistics.out_unicast_pkts
  field statistics.in_broadcast_pkts
  field statistics.in_multicast_pkts
  field statistics.out_broadcast_pkts
  field statistics.out_multicast_pkts
  field statistics.in_unknown_protos_64
  join-key name
  logical-op and
  type mandatory
  uri /services;serviceName=ios_emul_oper/interface
operation 1
  filter 1
   condition operator eq
   condition value INTF_CLASS_UNSPECIFIED
   field tbl_interfaces_state.interface_class
   logical-op and
   logical-op next and
  filter 2
   event on-change
   field tbl_interfaces_state.name
   logical-op next or
   logical-op or
  output-field 1
   field tbl_interfaces_state.name
  output-field 2
   field tbl_interfaces_state.if_index
  output-field 3
   field tbl_interfaces_state.interface_type
  output-field 4
   field tbl_interfaces_state.description
  output-field 5
   field tbl_interfaces_state.admin_status
  output-field 6
   field tbl_interfaces_state.oper_status
  output-field 7
   field tbl_interfaces_state.speed
  output-field 8
   field tbl_interfaces_state.ipv4
  output-field 9
   field tbl_interfaces_state.phys_address
  output-field 10
   field tbl_interfaces_state.statistics.in_unknown_protos_64
  output-field 11
   field tbl_interfaces_state.statistics.in_octets
  output-field 12
   field tbl_interfaces_state.statistics.out_octets_64
  output-field 13
   field tbl_interfaces_state.statistics.in_errors_64
  output-field 14
   field tbl_interfaces_state.statistics.out_errors
  output-field 15
   field tbl_interfaces_state.statistics.in_unicast_pkts
  output-field 16
   field tbl_interfaces_state.statistics.out_unicast_pkts
  output-field 17
   field tbl_interfaces_state.statistics.in_multicast_pkts
  output-field 18
   field tbl_interfaces_state.statistics.out_multicast_pkts
  output-field 19
   field tbl_interfaces_state.statistics.in_broadcast_pkts
  output-field 20
   field tbl_interfaces_state.statistics.out_broadcast_pkts
  output-field 21
   field tbl_interfaces_state.statistics.in_discards_64
  output-field 22
   field tbl_interfaces_state.statistics.out_discards
  output-field 23
   field tbl_interfaces_state.statistics.tx_pps
  output-field 24
   field tbl_interfaces_state.statistics.rx_pps
specified