Clients List and Details Page Overview
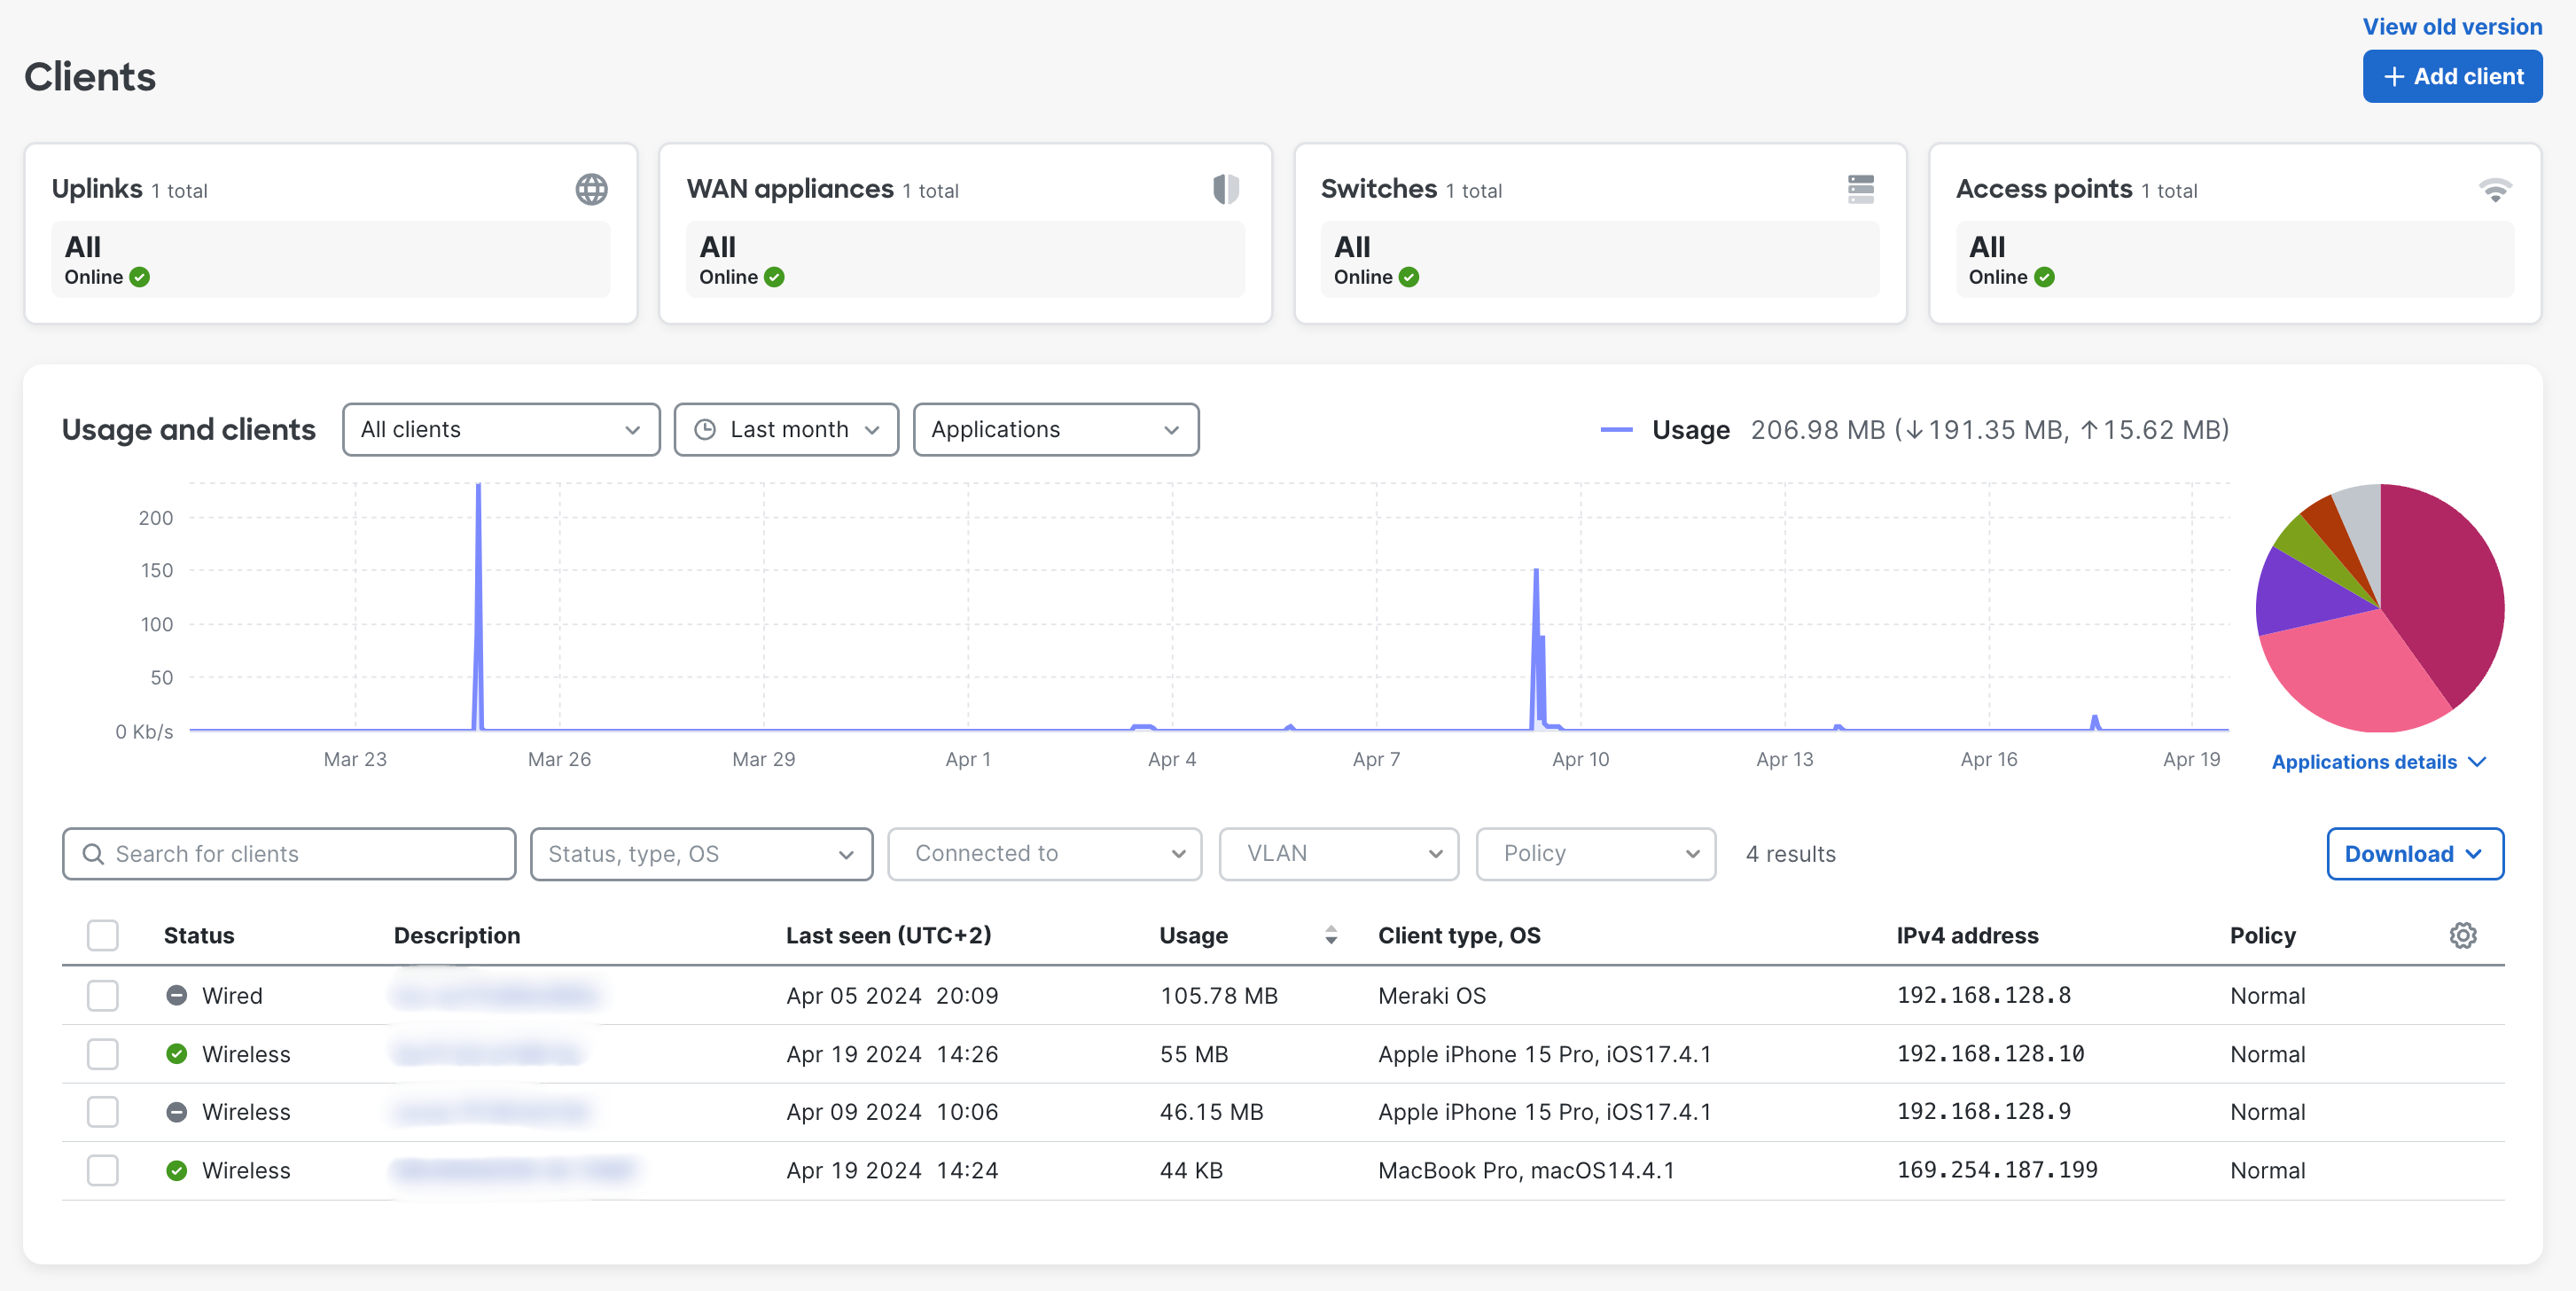
The Cisco Meraki Dashboard offers network administrators the ability to monitor and manage individual network clients, which can be helpful for both administration and troubleshooting purposes. This article overviews the client details page for MR, MS and MX/Z networks. The client lists are all consolidated into Network-wide > Monitor > Clients, which can then be filtered as shown below.
Note: Clients will only show up on the Network-Wide > Monitor > Clients page if they currently passed at least 1 KB of data (excluding splash page traffic). The client list and detailed client information are not updated in real-time. Please allow a few minutes for new clients to appear on the client list and for updates to existing client data to reflect.
Note: For networks that do not use the Unique Client identifier method, Meraki devices in the same combined network will not appear in the Network-Wide > Monitor > Clients list, with the exception of MV devices which has always been considered clients for not playing a role as a network device.
Meraki devices in different networks will appear in Network-Wide > Monitor > Clients list.
For networks using the Unique client identifier tracking method, Meraki Devices in the same network will be shown in the Network-Wide > Monitor > Clients list.
Note: Systems Manager (MDM) networks represent client information differently from Cisco Meraki networking equipment. For more information about Systems Manager, please refer to our SM - Endpoint Management documentation.
Note: For cloud-managed C9000 in device configuration mode, client visibility requires a DNA Essentials license. Application visibility requires a DNA Advantage license
Wireless Client
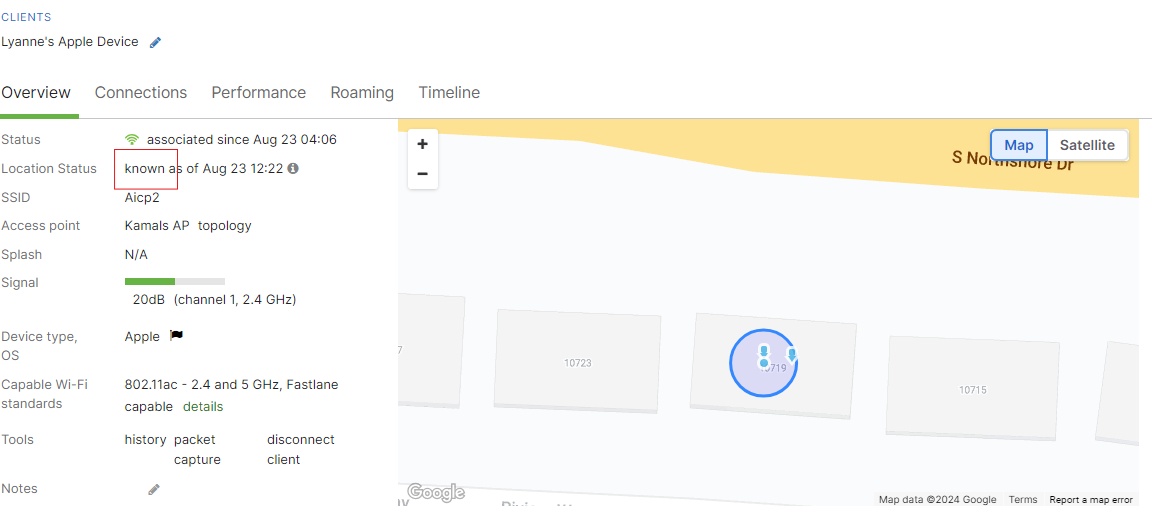
Client Overview page of a device connected to an wireless access point includes a list of client details, the device's connection status, policies, data and applications usage.
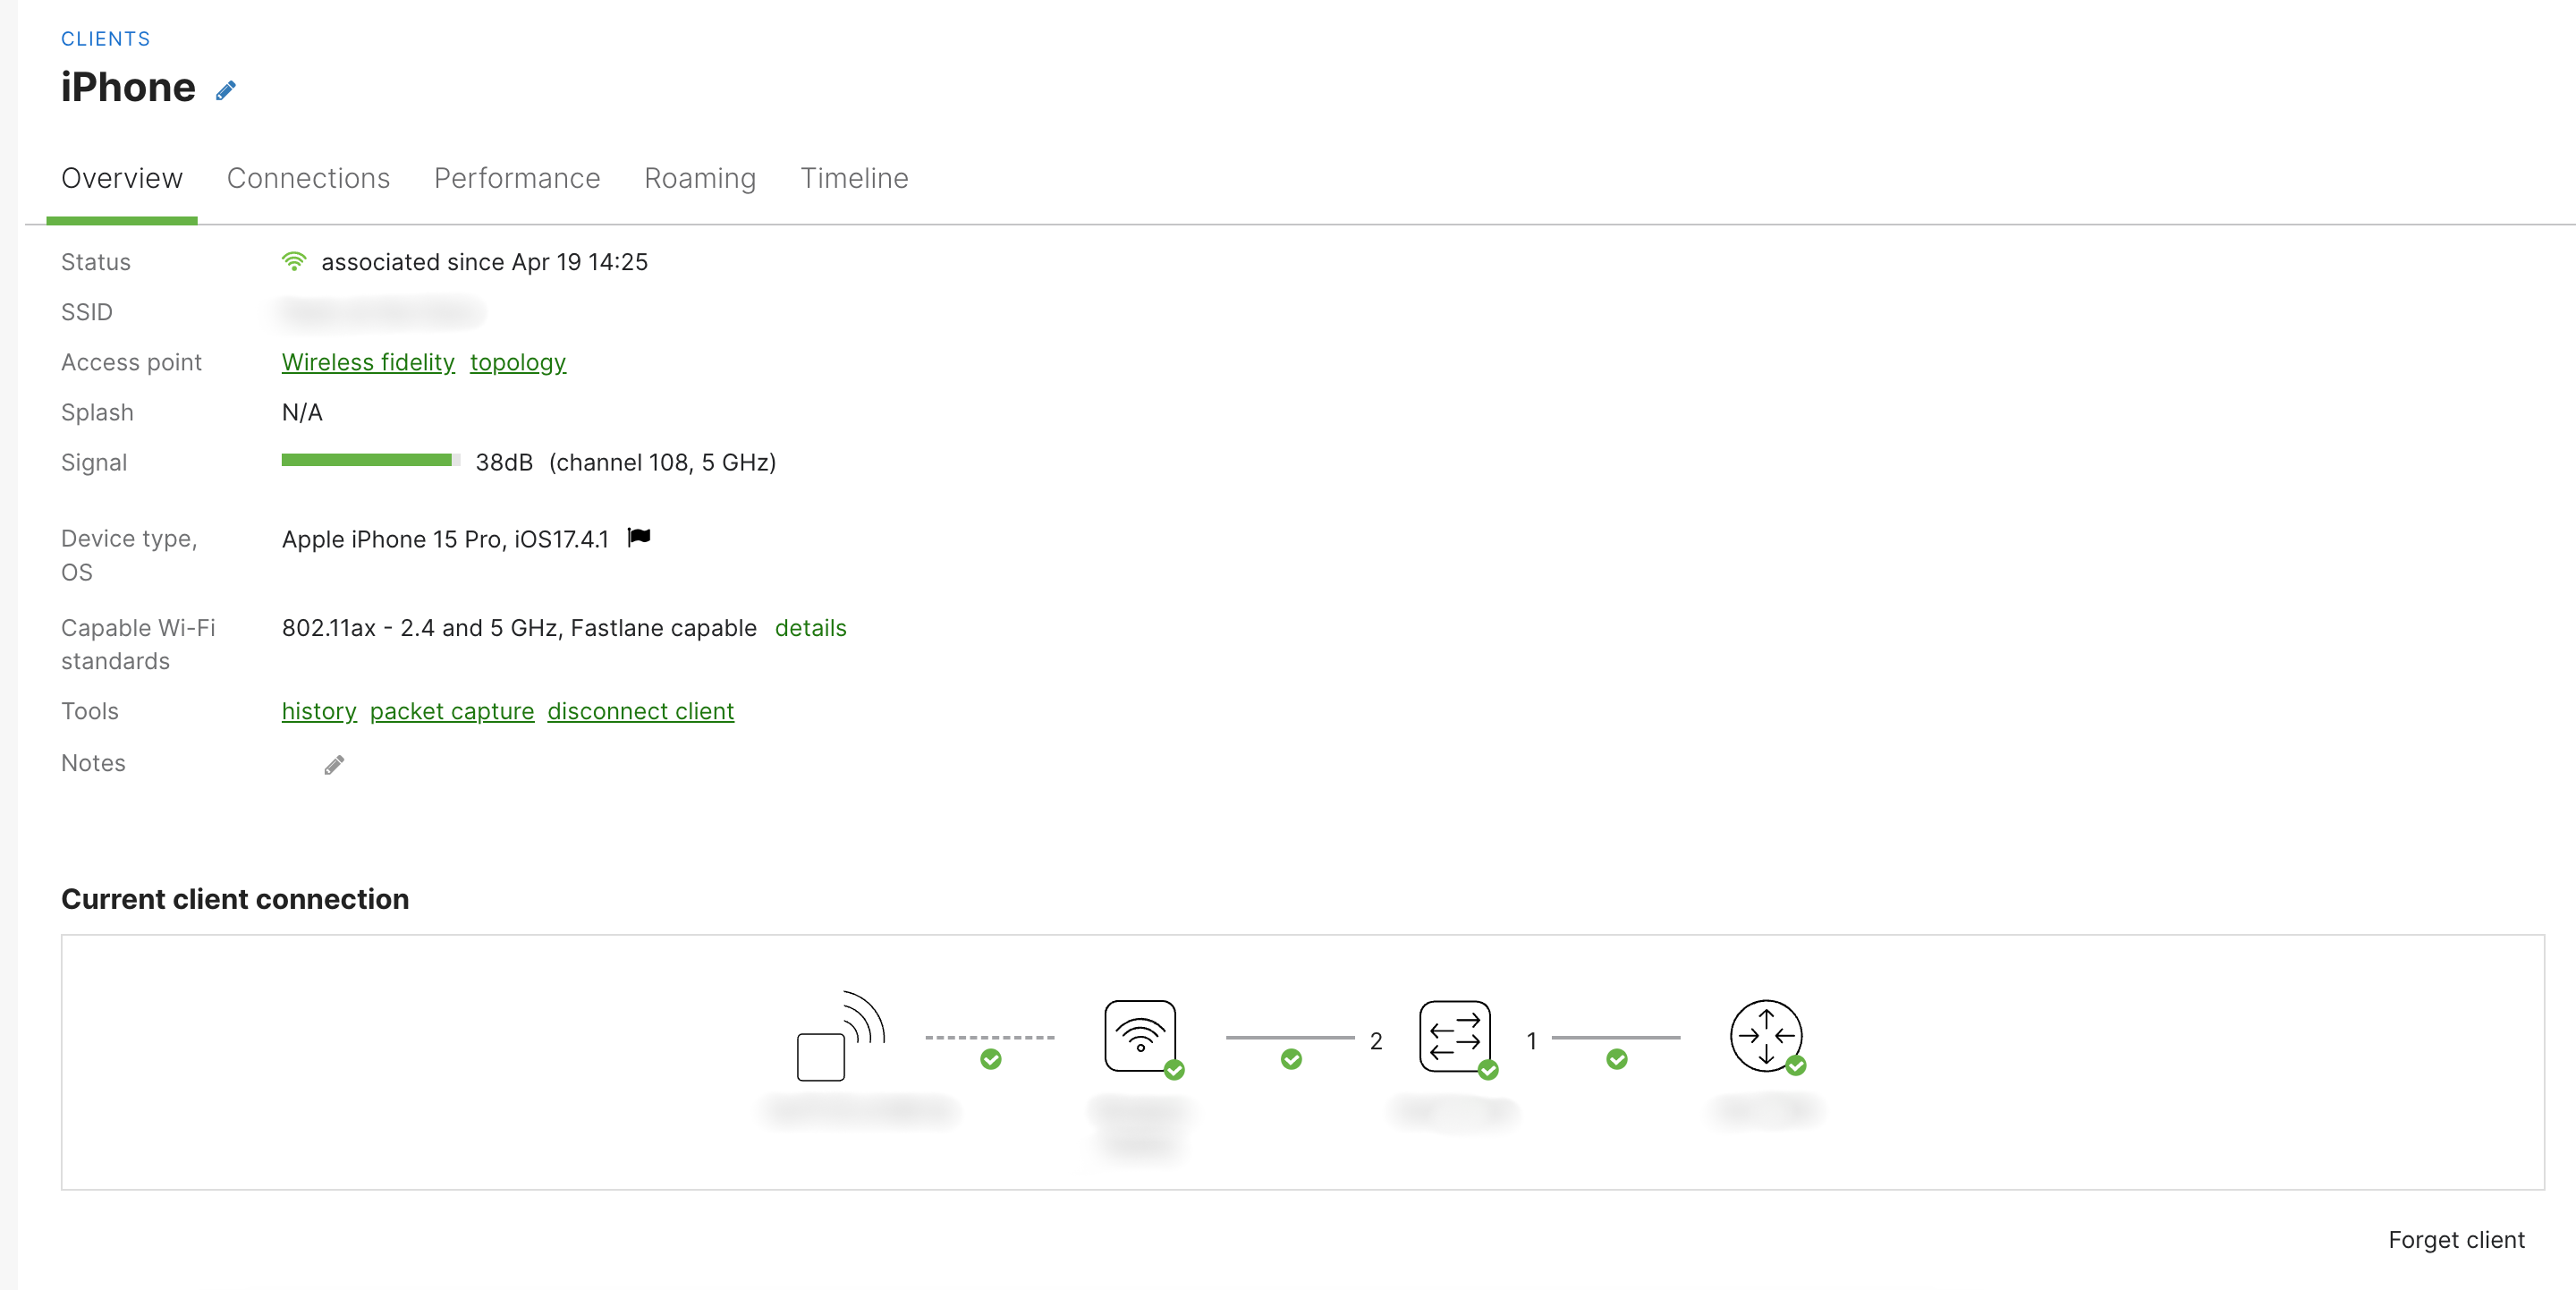
- Status - How long the client has been connected to the wireless network
- SSID - The last SSID the device connected to
- Access point - Which access point the client was last seen associated with
- Splash authorization - Shows the client's authorization to clear the splash page
- Signal - The signal-to-noise ratio of the client's wireless connection
- Channel - What channel the client is associated on
- User - The username the client sent via 802.1X authentication
- Device type - Manufacturer of the client device from the MAC address vendor prefix
- OS - Windows, Mac OS X, Android, iOS, etc (this is based on HTTP user agent strings and DHCP)
- Capable Wi-Fi standards - Includes device's capabilities including channel width, maximum bitrate, spatial streams, 802.11r, fastlane
- Tools:
- History - overview of the clients history in the network
- Packet Capture - redirect to Packet Capture page and have a capture set for the wireless side of the AP set to filter by the Client's MAC address
- Disconnect client
- Notes
- Current client connection - shows a diagram of how the device is connected within the network infrastructure including AP, switch port etc.
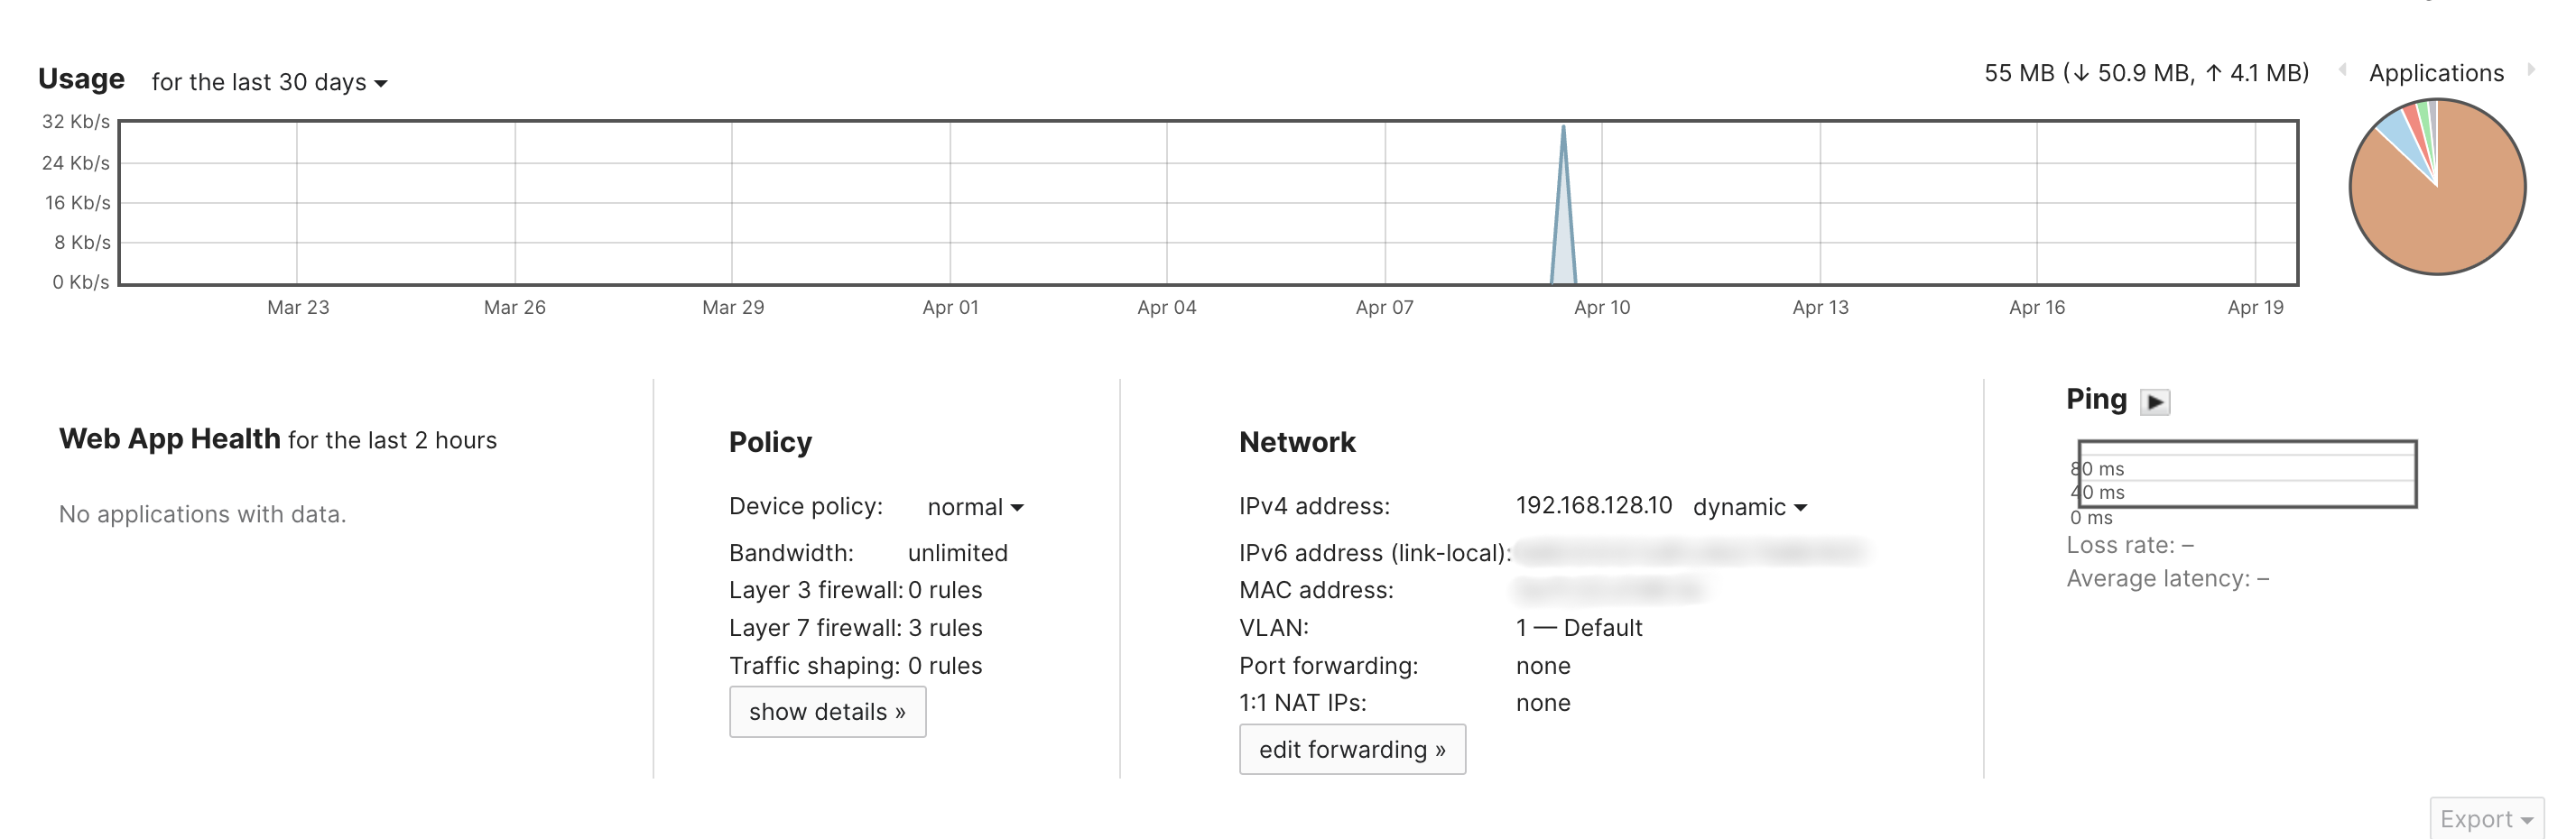
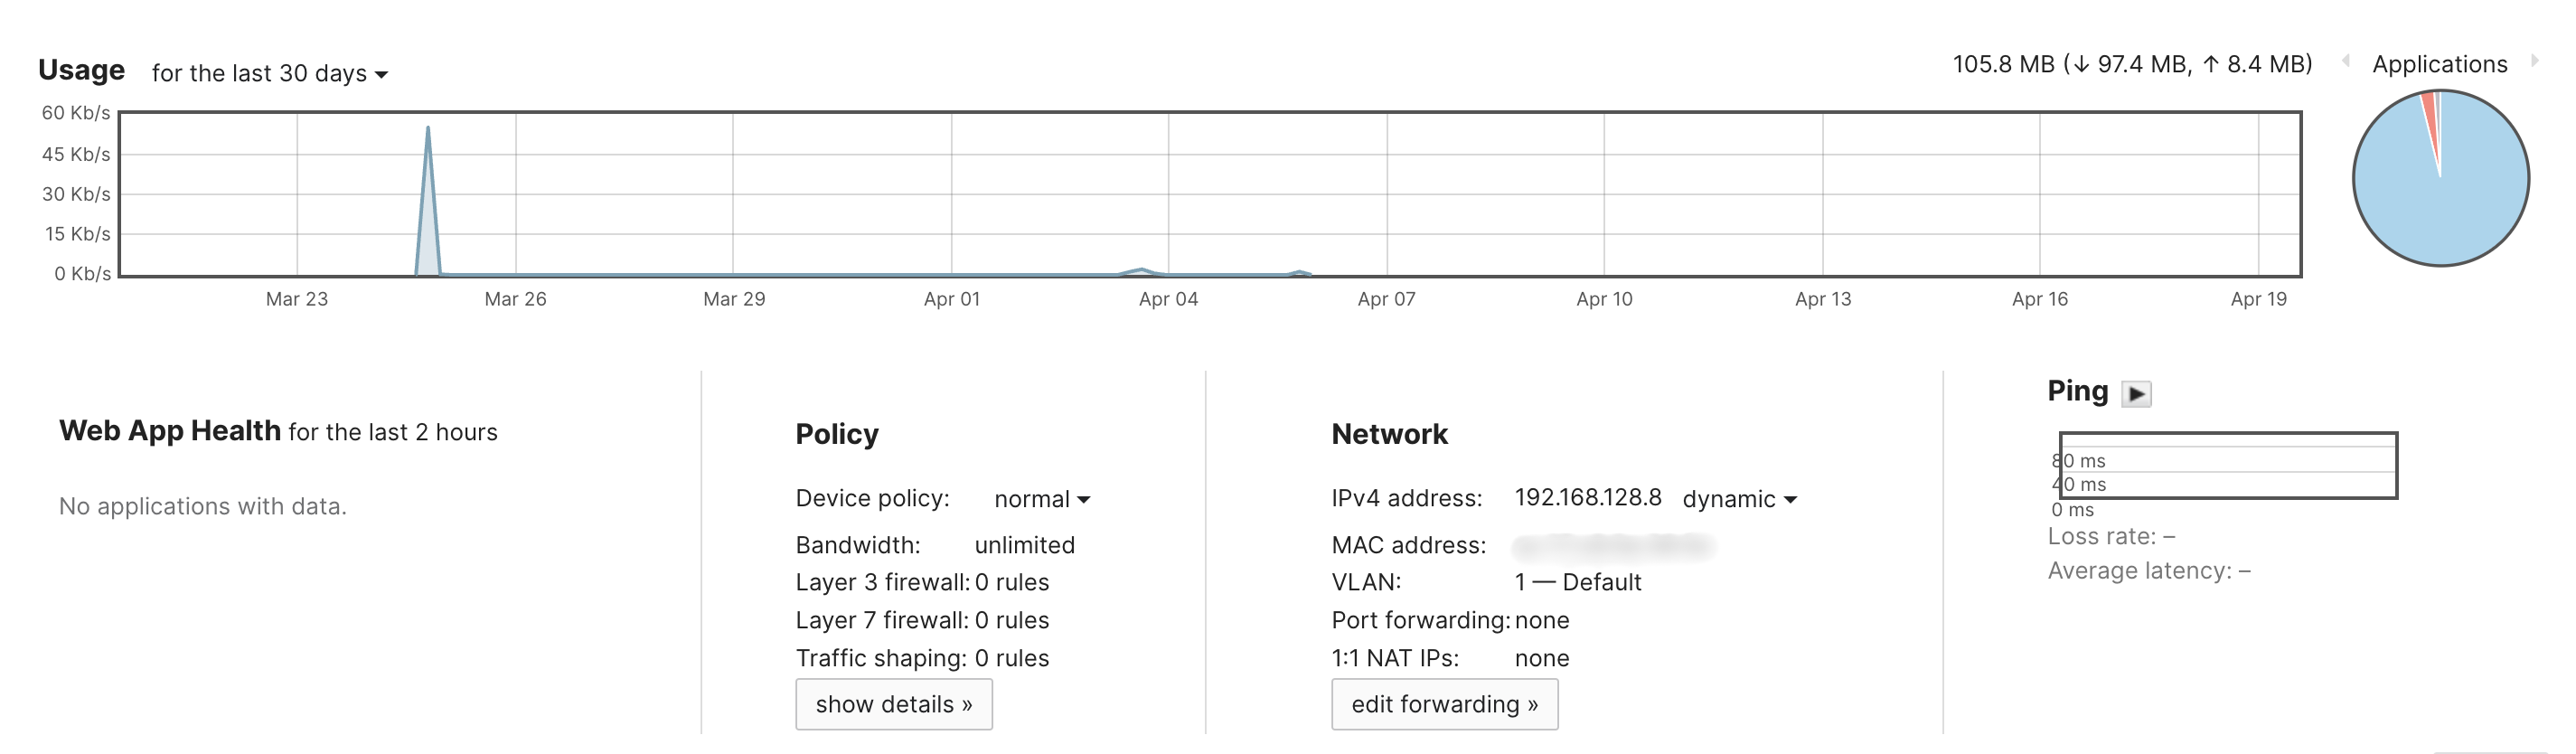
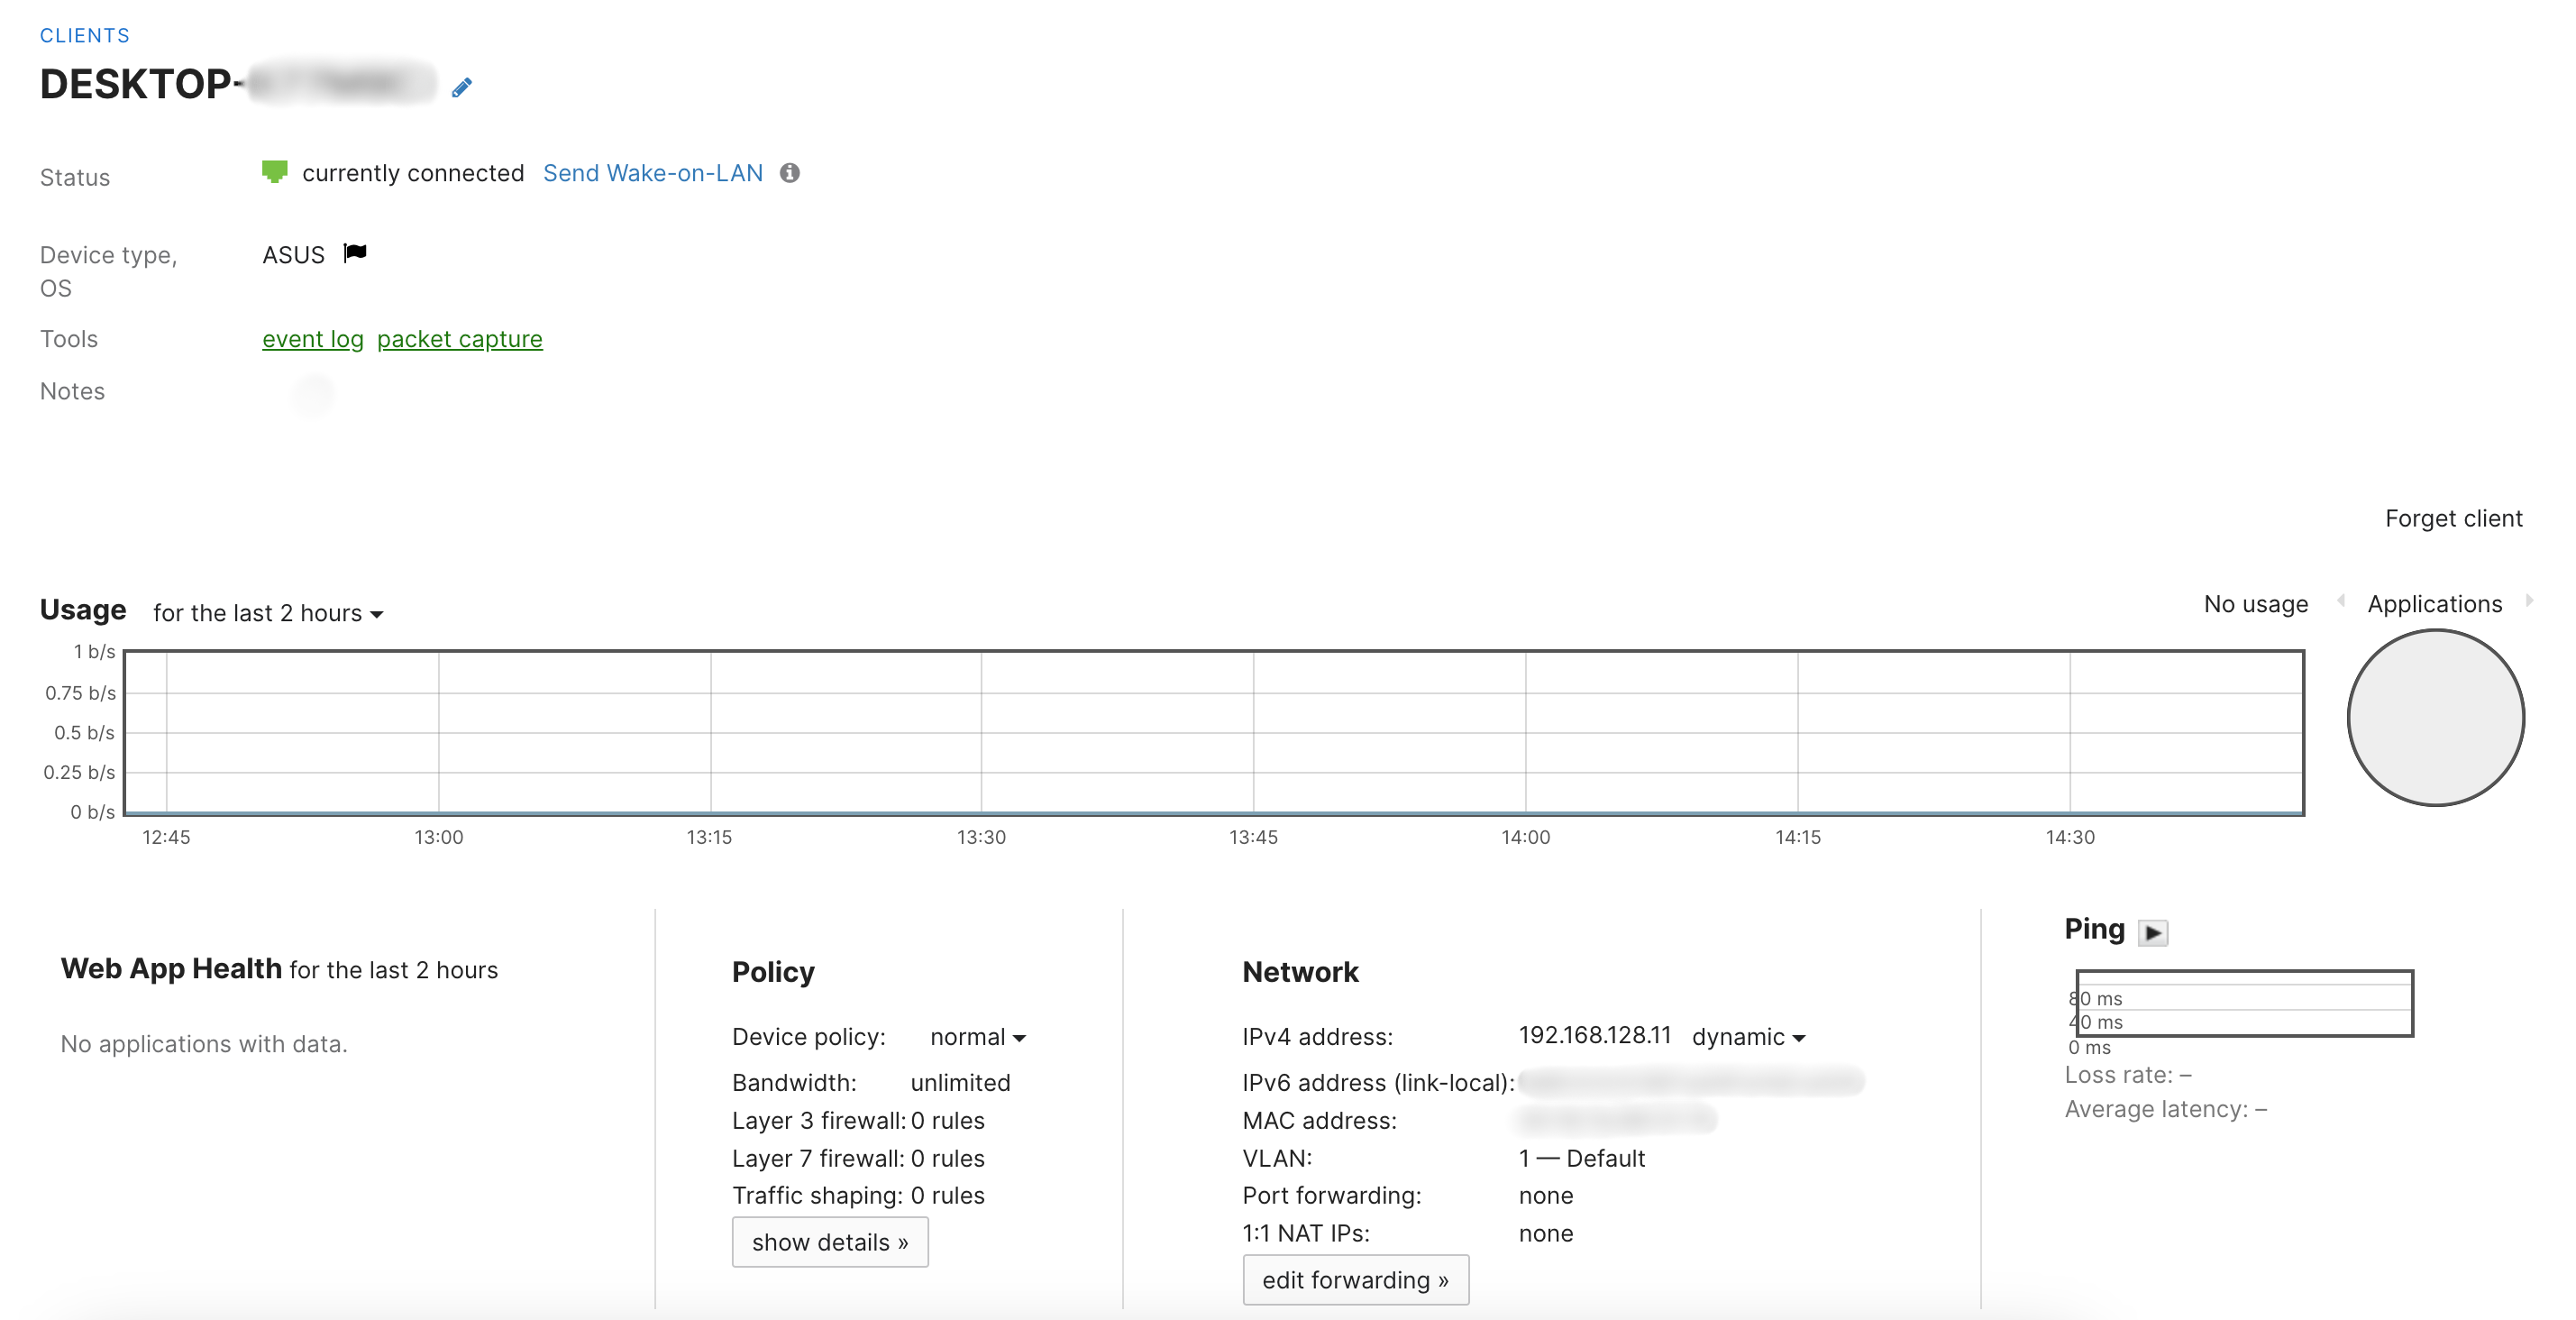
- Usage - An aggregated total of how much upload and download traffic the client has passed on the network in KB/MB/GB/TB.
- Policy - any device policies, bandwidth limitation, Layer 3 or 7 firewall rules, traffic shaping
- IPv4/IPv6 - Assigned IP address of the client device
- MAC Address - The MAC address of the client device in the packets sent from the device
- VLAN
- Port forwarding/NAT
- Ping Client - Initiates ARPing to measure the packet loss and latency from the AP to the connected client
Location Status
Specific to MR clients, Location Status provides clear indicators of whether a client's location is known, inferred, or unknown. This helps administrators quickly assess client location with a level of accuracy.
Known Location
A client’s Location Status is “known” if an AP detects a strong signal in the last hour. In these scenarios, the radius is relatively small. Note, it can change slightly based on the zoom level of the map and the signal strength the AP(s) detected.
Inferred Location
If the Location Status isn’t “known”, Dashboard sees if it can “infer” the client location using the association logs. In these cases, the circle is always a large
radius around the AP that the client associated with and typically occurs when a low signal is detected or the client is disconnected.

Unknown Location
If the Location Status is neither “known” nor “inferred”, the location is set to “unknown.” This often happens because the AP(s) that saw the client don’t have a location set in Dashboard. In these scenarios, it is advised to configure AP placements under Network-Wide > Monitor > Map & floor plans or by providing the AP an address under the AP summary page.

MR 32.1.X New Behavior- Zebra Client Integration
Apart of MR 32.1.x firmware, Zebra client details are now integrated into Dashboard, enabling Zebra devices to report Serial Number, Device Type/Model Number, OS, and Disassociation Reason Codes.
-
Navigate to Network Wide > Clients and select a wireless client.
-
From the table settings enable the Device Type, OS.

The clients page is populated with Zebra clients associated with the wireless network.

Select a specific Zebra client device to see its overview page which shows the connected Zebra device details.

The timeline view displays details on Zebra client connectivity events and performance metrics reported from the AP such as: roaming events, channel assignment, band connection, SNR health, and dissociation insights from the Zebra device.

Wired Client behind switch
Unlike the MR and MX/Z, the MS Client Details Page does not include the ability to edit per-device group policies, but also provides Ping and Wake client tools.
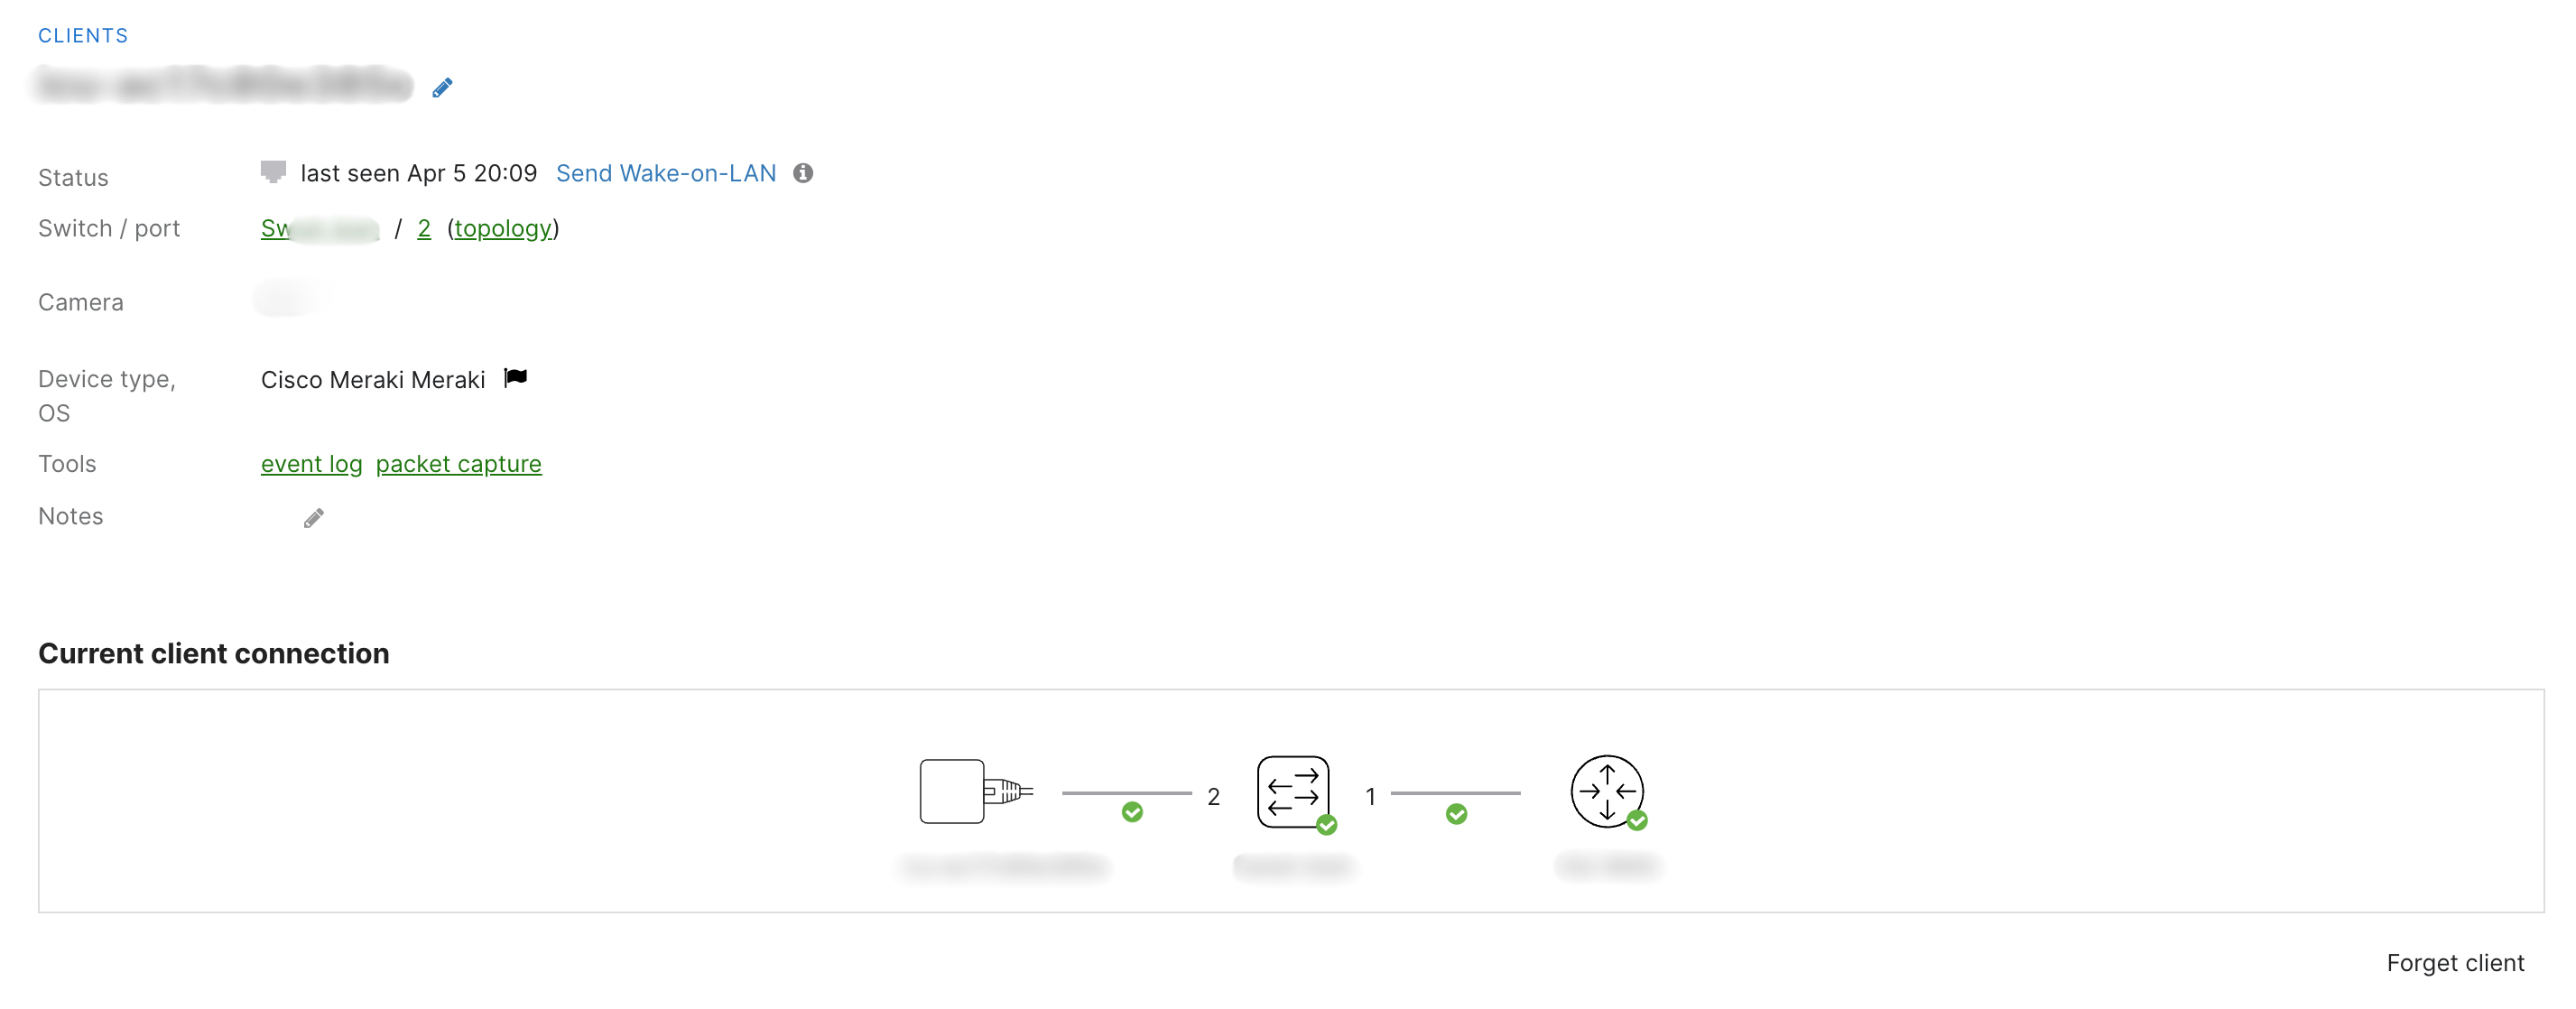
- Status - How long the client has been connected to the network
- Wake-on-LAN
- Switch/port - switch and port to which the client device is (or was last) connected
- User - The username the client sent via 802.1X authentication
- Device type - Manufacturer of the client device from the MAC address vendor prefix
- OS - Windows, Cisco, Mac OS X, Android, iOS, etc (this is based on how the device handles TCP handshakes and DHCP)
- Tools:
- Event log - redirect to the event log page which will be filtered by the client's MAC address in the Switch's event log
- Packet capture - redirect to Packet Capture page with a capture set up on the port the client is connected to
- Notes
- Current client connection - shows a diagram of how the device is connected within the network infrastructure including switch port connections etc.
- Usage - How much traffic the client has passed on the network in KB/MB/GB/TB.
- Policy - any device policies, bandwidth limitation, Layer 3 or 7 firewall rules, traffic shaping
- IPv4/IPv6 - Assigned IP address of the client device
- MAC Address - The MAC address of the client device in the packets sent from the device
- VLAN
- Port forwarding/NAT
- Ping client - Initiates ARPing to measure the packet loss and latency from the AP to the connected client
MX Security Appliance/Z-series Teleworker Gateway
- Status - How long the client has been connected to the network
- Wake-on-LAN
- User - The username the client sent via 802.1X authentication
- Device type - Manufacturer of the client device from the MAC address vendor prefix
- OS - Windows, Cisco, Mac OS X, Android, iOS, etc (this is based on how the device handles TCP handshakes and DHCP)
- Tools:
- Event log - redirect to the event log page which will be filtered by the client's MAC address in the MX's event log
- Packet capture - redirect to Packet Capture page with a capture set up on the Interface the client is connected to
- Notes
- Usage - How much traffic the client has passed on the network in KB/MB/GB/TB.
- Policy - any device policies, bandwidth limitation, Layer 3 or 7 firewall rules, traffic shaping
- IPv4/IPv6 - Assigned IP address of the client device
- MAC Address - The MAC address of the client device in the packets sent from the device
- VLAN
- Port forwarding/NAT - set specific port forwarding or 1:1 NAT rules for the client
- Ping client - Initiates ARPing to measure the packet loss and latency from the AP to the connected client
Additional features
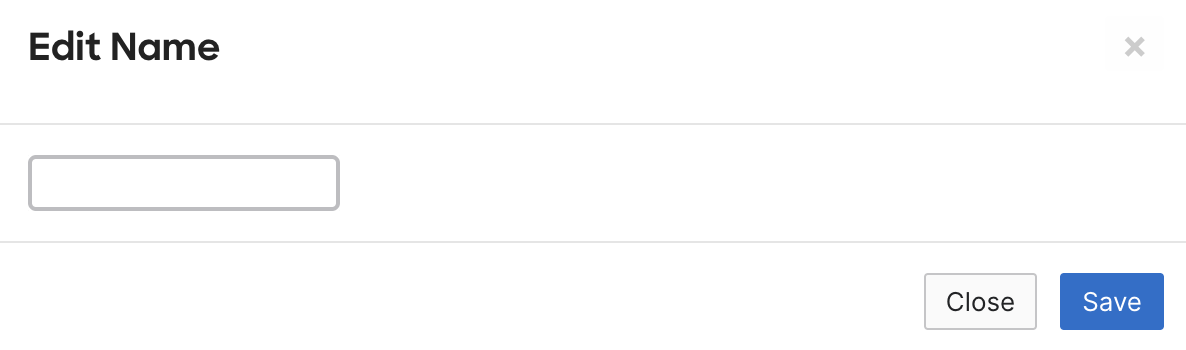
Edit details
Edit details (Pencil icon) option at the top of the Client overview page, next to the Client name can be used to rename the device in Dashboard
Edit policy
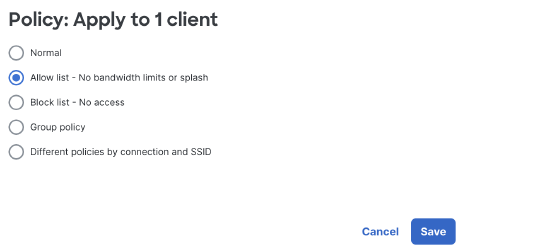
The Clients and Client details pages also includes the Edit policy tool. This allows to change policy on multiple clients or per-client basis.
It includes options like Allow-listing, block-listing, assigning a different group policy or SSID/connection type-based policies. Multiple clients can be checked in and off from the boxes on the left and then click the Edit policy button should appear on the right-hand side.
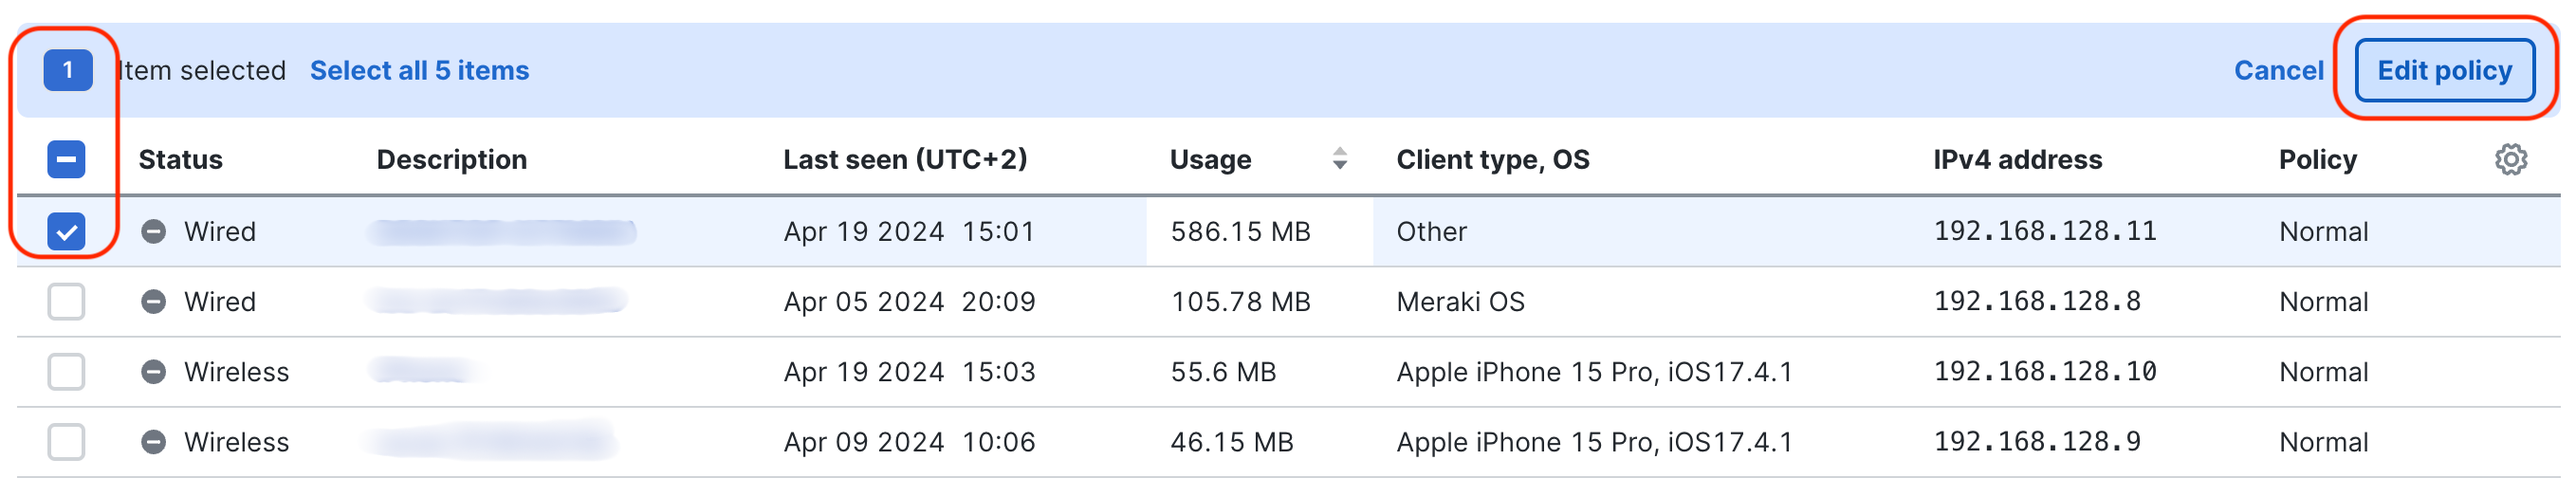
The same policy can then be applied to all the selected client(s). Note: The tool will default to "Normal" upon first opening as selected clients might have different existing policies applied to them.
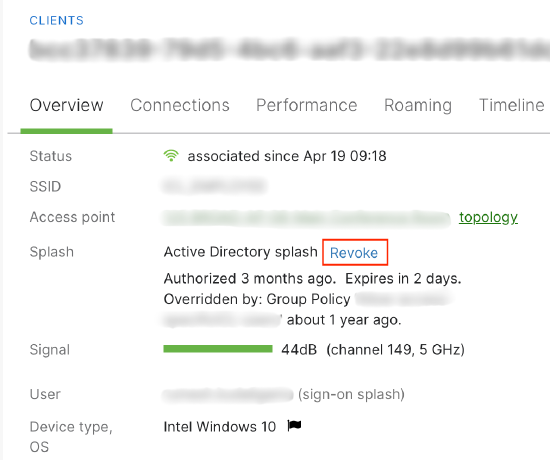
Revoke
The client overview page allows for a client to have its network access authorization removed. The Revoke option will only be available if the device is authorized via a splash page:
Client Data vs Client Usage
The Data sent and received numbers are updated in real-time and are for the interval specified next to the 'Duration:' keyword. The data numbers grow as long as the client is connected and are reset if the client is disconnected from the network for any reason.
The Usage sent and received numbers relate to the selected time interval next to the graph at the bottom of the page. These numbers are updated periodically with the cloud controller and are compounded between disconnects and reconnects.
Note: Depending on the selected time interval, the Client Usage can take around 20 minutes to be compounded and displayed on the Dashboard.
ICMP Echo Request (Ping) vs ARPing
A traditional ping involves sending an ICMP Echo Request message to the IP address provided. If the client receives the packet, and is not configured to block ICMP, it will reply with an ICMP Echo Reply. Once received by the original device, the ping is completed, and a round trip time (RTT) can be calculated which provides an idea of latency between the two devices. ICMP allows reachability testing between both local and remote devices, such as over the Internet or a VPN.
ARPing uses ARP (Address Resolution Protocol) to determine if a local device is on the network. All devices will reply to ARP, making this a more reliable test. It can only be used within the same subnet.
ARPing is only performed on the Network-Wide > Monitor > Clients page details page ping tool. The PING live tool on the Meraki device Tools tab does not support ARPing.
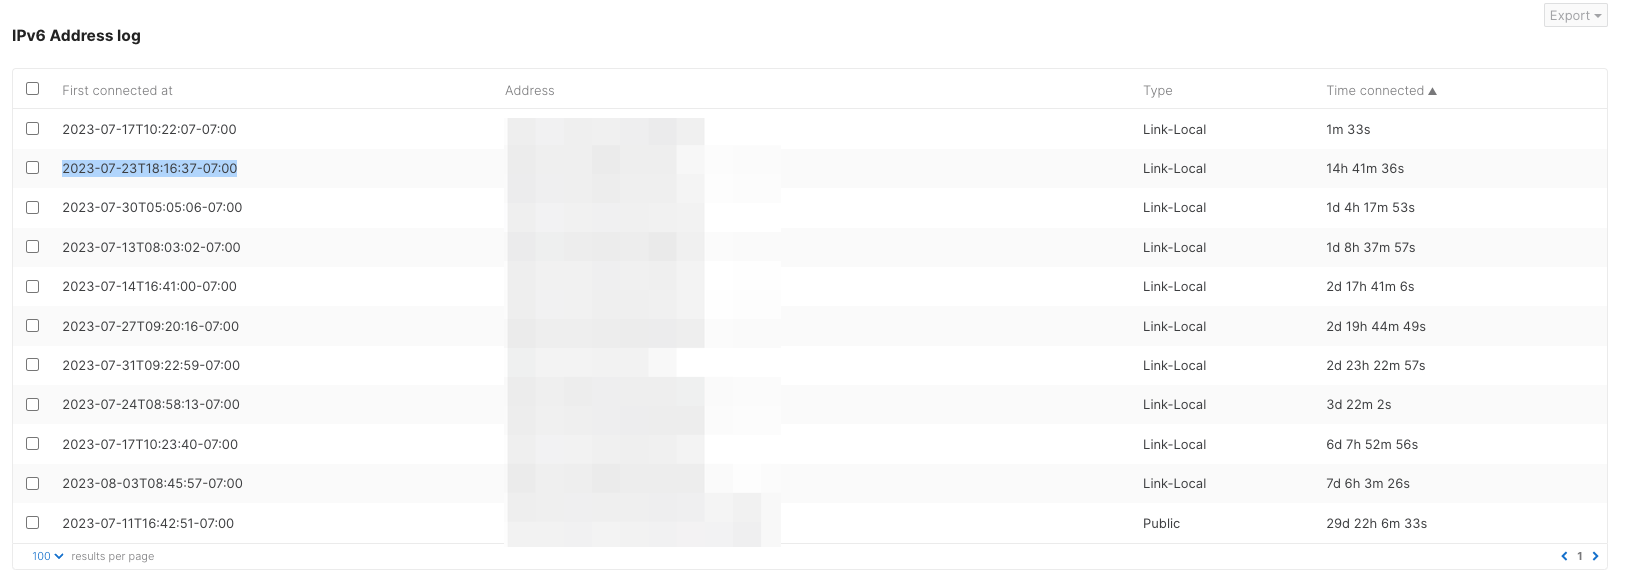
IPv6 Address log
A historical view of a client's IPv6 addresses can be located under IPv6 Address log section which makes it easy to debug issues after the client device changes its IPv6 address. In IPv6, a client interface can have multiple IPv6 addresses due to privacy addresses implementation and this may cause client IPv6 address to rotate per the client's OS implementation. IPv6 Address log section creates a history of all IPv6 addresses and the information can be exported as CSV via the Export button. The information is presented in table format and the description of the columns is below.
- First connected at: The timestamp for when that IPv6 address was detected for this client.
- Address: The IPv6 address that was detected on the network for the client at the specified time.
- Type: Link-Local or Public, depending on the IPv6 address type.
- Time Connected: How long the client was connected and using the particular IPv6 address.