
Root Cause Analysis (RCA) - Alert Based Workflows
Framework Overview
Root Cause Analysis (RCA) workflows help resolve alerts in the Dashboard. New RCAs from different products will be deployed regularly to guide network administrators toward solutions. This document lists the available RCAs and explains their workflows.
How do you engage?
You can start the RCA process from three entry points: the Alert Hub, Device Details Page, and Organization Alerts Page. Use either the Alert Details or Take Action Link/button to open the RCA side drawer workflow. These examples show where you can begin RCA troubleshooting in the Dashboard.


What do you see? (Example images of framework)
Entering the RCA workflow opens a side drawer that guides you through steps for the specific alert. Below the alert title, you will see two tabs: Alert Details and Suggested Actions. Your starting section depends on the link or button you selected, and you can switch between tabs at any time. Each RCA contains product and alert-specific content, but the overall layout stays consistent.


RCA Types
-
Guided RCAs are custom, interactive modular workflows that lead you through troubleshooting steps. Many RCAs include tools and tests that run directly within the module, keeping you focused on the troubleshooting process.
- Standard RCAs contain information such as the alert triggers and common troubleshooting steps. These workflows can also be found in the public documentation available at https://documentation.meraki.com.
New Guided RCA workflows will be added to this list as they are developed. The following workflows are currently available in the Dashboard.
Dismissing Alerts
Sometimes alerts are expected in specific network environments. For example, the "Ethernet Uplink Speed Degraded" alert may appear when a Cat5 Ethernet cable, which supports up to 100 Mbps, connects an MR access point to a 1000 Mbps switch port. If the cable cannot support higher speeds, the alert is a 'false positive' and the network is working as expected. In these cases, dismiss the alert by selecting it and clicking the 'Dismiss' button.


Once an alert is dismissed, it can be viewed under Organization > Monitor > Alerts in the Dismissed tab:

Ethernet Uplink Speed Degraded
Alert Details
Ethernet performance can significantly affect the overall effectiveness of a wireless network. Ethernet connections support various speeds, such as 10 Mbps, 100 Mbps, 1 Gbps, 2.5 Gbps, and 5 Gbps, and can use half or full duplex modes. Connected devices set these parameters through negotiation. If negotiation fails, devices may not reach optimal speed and duplex settings, which can reduce network performance.
Modern Wi-Fi standards such as Wi-Fi 6 and 6E support speeds over 1 Gbps. Wi-Fi 6E access points typically need a minimum Ethernet speed of 2.5 Gbps for effective performance. If an AP’s Ethernet connection is limited to 10 Mbps or 100 Mbps, wireless performance drops. This bottleneck stops the AP from using its full wireless speed, reducing network efficiency and user experience.
The image below shows a trend view of the Ethernet port's current speed. The top line graph uses red highlights to indicate when the AP reported a negotiation failure. This page also displays the number of clients impacted when the alert was first reported. Click on Clients Impacted to see the list of clients connected to this AP. Another trend chart shows the average wireless data rate for all clients connected to the AP during the alert period. Network administrators can assess performance impact and identify bottlenecks by comparing the wireless data rate to the Ethernet uplink data rate.
The alert does not generate in the following scenarios:
- APs use LLDP or CDP to detect if the connected switch port is a Fast Ethernet port.
- AP models that are unable to upgrade to the latest firmware versions.

Guided Troubleshooting Flow
Suggested Actions for AP Ethernet uplink degraded on Cisco Meraki MS Switches:
Troubleshooting in each suggested action works fully only when the AP is connected to a Cisco Meraki MS Switch. Third-party switches do not support active test capabilities, but alert details will display connected third-party switch information and suggested actions.
Ensure you have the necessary network access to perform the suggested actions.
1. Cable Test: This tests the cable and the switch port connection used by the AP.

After you run the cable test, it displays all identified parameters and the results of each test, as shown below.

2. Update link negotiation settings: This action allows the network administrator to set specific speed and negotiation settings on the AP's connected switch port without leaving the suggested action page.

If the switch successfully negotiates and establishes a speed faster than 1 Gbps full duplex, the alert will automatically move to a resolved state.

3. Cycle port on switch: This action turns the switch port off and on, forcing the AP to reboot and restart Ethernet negotiation.
This action temporarily powers down the access point. Run this during a maintenance window.

After the port powers back on, the access point renegotiates its speed. If port cycling sets the correct speed for the AP, the alert will be resolved.

Suggested Actions and Test Assistance for 3rd Party Switches:
1. Cable Test: This tests the cable and the switch port connection used by the AP. The test identifies the uplink switch and prompts you to check for cable damage.

2. Check auto-negotiation in switch port settings: This recommendation is to verify that your switch port is set to auto-negotiation or the correct speed.

3. Cycle port on switch: This recommendation is to power cycle the switch port connected to the access point.

Cyclic Redundancy Check (CRC) Errors Detected
Alert Details
CRC detects errors in transmitted data.
The sending device generates a value from a polynomial division of its data. The receiving device recalculates the CRC value and compares it to the value sent with the data. Matching CRC values mean the data was not corrupted during transmission.
A mismatch between the received and recalculated CRC values signals a CRC error. When the Meraki switch reports CRC errors on the dashboard, it indicates possible data alteration or corruption during transmission.
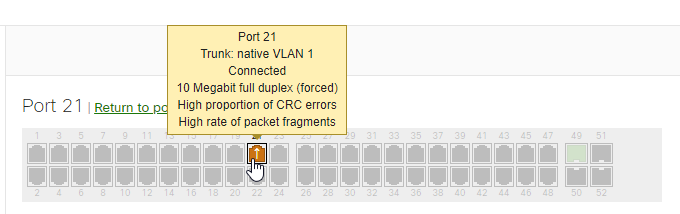
A port experiencing CRC errors could be shown as Red or Amber. Amber  would equate to a High amount of L1 packet errors: port is sending or receiving a high amount (greater than 100 hits/hour or greater than 1% of traffic) of CRC align errors, Fragments, and/or Collisions. Whereas a Red status
  would be related to a Very High amount of L1 packet errors: port is sending or receiving a very high amount (greater than 1000 hits/hour or greater than 10% of traffic) of CRC align errors, Fragments, and/or Collisions.
Guided Troubleshooting Flow
This feature reduces troubleshooting effort, makes issue resolution more intuitive, and saves time. The guided CRC troubleshooting flow automates and outlines suggested actions (refer to flow diagram and the short video below) to resolve CRC error alerts. This tool helps network administrators quickly and effectively find and fix the root cause of CRC errors on switch ports.
The issue or alert appears in several areas, including the switch details page.

The dashboard highlights the issue in the Alert Hub > dropdown. This dropdown will allow you to you troubleshoot the issue from any page. You can view the alert, details, and suggested actions here.
The details section highlights the timeframes within the last two weeks when this alert was triggered.

The suggested actions section will allow you to perform several tasks to resolve the alert.
- The first task is to validate link negotiation between the two devices. If a configuration mismatch is found, you can correct it directly from this dropdown without navigating to each switch and switch port page.

2. If the link negotiation configurations match between the connected devices, the next step is to run a cable test to verify the integrity of the physical cable.
You cannot run the cable test on your uplink port because it will disrupt traffic.

- The dropdown lists more suggestions to help you identify the root cause of the issue.

Unplanned Low Power Mode in Access Points
Alert Details
An Access Point enters low power mode when it does not receive enough power to operate fully. Low power mode starts when the AP does not receive enough power to run all its features. This mode usually results from issues in the physical infrastructure supporting the device.
Risks and Implications
- Potential Risk of Unplanned Resets: The AP is more susceptible to unplanned resets in low power mode, especially under heavy network loads. This occurs because the device struggles to maintain its operations without adequate power, leading to instability and potential disruptions in connectivity.
- Disabled Hardware Features: Several hardware features may be impacted to conserve power. This includes:
- Air Marshal: This security feature uses the access point's dedicated scanning radio to help detect and mitigate rogues and other wireless threats. Disabling the Air Marshal can leave the network vulnerable to security breaches.
- Radios: The AP may shut down one or more of its radios or reduce the number of spatial streams, reducing its ability to provide wireless coverage and handle client connections. This can result in decreased network performance and coverage gaps.
- USB Interface: The GNSS receiver and third-party ESL gateway module could turn off while the AP operates in low-power mode, which would result in losing access to the USB interface's data.
The primary causes of low power mode are usually physical issues, which can include:
- Low-Quality Cables: Substandard Ethernet cables can lead to insufficient power delivery. These cables may not meet the necessary specifications to carry Power over Ethernet (PoE), resulting in power constraints.
- Low PoE Budget: The PoE switch or injector may not provide enough power to support all the AP's features. This can happen if the power budget is not properly calculated or the switch is overburdened with too many connected devices.
- Loose RJ-45 Connections: A loose or improperly connected RJ-45 plug can lead to intermittent power delivery. This can cause AP power supply fluctuations, triggering low power mode.
- Cable Damage: Physical damage to the Ethernet cable, such as cuts, kinks, or excessive bending, can impair the cable’s ability to deliver power effectively. This damage can result from environmental factors or poor installation practices.
Guided Troubleshooting Flow
Suggested Actions for AP Unplanned low power mode on Cisco Meraki MS Switches
You can perform full troubleshooting only if the AP connects to a Cisco Meraki MS Switch. Third-party switches do not support active testing, but alert details can display which third-party switch is connected and suggest next steps.
Network access is required to perform the suggested actions.
- Check the PoE budget on the switch first. This confirms the switch provides enough power for the access point to operate fully.

If the POE budget exceeds, you will see recommendations as shown in the image below.

2. If the link negotiation settings match on both devices, run a cable test to check the physical cable's integrity.
.png?revision=2&size=bestfit&width=650&height=471)
- The next item is to cycle the operation of the switch port where the AP is connected.

- The last option is to capture packets on the Access point port to look for LLDP negotiation failures.

Make sure to have the right admin privileges to run packet capture
Once the Packet capture runs successfully, you should be able to download or view the PCAP right here as shown below.

Refer to the Low power mode KB for more information: https://documentation.meraki.com/MR/Monitoring_and_Reporting/Low_Power_Mode
Suggested Actions and Test Assistance for 3rd Party Switches:
- The first step is to perform a cable test to verify that the connection to the switch is correct.

- This would ask you to check if LLDP configurations are done correctly on the switch.
.png?revision=2&size=bestfit&width=657&height=524)
- Try to power cycle the port of the switch where the AP is connected.

- Check the PoE budget on the switch console to make sure you have enough power available to operate the AP at the minimum required budget.

- Run a packet capture on the AP ethernet uplink to find the LLDP failure negotiations.

High Device Temperature Detected
Alert Details
The detected temperature was higher than expected for the device

Guided Troubleshooting Flow
-
Improve device airflow and surroundings

-
Ensure firmware is up-to-date

-
Address any active memory and CPU alerts

High Device Memory Detected
Alert Details
The detected memory utilization was higher than expected for the device.

Guided Troubleshooting Flow
-
Test network performance using a ping test
-
Test network performance using the Dashboard throughput test

-
Assessing and optimizing network performance and security.


Additional Information
The presence of a high memory alert on networking equipment does not necessarily indicate an issue. Networking devices are often designed to optimize performance by utilizing available memory resources efficiently. High memory usage can be typical during peak operational times or when handling specific data-intensive tasks. It's crucial to evaluate the overall performance and functionality of the device to determine if any corrective action is needed. If the network is operating smoothly without any noticeable performance degradation, the high memory alert may simply reflect normal operational behavior. Regular monitoring and familiarity with the device's memory usage patterns can help distinguish between expected and problematic scenarios.
Access Point Became Repeater
Alert Description
This alert is generated when an AP is suspected to have transitioned to repeater mode unexpectedly, allowing network administrators to easily identify and correct the issue. The following conditions have to be met for the alert to be triggered;
- The AP has been claimed and added to a dashboard network
- The AP is currently operating as a repeater mode AP
- The physical Ethernet link on the AP is up and operational (PoE + Data)
- The AP does not have a Preferred mesh gateway configured on dashboard
- The AP was operating as a gateway AP at some point during the last three weeks

Guided Troubleshooting Flow
Suggested actions for AP became a repeater
-
Set the preferred gateway, if the AP is intended to be deployed as a be a repeater
-
Compare VLAN settings between the two AP PoE ports to resolve configuration issues. Ensure each VLAN provides a valid IP and gateway for the AP and can reach the cloud.
-
Run a cable test (TDR) from the switch if supported to confirm all pairs are intact and correctly placed. If the switch does not support this, physically check the cables, patch panel, and connectors for a healthy connection.Perform a cable test (TDR) from your switch, if capable, to determine if all pairs are intact and in the correct placements else physically validate if the connection (Cables/patch panel/connectors) healthy.
-
Perform a wired packet capture of the switch port the AP is connected to, checking to see the AP is able to obtain an IP address (DHCP), is able to reach its configured gateway, and is attempting to reach the cloud via its Ethernet uplink.
-
Reboot AP
Follow-up should RCA not fix problem
- Reach out to support by opening case for further troubleshooting
Primary Uplink Status
Alert Details
When the primary uplink goes down on an MX Security Appliance, this alert is triggered indicating a change in the primary uplink status.

Guided Troubleshooting Flow
-
Check connectivity

-
Change primary uplink

3. Enhanced WAN failover and failback

Cellular Connection State Change
Alert Details

Guided Troubleshooting Flow
-
This can be checked on dashboard under Appliance status in the middle column which shows up.

2. Check the status of cellular carrier plan and for carrier outages

3. Confirm the device has not been physically moved and there are as few physical obstructions

4. Confirm the antennas are securely attached to the device

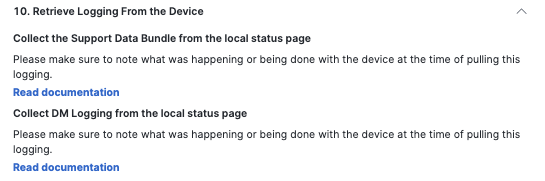
5. Retrieve Logging From the Device

6. Physically Reboot the devices

7. Test the SIM card in another working device with similar cellular capabilities

8. Test with another working SIM card

9. Move the Meraki device to an area where there should be a clearer line of sight to a cellular tower

10. Retrieve Logging From the Device
11. More suggestions

VPN Connection Down
Alert Details

Guided Troubleshooting Flow
1. Check if the WAN appliances are up

2. Check VPN registry connectivity

3. AutoVPN tunnel investigation

4. Validate AutoVPN tunnel is back up
