
Meraki Cloud Sizing and Scaling Considerations and Best Practices
Overview
The Meraki dashboard and the Meraki cloud provide a multitude of methods for interacting with it to manage devices, report network data, and monitor for network-related events. Because of this variety, all customers have more power, flexibility, and efficiency when using the dashboard to keep up with their business. As an organization grows in scale and complexity, it becomes ideal, and sometimes even necessary, to take advantage of these features so that your teams can remain agile, stay informed, and keep ahead of their business, even at scale. This article will describe the many options available for accessing and using the dashboard and Meraki cloud resources, and detail which methods to use for an optimal experience.
Standard Environments
Standard environments will access and use the dashboard in the most accessible ways available, typically by using the dashboard UI. These are organizations where the business needs do not require, or do not allow for, the usage of alternative or additional means of accessing the dashboard. These are environments where the needs of the team, and the company as a whole, are served perfectly well by the dashboard UI and its accompanying features. There may be one or a few areas in which other methods are used or even required, but the majority of the org can be served through the default means.
Flexible Environments
Flexible environments will primarily use more programmatic methods to interface with the Meraki cloud, such as the dashboard API, to administer their Meraki networks. This is most often done in order to address the size of the overall business environment, to maintain efficient management methods, and/or to optimize interaction with the dashboard. They will often use the flexibility and extensibility of the API and other cloud functions to integrate third-party services that will assist with managing and monitoring their networks. This classification can also apply to environments that do not strictly need to use these methods, but that are prepared to do so regardless.
Your organization may fit into different classifications for multiple categories, and that’s okay. These definitions are only guidelines for determining how to use the dashboard and the Meraki cloud for each category, based on how your environment in particular uses that specific aspect of the dashboard.
Device Management with the Dashboard API
Many flexible environments will often leverage the dashboard API for interfacing with their devices, while standard environments would have their needs met by the existing dashboard UI. The flexibility and extensibility of the API allows organizations to effectively tailor their dashboard interactions to their own needs for management and monitoring, to account for things like inter-organization movement of resources, cross-organization configuration adjustments, and holistic monitoring of data across multiple sites.
For more information and details regarding dashboard API access and usage, refer to the documentation article on the Meraki Dashboard API. For detailed API documentation, use cases and examples, visit https://developer.cisco.com/meraki/.
Network & Device Management
For flexible environments with many admins and possibly hundreds of networks and devices, even a relatively simple script can drastically simplify the process of managing configurations across multiple networks and organizations down to a single command. For example, a script to update the SSID name can pull a list of networks and orgs accessible to the API user, and then execute the same SSID command on all orgs and networks, or allow the user to specify which ones to execute the command on.
On the Meraki Developer Hub, a demo project for a python script which manages administrators across organizations details how to install and use the script, as well as providing source code for the script, which can be used as a guide for writing your own scripts.
Another project describes a python script that manages MX firewall rules at scale, also providing source code and methods for installation for use with your own organizations.
Network Automation
For flexible scaled environments requiring regular audits, deploying networks or configuration changes in bulk, or performing other regular repetitive tasks, network and device management can also be automated using the API. It can be used for anything as simple as changing a single record on a scheduled basis, up to complex scripts that are triggered by other automatic processes and which output data to other processes or programs.
A lab on the Meraki Developer Hub walks through the steps to set up Python to automate tasks with the Dashboard API and provides a good starting point for writing your own tools for automation.
For a more advanced example, involving integration with other services, a demo project walks through using ServiceNow to provision Meraki networks, tying in inventory management and touching on the concept of building your own application for more advanced control.
Action Batches
Action Batches are a feature of the dashboard API that let you store multiple actions for an organization in a single API command. This allows for complex chains of related commands to be executed at once, or in order, to simplify the number and variety of calls that need to be made from a script, integration, or solution. This can also be used to help work around issues that may be encountered with the 10 API calls-per-second limitation imposed by the dashboard API endpoints.
For example, adding a switch to a network, configuring all 48 ports, and setting the switch’s management interface in a single POST can be part of one single action batch. Each action batch counts as one call in regard to the 10 calls-per-second limit. For more information on action batches, please reference Cisco's DevNet article on action batches.
Proactive Alerting with Webhooks
Alerts are vital for any network performance monitoring, and any network or organization scaling up needs an equally flexible and scalable way of receiving and responding to these alerts. The dashboard provides all networks with configurable alerts for certain significant network events; Webhooks provide the means to take these alerts and leverage them into actionable items and advanced monitoring data. Webhooks will send alerts to one or more configured HTTPS URLs, in the form of JSON objects; this allows them to be used by any service that can interpret JSON, leading to a wide range of possible integrations.
Integrations do not need to be complicated in order to be useful - for example, this demo project describes logging dashboard alerts to a Google Sheet that can be used to instantly track data and create reports in an accessible manner.
Another easy way to leverage webhooks is for a message to be sent in a collaboration app, such as Cisco WebEx Teams or Slack, when a particular incident occurs. In this example, automation service Zapier relays network alerts to WebEx Teams to notify critical teams of a new incident. Automation services in general can be used to take a variety of actions when a webhook is received, extending the functionality of network alerts.
Organization Management
Organization Administrators
Organizations with admins in the hundreds will be leveraging SAML authentication, possibly with multiple Identity Providers (IdP)s. Multiple SAML roles will be created in the org, to specify who is able to access specific sets of networks and what levels of privileges are available for each role. Manual admins will still be used on the org, but to a more limited degree. The main reason for this is that SAML admins cannot use the Dashboard API, so any API users will need to be standard admins for any orgs being used with the API.
These organizations and accounts will also use the Dashboard API to manage both standard administrators and SAML roles. The Admins endpoint can be used to add, change, or delete a standard admin on one or multiple orgs at once, and the SAML Roles endpoint can be used to get a list of one or more roles on an org, as well as add, change, or delete SAML roles.
For more information on configuring SAML SSO login, refer to the article Configuring SAML Single Sign-on for Dashboard.
Device Limits
Maximum Recommended Scaling Guidelines:
| Item | Limit |
|---|---|
| Total Devices Deployment Size | Unlimited |
| Devices per Organization | 35,000 |
| Devices per Network (standalone and combined) | 5,000 |
Devices per Network limits
| Product Type | Limit |
|---|---|
| MR | 5000 |
| MS | 5000 |
| MT | 1700 |
| MV | 1000 |
| MX | 2 |
| MG | 4 |
| CG | 2 |
| WLC | 2 |
In order to maintain optimal performance while interacting with the Dashboard UI, the total number of Meraki devices in networks across a single organization should stay within these limits. If your organization is approaching these limits as part of standard business operation, there are a few steps that can be taken to ensure these devices can still be managed optimally:
-
Talk with your Meraki account team to discuss an Organization Split, in which part of the networks, devices, and licenses of an organization are split off into a separate dashboard org. This can also help for establishing a scheme for org splits which can act as a guideline to speed up the process of splitting orgs in the future.
-
If a network is approaching or past the recommended per-device network limit, consider cloning the network within the organization and moving devices from one network to the other. This will maintain the network-level configurations while avoiding performance issues at higher numbers of devices in a network.
-
Use the Dashboard API for management of the network, particularly in cases where multiple device-level configuration changes need to be made at once. This can also drastically simplify the process of maintaining configuration sync between two networks or two organizations.
-
If you reach or expect to reach >700 organizations managed, talk to your Meraki account team about ways that this increase in scale can be addressed.
Network-Level Management
SNMP & Syslog
Organizations of both standard size and at scale leverage traditional monitoring protocols like Syslog and SNMP for both system and network logging purposes, and for reporting statistics on a device, network, and organization level. If your organization at scale will be implementing these technologies, a few considerations should be made:
-
For SNMP, while Meraki devices can be polled directly to access information, the most useful information will be gathered by polling the dashboard using the proprietary Meraki MIB. This allows more detailed information to be gathered on device usage and network utilization; for more information on setting up SNMP, read our SNMP Overview and Configuration guide.
-
Syslog can also be used to store events from the dashboard Event Log for analysis. This bypasses the limitations of the Event Log for storing events in dashboard, by allowing logs to be stored for a longer period of time, past the point where they would no longer show in the Dashboard event log. For more details, read our Syslog Server Overview and Configuration guide.
MX Management
Auto VPN Deployments Across Multiple Organizations
As a scaled organization, it may be necessary to have multiple organizations that all need to leverage secure inter-site communications. Meraki provides a very low-touch solution for establishing VPN tunnels between different MXs for this purpose, called Auto VPN; however, MXs enabled for Auto VPN will only be able to build VPN tunnels with other MXs in the same dashboard organization. Therefore, if VPNs between multiple dashboard organizations are necessary, a few extra configuration steps and design considerations will need to be made to allow for this.
-
Each individual organization should optimally have a hub-and-spoke topology, with one or more hub MXs establishing a larger amount of tunnels to their spokes. This lightens the tunnel and traffic load on smaller MXs, and allows them to stay within their rated limits for numbers of established tunnels, while making VPN access easier to organize.
-
Hub MXs in Auto VPN can participate in routing protocols like OSPF and iBGP, which can be used to dynamically exchange routes between hubs in different organizations. iBGP is able to function on both NAT mode and Passthrough mode MXs, allowing for flexibility within an MX’s routing and VPN configuration.
-
Secure tunnels can be established between hub MXs in different orgs by creating a “non-Meraki” IPSec VPN configuration in each org. These can be configured like any other non-Meraki IPSec VPN, where the tunnel will establish as long as Phase 1 and Phase 2 settings match between each MX.
MS Management
When working with complex Meraki switch networks in multiple environments and managing switches at multiple levels (switch ports, individual switches, switch stacks, switch networks), the dashboard API can simplify the process of making multiple settings changes at all of these levels, automate setting adjustments that need to be made frequently, and cut down on time spent making these changes. Here are some tips that can help make optimize switch interaction and management through the API:
-
Switch port tags can be used to classify individual ports, which can then be used when running API operations to change configuration on ports with a given tag. For example, if you have all of the switch uplink ports tagged “Uplink”, you could run a script that can get all switchports in a network, select only the ports tagged “Uplink”, and then run an operation to add a new allowed VLAN to all selected uplink ports.
-
Switches themselves can also be tagged, meaning any switch-level operation can also be applied to switches with certain specified tags.
-
Action Batches can also reduce the number of API commands that need to be sent for a given set of changes. If a group of ports or switches needs to be updated regularly, the changes made to each one can be made in an action batch. If you’d like to save the action batch for future use, you can set the confirmed parameter to true in the API call.
MR Management
Regulatory Domains
One consideration that needs to be made for any organization operating Meraki access points in multiple countries is the use and management of regulatory domains in each MR network. Regulatory Domains, which dictate the legal restrictions for wireless signal transmission, are different in each nation, and will need to be set explicitly per MR network. Because they are set on a per-network basis, APs in multiple different regulatory domains cannot be in the same dashboard network. Here is how this can be handled by a scaled organization.
-
Organize access points into separate networks by regulatory domain to avoid issues with conflicts.
-
For newly purchased access points, the regulatory domain is set by a combination of the ship-to location, and the IP geolocation of the public IP the AP reports when it first connects to the cloud. Keep this in mind when determining where to ship new access points on purchase, particularly if the APs go through pre-deployment testing in a different location.
-
Even with preparation, your organization may still encounter instances in which an AP needs to be moved to a different network, or across regulatory domains, or otherwise encounter some form of regulatory domain conflict. The article on MR regulatory domains goes into further detail about how to determine the regulatory domain, and how to resolve regulatory domain changes, mismatches and conflicts.
MV Management
MV Network Streaming and Usage Considerations
Streaming Video (regular usage)
- Each camera is constantly using ~50kbps of upstream BW for configuration data, metadata (motion, other detections)
- On top of this, each camera will require a certain bitrate (between 0.5Mbps to 8Mbps) when video is being viewed from that camera
- When cloud streaming, this will be upstream BW requirements
- When cloud streaming, there is effectively no viewing limit
- When locally streaming, this will not be upstream BW requirements
- When creating a video wall, these bitrates add up to the total BW that will be required when viewing the video (we show this estimate on the UI)
- When the tile size is too low, we turn on adaptive bitrate streaming
- Dedicated hardware workstations for viewing video also have hardware requirements
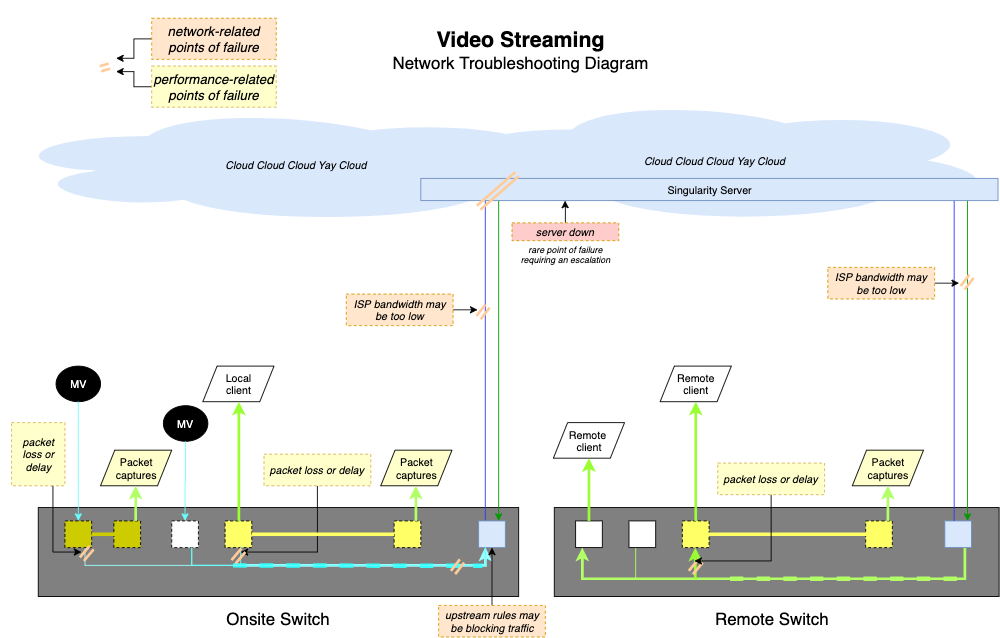
Here's a diagram that can show you the different points of failure when streaming video:
Video Export (regular usage)
- We recommend at least 1Mbps upstream bandwidth per export, since cameras send video to the cloud before they are downloaded as exports
When MV Cloud Archive is Enabled (optional add-on license)
-
At least 1Mbps upstream required per camera when using Cloud Archive
-
External RTSP allows you to access video directly from the camera when on the camera’s local network. The stream will respect the bitrate configured on the dashboard. Note this when enabling external RTSP streams and ensure that your local network can handle the traffic
Video Streaming Limitations
Due to the fact that all Meraki MV cameras will record their footage to solid-state local storage on the camera itself, MV cameras are for the most part very low-bandwidth network devices. The primary exception is when streaming video from the dashboard; this will cause bandwidth usage to increase as video is sent from the camera’s local storage to the streaming client. When viewing a Video Wall, each camera will be streaming their own footage, which can put a burden on the bandwidth of a network depending on the bandwidth capacity and the number of cameras streaming to the video wall. Here are a few considerations to make:
-
If a browser viewing MV video is on the same local network as the cameras being viewed, the cameras will stream directly to the client machine without using any WAN bandwidth. Keep this in mind if you are looking to deploy a security machine for viewing footage, especially for a large local deployment of cameras. For more information on this functionality, read the documentation article on direct streaming vs cloud proxy for cameras.
-
If Cloud Archive is used, camera footage will use network bandwidth whenever the camera is recording for uploading video to the archive. Keep this in mind, particularly with large camera deployments, and plan your WAN bandwidth capacity accordingly. For more information, read the documentation article on the cloud archive feature.
Camera APIs
All second generation (MVx2) cameras are capable of processing powerful analytics on the camera itself and transmitting this metadata to the Meraki cloud. This architecture dramatically reduces the cost and complexity of gathering detailed analytics in any environment. Meraki cameras also include a suite of APIs for accessing these analytics and zeroing in on significant motion events. These tools allow organizations at scale to use their MV cameras as sensors and analysis engines for motion data with any of their organization cameras.
MV Sense
The APIs that make up MV Sense use the machine learning and computer vision processing capabilities of the MV cameras to provide useful high-level statistics to dashboard users and third party applications, such as statistics on people detection, motion analysis, and periods of activity. When managing hundreds or even thousands of camera streams, this can drastically reduce the management overhead by providing your organization only with the most important data provided from each individual camera stream.
The two APIs that can be leveraged are the MV REST API and the MQTT API, both for different kinds of data access. The MV REST API operates the same as the dashboard API, using the same principles, providing data only when requested by a client. These will let you return stats like people detection counters over a given period of time recently or historically. The MQTT API, on the other hand, functions with a publisher-subscriber model, meaning that participating servers can be automatically sent information from the cameras when object/person detection information changes. The combination of these two APIs can be used by third party services to request and log events for data analysis on cameras at virtually any scale.
For more information on MV Sense usage and setup, you can read the documentation on the MV Sense API on the Meraki Developer Hub.
Live Link & Snapshot APIs
Other API calls built into the Dashboard API can provide additional information about cameras, times, and events upon request. The Live Link API call will return a link to the camera called, and if given a timestamp, will return the URL to the camera at that specific time. The Snapshot API call will generate a snapshot image from a camera at a given timestamp and a link to the generated image.
This can be combined with MV Sense to make the camera and video recording aspect of the cameras just as powerful and scalable as the object detection and machine learning aspect. For example, many events from the MQTT API return a timestamp parameter; this can be used to record, for instance, when a person was detected entering the frame, and generate a link to a snapshot of the event, or to the camera at the time of the event in order to review the footage directly. You could also generate one or multiple camera snapshots for an event or time, then send the snapshot(s) to a third-party image processing service that can provide even more detailed analysis of the scene, for more critical instances of motion events or to integrate with other image analysis services being used.
SM Management
For Systems Manager sizing guide limitation, scaling best practices, and deployment recommendations please see Systems Manager Sizing Guide Recommendations.