
How to Configure MX and Z-Series Uplink Settings
Click 日本語 for Japanese
Learn more with these free online training courses on the Meraki Learning Hub:
Overview
This article explains how to configure and monitor uplink settings for Cisco Meraki MX and Z-Series appliances.
All Cisco Meraki appliances require a working internet connection to communicate with the Meraki dashboard and cloud management. The Uplink tab lets an administrator configure a WAN interface for internet connectivity and monitor uplink status for MX and Z-Series appliances.
To access the Uplink tab:
- For MX appliances, go to Security & SD-WAN > Monitor > Appliance status.
- For Z-Series teleworker gateways, go to Teleworker gateway > Monitor > Appliance status.
Public IP
The Public IP is the IP address that the Meraki cloud sees when it receives communication from the MX appliance and Z-Series devices.
For more information on troubleshooting the public IP, refer to Devices Showing an Incorrect Public IP.
Prerequisites
- A working internet connection for the MX or Z-Series appliance.
- Administrator access to the Meraki dashboard, or access to the local status page when the appliance is offline.
- For /31 subnets on WAN uplinks, firmware version 14.24 or higher.
- For embedded cellular failover, an MX67C or MX68CW appliance.
- For a secondary WAN on MX models with dual-purpose WAN/LAN interfaces, a port that can be converted to an Internet port.
Step-by-step instructions
For IOS XE based Cisco Secure Routers when configuring a combination of static & dynamic addressing, ›DNS shall be appended to the existing list. In a scenario where DNS is provided by both static and dynamic configurations, the primary DNS shall be the static entry with the dynamic entry being secondary.
Configure the WAN interface
The WAN IP address is what the MX uses on its WAN (internet) interface to communicate with the Meraki dashboard and to run connectivity tests that monitor uplink status.
To configure the WAN interface:
-
Select the edit (pencil) button to the right of the WAN section.
-
Configure the interface for DHCP to obtain an IP address dynamically, or select Static IP to enter the IP address manually.
For static IP configuration details, refer to Static IP Assignment.
MX supports the use of /31 subnets for WAN uplinks on firmware versions 14.24 or higher.

Configure the secondary WAN (WAN 2)
All MX security appliances feature either a dual-purpose or a dedicated secondary WAN interface.
- On MX models with a dedicated secondary WAN interface, WAN 2 is ready to use once you configure it in the dashboard and connect a physical uplink.
- On MX models with dual-purpose WAN/LAN interfaces, convert the dual-purpose port to an internet port before configuring it as WAN 2.
To configure the secondary WAN:
-
Go to Security & SD-WAN > Monitor > Appliance status and open the Uplink tab.
-
Select Add another WAN port.
Alternatively, switch the port role to the Internet option on the local status page.
For more information, refer to Enabling and Configuring WAN 2.

When configuring the secondary uplink, keep the current dashboard connectivity state of the MX in mind. If the MX is already online and connected to the cloud, apply the secondary uplink configuration through the dashboard. If the MX is not currently online, apply this configuration on the local status page.
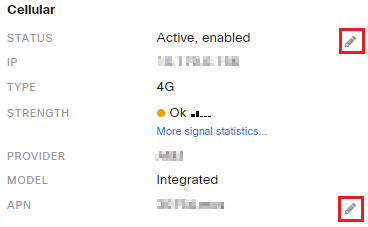
Configure cellular failover
The MX67C and MX68CW have an embedded LTE module for cellular failover connections.
To configure cellular:
- Select the edit (pencil) button next to Status.
- Select Enabled.
For more information on configuring integrated cellular interfaces, refer to the MX67/MX68 Installation Guide
Configure the hostname (DDNS)
The security appliance uses Dynamic DNS (DDNS) to update its DNS host record automatically each time its public IP address changes.
To configure DDNS:
- Go to Security & SD-WAN > Monitor > Appliance status.
- Select the pencil icon next to Hostname, located between the WAN IP and Serial Number on the left of the page.
For more information, refer to Dynamic DNS (DDNS).

Verification
Check uplink status
The MX reports the current status of its uplink interfaces in two places:
- Under Security & SD-WAN > Monitor > Appliance status > Uplink, next to the Status section.
- Under the WAN1, WAN2, or Cellular section on the left of the Security & SD-WAN > Monitor > Appliance status page.
WAN uplink statuses:
- Active — The WAN interface is healthy and is currently sending client traffic.
- Ready — The WAN interface is not in use but is awaiting failover from the primary uplink configured under Security & SD-WAN > Configure > SD-WAN & traffic shaping > Primary uplink. To configure an active-active load-balancing state, refer to Load Balancing.
- Failed — The link cannot establish a connection to the Meraki cloud.
- Disabled — The WAN port is disabled from the Uplink tab.
- Not Connected — The WAN interface is enabled, but no cable is connected or the cable is not detected.
For more information on troubleshooting inactive uplink states, go to the Troubleshooting section.
The MX appliance and Z-Series devices use Connection Monitoring tests to determine whether the link is healthy. For detailed information on these tests, refer to Connection Monitoring.
Cellular interface statuses:
-
Active — The MX-Z detected a WAN failover and switched the internet connection to the cellular interface.
-
Ready — The MX-Z established the connection with the 3G/4G provider and successfully sent and received data with the Meraki dashboard from the cellular interface. The MX-Z is ready for failover to the 3G/4G connection.
-
Connecting — The modem/SIM is recognized and the MX-Z is actively attempting to establish a persistent connection with the 3G/4G provider. For troubleshooting a cellular uplink stuck at connecting, refer to MX67 and MX68 Overview.
For more information on cellular modem states and cellular failover, refer to 3G/4G Cellular Failover.
Review live data
The live data graph provides a real-time view of the uplink traffic passing through the MX to and from the uplink interface. The graph breaks total and download traffic into two separate, color-coded lines.

Because this is a constant live stream, you can pause it by selecting the Pause button on the right side.
When there are two WAN links, one color shows WAN 1 and the other shows WAN 2.

Review historical data
This section provides retrospective information on the latency and loss of the active internet uplinks over the specified time range to the selected destination IP address (8.8.8.8 by default).
If both internet uplinks are used, their test results map individually with color-coded lines on the same graph. Use the drop-down at the top of the section to toggle the graph between pre-defined time lengths and the results of the test to each configured IP address.
Review the results of tests to additional destinations by toggling the Connectivity to drop-down under Security & SD-WAN > Configure > SD-WAN & Traffic Shaping > Uplink statistics. For more information on this feature, refer to SD-WAN and Traffic Shaping.
The MX uses ping to test connectivity and gather the displayed results. If ICMP is blocked upstream, or if the remote end is configured to not respond, this graph displays 100% loss while the uplink may still be working as expected.

Troubleshooting
Inactive uplink states
Failed
The WAN interface is enabled, but the link is not providing internet connectivity and is failing the connection monitoring tests.
Troubleshooting:
- If using a static IP assignment, ensure that the IP addressing information is correct.
- If using DHCP, confirm that the device is obtaining a usable IP address.
- Confirm that the gateway is sending ARP replies to the MX. For more information, refer to Bad IP Assignment Configuration.
- Investigate the gateway to determine if it is passing traffic received from the MX.
Not Connected
The WAN interface is enabled, but no cable is connected or the cable is not detected.
Troubleshooting:
- Ensure that the cable is properly seated in the Ethernet ports on both ends.
- Test using a different, known-working cable.
- Confirm that the port is enabled on the remote (non-MX) end of the cable.
- Try connecting to another port on the remote (non-MX) end of the cable.
Disabled
The WAN interface is disabled on the dashboard. To enable it:
-
Select the edit (pencil) button next to the disabled WAN port on the dashboard.
-
Select either DHCP or Static IP to enable it.
Changing WAN settings
Do not change the WAN IP details on the dashboard when there is only one WAN link. Entering incorrect IP information could take the MX offline and prevent it from reaching the cloud and pulling updated configuration.
Modifying any of the following items resets the WAN interfaces:
- State (enabled/disabled) of any WAN interface
- Addressing method (static/DHCP) of any WAN interface
- State (enabled/disabled) of any LAN interface
This results in a loss of connectivity on both internet uplinks for up to 2 minutes. Make these changes only during a planned maintenance window so that disruption is minimal.
Event logs
Several event logshelp determine the occurrences of uplink failovers and why an uplink may have failed:
- Primary uplink status change — Logged when the primary uplink of the MX appliance fails over. For more information, refer to Primary Uplink Status.
- Bad Gateway — Events related to communication issues with the gateway. Two reasons cause this event to be logged:
- No_lan_connectivity — The gateway is not responding to ARP requests.
- No_inet_connectivity — The internet and/or DNS connectivity tests are not passing.
Frequently asked questions
Why is the MX not using the static IP address that I configured? If an MX cannot communicate with its gateway using the statically configured addressing information, the MX fails over to DHCP. So, if you configured a static IP address but the Uplink tab shows a DHCP address, confirm that the static IP addressing information is correct and that the upstream device is responding as expected. For more details, refer to Bad IP Assignment Configuration
How do I configure or stage a static IP address for an MX that is not online? When an MX is not connected to the Meraki dashboard but requires a static IP address to connect, connect to the local status page of the MX to configure the static IP address. For more information, refer to Static IP Assignment.
What if I'm using a PPPoE connection? Configure PPPoE on the device's local status page, under the Configure tab, by setting the Connection type to PPPoE. For more information, refer to Support for PPPoE on Cisco Meraki Devices.
Will configuration on the local status page take precedence over the dashboard Uplink section configuration? Yes. Configuration made on the local status page of both MX appliances and Z-Series gateways takes precedence over the dashboard configuration. When the MX comes online after a local change, the dashboard uplink configuration updates automatically to reflect the local changes.